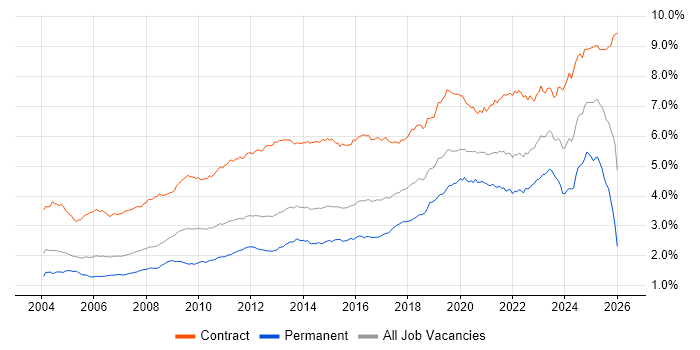
Migration Contracts in London

Migration
England > London

The table below provides summary statistics for contract job vacancies advertised in London requiring Migration skills. It includes a benchmarking guide to the contractor rates offered in vacancies that cited Migration over the 6 months leading up to 2 July 2025, comparing them to the same period in the previous two years.

6 months to
2 Jul 2025
Same period 2024 Same period 2023
Rank 22 19 22
Rank change year-on-year -3 +3 +1
Contract jobs citing Migration 1,192 1,468 1,980
As % of all contract jobs advertised in London 9.18% 8.33% 7.83%
As % of the Processes & Methodologies category 9.95% 9.41% 8.62%
Number of daily rates quoted 777 1,041 1,402
10th Percentile £388 £350 £400
25th Percentile £450 £440 £475
Median daily rate (50th Percentile) £550 £540 £600
Median % change year-on-year +1.85% -10.00% +9.09%
75th Percentile £675 £650 £688
90th Percentile £800 £750 £810
England median daily rate £525 £525 £550
% change year-on-year - -4.55% +4.76%
Number of hourly rates quoted 14 8 5
10th Percentile - £21.59 £29.40
25th Percentile - £22.89 £36.00
Median hourly rate £25.15 £56.87 £52.50
Median % change year-on-year -55.77% +8.31% -4.55%
75th Percentile £32.29 £71.25 £66.00
90th Percentile £65.00 - £84.90
England median hourly rate £25.15 £40.00 £65.00
% change year-on-year -37.13% -38.46% +150.00%

All Process and Methodology Skills
London

Migration falls under the Processes and Methodologies category. For comparison with the information above, the following table provides summary statistics for all contract job vacancies requiring process or methodology skills in London.

Contract vacancies with a requirement for process or methodology skills 11,977 15,594 22,959
As % of all contract IT jobs advertised in London 92.22% 88.54% 90.74%
Number of daily rates quoted 8,005 11,122 16,627
10th Percentile £335 £343 £372
25th Percentile £425 £448 £472
Median daily rate (50th Percentile) £550 £550 £588
Median % change year-on-year - -6.38% +2.17%
75th Percentile £675 £680 £700
90th Percentile £800 £800 £800
England median daily rate £515 £525 £550
% change year-on-year -1.90% -4.55% -
Number of hourly rates quoted 222 302 259
10th Percentile £16.50 £15.95 £18.50
25th Percentile £24.66 £20.02 £23.18
Median hourly rate £32.25 £30.00 £40.50
Median % change year-on-year +7.50% -25.93% +12.50%
75th Percentile £50.50 £48.75 £65.00
90th Percentile £63.70 £68.68 £82.50
England median hourly rate £25.15 £38.12 £37.50
% change year-on-year -34.02% +1.65% +44.23%

Migration
Job Vacancy Trend in London

Job postings citing Migration as a proportion of all IT jobs advertised in London.

Job vacancy trend for Migration in London

Migration
Contractor Daily Rate Trend in London

3-month moving average daily rate quoted in jobs citing Migration in London.

Daily rate trend for Migration in London

Migration
Daily Rate Histogram in London

Daily rate distribution for jobs citing Migration in London over the 6 months to 2 July 2025.

Daily rate histogram for Migration in London

Migration
Contractor Hourly Rate Trend in London

3-month moving average hourly rates quoted in jobs citing Migration in London.

Hourly rate trend for Migration in London

Migration
Hourly Rate Histogram in London

Hourly rate distribution of jobs citing Migration in London over the 6 months to 2 July 2025.

Hourly rate histogram for Migration in London

Migration
Contract Job Locations in London

The table below looks at the demand and provides a guide to the median contractor rates quoted in IT jobs citing Migration within the London region over the 6 months to 2 July 2025. The 'Rank Change' column provides an indication of the change in demand within each location based on the same 6 month period last year.

Location Rank Change
on Same Period
Last Year
Matching
Contract
IT Job Ads
Median
Daily Rate
Past 6 Months
Median Daily Rate
% Change
on Same Period
Last Year
Live
Jobs
Central London 0 190 £550 - 287
West London 0 27 £358 -25.71% 50
South London +14 18 £449 -7.95% 19
North London +3 10 £550 +62.96% 2
East London +9 9 £510 -1.92% 13
Migration
England

Migration
Co-occurring Skills and Capabilities in London by Category

The follow tables expand on the table above by listing co-occurrences grouped by category. The same employment type, locality and period is covered with up to 20 co-occurrences shown in each of the following categories:

Application Platforms
1 59 (4.95%) SharePoint
2 48 (4.03%) Confluence
3 18 (1.51%) CMS
3 18 (1.51%) Microsoft Exchange
4 15 (1.26%) Apache Airflow
5 12 (1.01%) Apache
6 8 (0.67%) SAS
7 6 (0.50%) Apache Spark
7 6 (0.50%) SharePoint 2010
8 5 (0.42%) IIS
9 3 (0.25%) WebSphere
10 2 (0.17%) Drupal
10 2 (0.17%) Headless CMS
10 2 (0.17%) IBM HTTP Server
10 2 (0.17%) JBoss
10 2 (0.17%) Jupyter
10 2 (0.17%) Oracle SOA Suite
10 2 (0.17%) Oracle Workflow
11 1 (0.084%) Tomcat
11 1 (0.084%) WebSphere Application Server
Applications
1 29 (2.43%) Microsoft Excel
2 16 (1.34%) MS Visio
3 15 (1.26%) Microsoft Office
4 10 (0.84%) Microsoft Project
5 6 (0.50%) InfoPath
6 5 (0.42%) Microsoft PowerPoint
7 4 (0.34%) Spreadsheet
8 2 (0.17%) Adobe Illustrator
8 2 (0.17%) Photoshop
9 1 (0.084%) Chatbot
9 1 (0.084%) FileZilla
9 1 (0.084%) Trello
Business Applications
1 54 (4.53%) SAP S/4HANA
2 25 (2.10%) Dynamics CRM
3 13 (1.09%) Oracle EBS
4 8 (0.67%) Salesforce CRM
4 8 (0.67%) Unit4 Business World
5 6 (0.50%) Endur
5 6 (0.50%) SAP CO
6 5 (0.42%) Oracle ERP
6 5 (0.42%) Oracle Payables
6 5 (0.42%) SAP FI
6 5 (0.42%) SAP FI/CO
6 5 (0.42%) SAP MDG
6 5 (0.42%) SAP SD
7 4 (0.34%) Aladdin
7 4 (0.34%) NetSuite
7 4 (0.34%) Oracle Applications
7 4 (0.34%) Oracle EBS R12
7 4 (0.34%) Oracle Procure-to-Pay
7 4 (0.34%) Workday HCM
8 3 (0.25%) Magento
Cloud Services
1 292 (24.50%) Azure
2 197 (16.53%) AWS
3 91 (7.63%) GCP
4 79 (6.63%) Power Platform
5 73 (6.12%) Microsoft 365
6 60 (5.03%) Entra ID
7 51 (4.28%) SaaS
8 43 (3.61%) Snowflake
9 39 (3.27%) Azure DevOps
10 38 (3.19%) Dynamics 365
11 36 (3.02%) IaaS
12 35 (2.94%) GitHub
13 33 (2.77%) Serverless
14 31 (2.60%) PaaS
15 27 (2.27%) Amazon S3
16 25 (2.10%) dbt
17 24 (2.01%) OCI
17 24 (2.01%) Power Automate
18 23 (1.93%) Azure ExpressRoute
19 22 (1.85%) PowerApps
Communications & Networking
1 86 (7.21%) Firewall
2 79 (6.63%) VPN
3 54 (4.53%) DNS
4 32 (2.68%) Network Security
5 27 (2.27%) BGP
6 26 (2.18%) OSPF
7 24 (2.01%) MPLS
7 24 (2.01%) WAN
8 21 (1.76%) DHCP
9 18 (1.51%) NGFW
10 15 (1.26%) LAN
11 13 (1.09%) VLAN
12 10 (0.84%) Cisco ASA
12 10 (0.84%) Multicast
12 10 (0.84%) TCP/IP
13 9 (0.76%) Internet
14 8 (0.67%) IPsec
14 8 (0.67%) SD-WAN
15 7 (0.59%) Cisco Nexus
15 7 (0.59%) Wireless
Database & Business Intelligence
1 65 (5.45%) Data Lake
2 62 (5.20%) Data Warehouse
3 53 (4.45%) SQL Server
4 50 (4.19%) Power BI
5 29 (2.43%) PostgreSQL
6 26 (2.18%) Tableau
7 24 (2.01%) Oracle Database
8 23 (1.93%) SQL Server Integration Services
9 22 (1.85%) Relational Database
10 18 (1.51%) Azure SQL Database
10 18 (1.51%) Metadata
11 16 (1.34%) Amazon RDS
12 15 (1.26%) BigQuery
12 15 (1.26%) Oracle Reports
13 14 (1.17%) Amazon Athena
14 12 (1.01%) SQL Server Reporting Services
15 11 (0.92%) NoSQL
16 9 (0.76%) DB2
16 9 (0.76%) MS Access
16 9 (0.76%) SAP HANA
Development Applications
1 81 (6.80%) JIRA
2 33 (2.77%) GitLab
2 33 (2.77%) Jenkins
3 20 (1.68%) Git
4 14 (1.17%) Liquibase
5 13 (1.09%) Gradle
5 13 (1.09%) ScriptRunner
6 11 (0.92%) JUnit
6 11 (0.92%) Mockito
7 8 (0.67%) LSMW
8 7 (0.59%) ERwin
9 6 (0.50%) Artifactory
9 6 (0.50%) Bitbucket
9 6 (0.50%) ER Studio
9 6 (0.50%) Selenium
9 6 (0.50%) Zephyr
10 4 (0.34%) Sonatype Nexus
10 4 (0.34%) Subversion
11 3 (0.25%) TestRail
11 3 (0.25%) Visual Studio
General
1 453 (38.00%) Finance
2 344 (28.86%) Social Skills
3 131 (10.99%) Analytical Skills
4 114 (9.56%) Banking
5 70 (5.87%) Public Sector
6 60 (5.03%) Front Office
7 51 (4.28%) Marketing
8 31 (2.60%) Retail
8 31 (2.60%) Telecoms
9 30 (2.52%) Inclusion and Diversity
9 30 (2.52%) Legal
10 26 (2.18%) Manufacturing
11 24 (2.01%) Documentation Skills
11 24 (2.01%) Local Government
12 23 (1.93%) Presentation Skills
13 21 (1.76%) Financial Institution
14 20 (1.68%) Investment Banking
15 18 (1.51%) Back Office
15 18 (1.51%) Law
16 17 (1.43%) Organisational Skills
Job Titles
1 184 (15.44%) Architect
2 166 (13.93%) Analyst
3 108 (9.06%) Senior
4 107 (8.98%) Project Manager
5 99 (8.31%) Consultant
6 91 (7.63%) Business Analyst
7 84 (7.05%) Lead
8 73 (6.12%) Developer
9 62 (5.20%) Network Engineer
10 49 (4.11%) Solutions Architect
11 46 (3.86%) Data Analyst
12 45 (3.78%) Azure Engineer
13 44 (3.69%) Data Architect
14 42 (3.52%) Migration Engineer
15 39 (3.27%) Data Engineer
16 32 (2.68%) Cloud Architect
17 27 (2.27%) Azure Architect
18 26 (2.18%) Cloud Engineer
19 25 (2.10%) DevOps Engineer
19 25 (2.10%) Senior Analyst
Libraries, Frameworks & Software Standards
1 31 (2.60%) Kafka
2 23 (1.93%) Spring Boot
3 22 (1.85%) REST
4 20 (1.68%) ARM Templates
4 20 (1.68%) Spring
5 18 (1.51%) .NET
5 18 (1.51%) ADO
5 18 (1.51%) React
6 16 (1.34%) Lightning Web Components
7 14 (1.17%) HTML
7 14 (1.17%) SOAP
8 13 (1.09%) Swagger
9 12 (1.01%) Middleware
10 11 (0.92%) JSON
10 11 (0.92%) OpenAPI
11 10 (0.84%) OAuth
11 10 (0.84%) Oracle Fusion
11 10 (0.84%) PySpark
11 10 (0.84%) SAP Fiori
11 10 (0.84%) Visualforce
Miscellaneous
1 77 (6.46%) Legacy Systems
2 55 (4.61%) Data Centre
3 51 (4.28%) Hedge funds
4 50 (4.19%) Foreign Exchange (FX)
5 47 (3.94%) Derivative
6 45 (3.78%) Fixed Income
7 44 (3.69%) Cloud Native
8 43 (3.61%) Equities
9 29 (2.43%) Data Structures
10 26 (2.18%) Management Information System
11 23 (1.93%) Data Protection Act
11 23 (1.93%) Product Ownership
12 18 (1.51%) Hybrid Cloud
12 18 (1.51%) Onboarding
13 16 (1.34%) Reference Data
14 15 (1.26%) Anti-Spyware
15 14 (1.17%) Greenfield Project
16 13 (1.09%) Legacy Applications
16 13 (1.09%) Public Cloud
16 13 (1.09%) Reinsurance
Operating Systems
1 116 (9.73%) Windows
2 52 (4.36%) Linux
3 34 (2.85%) Windows Server
4 20 (1.68%) Unix
5 18 (1.51%) Windows 10
6 17 (1.43%) Red Hat Enterprise Linux
7 5 (0.42%) Oracle Linux
8 4 (0.34%) AIX
8 4 (0.34%) CentOS
9 3 (0.25%) Solaris
10 2 (0.17%) Apple iOS
10 2 (0.17%) Windows Server 2012
10 2 (0.17%) zOS
11 1 (0.084%) Amazon Linux
11 1 (0.084%) Android
11 1 (0.084%) Mac OS
11 1 (0.084%) Rocky
11 1 (0.084%) Ubuntu
11 1 (0.084%) VMS
Processes & Methodologies
1 359 (30.12%) Data Migration
2 248 (20.81%) Agile
3 198 (16.61%) Problem-Solving
4 149 (12.50%) Stakeholder Management
5 147 (12.33%) DevOps
6 117 (9.82%) Project Management
7 112 (9.40%) CI/CD
8 106 (8.89%) Validation
9 104 (8.72%) Stakeholder Engagement
10 100 (8.39%) Data Governance
11 96 (8.05%) Roadmaps
12 90 (7.55%) Analytics
12 90 (7.55%) ERP
12 90 (7.55%) User Acceptance Testing
13 89 (7.47%) ETL
14 87 (7.30%) Change Management
15 85 (7.13%) Infrastructure as Code
16 82 (6.88%) Data Modelling
17 78 (6.54%) Data Management
18 76 (6.38%) Business Intelligence
Programming Languages
1 179 (15.02%) SQL
2 129 (10.82%) Python
3 65 (5.45%) PowerShell
4 58 (4.87%) Java
5 30 (2.52%) JavaScript
6 28 (2.35%) C#
7 20 (1.68%) Groovy
7 20 (1.68%) TypeScript
8 19 (1.59%) Bicep
9 16 (1.34%) Bash
10 15 (1.26%) PL/SQL
11 14 (1.17%) Apex Code
11 14 (1.17%) C++
11 14 (1.17%) T-SQL
12 10 (0.84%) VBA
13 9 (0.76%) Shell Script
14 8 (0.67%) ABAP
15 7 (0.59%) Go
16 6 (0.50%) VBScript
17 5 (0.42%) C
Qualifications
1 127 (10.65%) Security Cleared
2 119 (9.98%) SC Cleared
3 90 (7.55%) Degree
4 33 (2.77%) Computer Science Degree
5 31 (2.60%) Azure Certification
6 30 (2.52%) PMP
7 28 (2.35%) PMI Certification
8 24 (2.01%) Cisco Certification
9 21 (1.76%) AWS Certification
10 18 (1.51%) Microsoft Certification
11 14 (1.17%) CCNP
12 12 (1.01%) CBAP
13 11 (0.92%) CISSP
14 10 (0.84%) CCNA
15 8 (0.67%) AWS Certified Solutions Architect
16 7 (0.59%) DV Cleared
17 6 (0.50%) BPSS Clearance
17 6 (0.50%) CCIE
17 6 (0.50%) Master's Degree
18 5 (0.42%) CCIE Service Provider
Quality Assurance & Compliance
1 64 (5.37%) Data Quality
2 47 (3.94%) QA
3 31 (2.60%) GDPR
4 15 (1.26%) MiFID
5 14 (1.17%) PMO
6 11 (0.92%) NIST
6 11 (0.92%) SLA
7 10 (0.84%) Accessibility
8 9 (0.76%) ISO/IEC 27001
8 9 (0.76%) PCI DSS
9 8 (0.67%) HIPAA
10 6 (0.50%) ISO 20022
11 5 (0.42%) Sarbanes-Oxley
11 5 (0.42%) SEPA
12 4 (0.34%) SOC 2
13 3 (0.25%) EMIR
13 3 (0.25%) HMG Security Policy Framework
13 3 (0.25%) IFRS
14 2 (0.17%) Dodd-Frank
14 2 (0.17%) ISO 15022
System Software
1 77 (6.46%) Active Directory
2 48 (4.03%) Docker
3 24 (2.01%) VMware Infrastructure
4 12 (1.01%) Virtual Machines
4 12 (1.01%) vSphere
5 9 (0.76%) Hyper-V
6 6 (0.50%) Virtual Desktop
7 5 (0.42%) VMware ESXi
8 4 (0.34%) BitLocker
8 4 (0.34%) Firmware
8 4 (0.34%) Microsoft App-V
9 3 (0.25%) OpenAM
9 3 (0.25%) VMware NSX
10 1 (0.084%) HDFS
10 1 (0.084%) Job Entry Subsystem
10 1 (0.084%) KVM
10 1 (0.084%) Oracle RAC
10 1 (0.084%) Time Sharing Option
10 1 (0.084%) Tivoli Workload Scheduler
Systems Management
1 98 (8.22%) Terraform
2 61 (5.12%) Kubernetes
3 45 (3.78%) Ansible
4 33 (2.77%) Microsoft Intune
5 22 (1.85%) SCCM
6 19 (1.59%) Single Sign-On
7 10 (0.84%) Grafana
7 10 (0.84%) Puppet
7 10 (0.84%) ZABBIX
8 7 (0.59%) Prometheus
9 5 (0.42%) Argo
9 5 (0.42%) CEMLI
10 4 (0.34%) HP ALM
10 4 (0.34%) NetBackup
10 4 (0.34%) Oracle RMAN
11 3 (0.25%) Cisco UCCX
11 3 (0.25%) Oracle Enterprise Manager
11 3 (0.25%) Progress Chef
11 3 (0.25%) Systems Management Server (SMS)
11 3 (0.25%) Tivoli Storage Manager
Vendors
1 199 (16.69%) Microsoft
2 116 (9.73%) SAP
3 110 (9.23%) Oracle
4 51 (4.28%) Google
5 46 (3.86%) Cisco
6 41 (3.44%) Salesforce
7 39 (3.27%) VMware
8 26 (2.18%) IBM
9 24 (2.01%) Workday
10 23 (1.93%) Palo Alto
11 22 (1.85%) CheckPoint
12 21 (1.76%) Infoblox
13 20 (1.68%) ServiceNow
14 17 (1.43%) Atlassian
14 17 (1.43%) Databricks
14 17 (1.43%) Splunk
15 16 (1.34%) Murex
15 16 (1.34%) SolarWinds
16 14 (1.17%) Red Hat
17 13 (1.09%) F5