Windows Jobs in Birmingham

Microsoft Windows
West Midlands > Birmingham

The table below provides summary statistics for permanent job vacancies advertised in Birmingham requiring Windows skills. It includes a benchmarking guide to the annual salaries offered in vacancies that cited Windows over the 6 months leading up to 1 May 2025, comparing them to the same period in the previous two years.

6 months to
1 May 2025
Same period 2024 Same period 2023
Rank 19 20 22
Rank change year-on-year +1 +2 0
Permanent jobs citing Windows 129 209 170
As % of all permanent jobs advertised in Birmingham 8.75% 7.69% 8.51%
As % of the Operating Systems category 72.47% 77.99% 66.67%
Number of salaries quoted 76 184 154
10th Percentile £27,750 £25,575 £25,000
25th Percentile £34,000 £28,000 £27,750
Median annual salary (50th Percentile) £45,000 £38,000 £38,500
Median % change year-on-year +18.42% -1.30% -14.44%
75th Percentile £52,500 £56,250 £55,000
90th Percentile £62,500 £65,500 £66,250
West Midlands median annual salary £36,925 £35,000 £40,000
% change year-on-year +5.50% -12.50% -

All Operating Systems
Birmingham

Windows falls under the Operating Systems category. For comparison with the information above, the following table provides summary statistics for all permanent job vacancies requiring operating system skills in Birmingham.

Permanent vacancies with a requirement for operating system skills 178 268 255
As % of all permanent jobs advertised in Birmingham 12.07% 9.86% 12.77%
Number of salaries quoted 110 220 221
10th Percentile £27,750 £25,750 £25,000
25th Percentile £34,000 £29,750 £29,000
Median annual salary (50th Percentile) £46,750 £42,500 £47,500
Median % change year-on-year +10.00% -10.53% -5.00%
75th Percentile £58,750 £60,000 £57,500
90th Percentile £65,000 £68,750 £75,250
West Midlands median annual salary £36,925 £38,000 £45,000
% change year-on-year -2.83% -15.56% +5.88%

Windows
Job Vacancy Trend in Birmingham

Job postings citing Windows as a proportion of all IT jobs advertised in Birmingham.
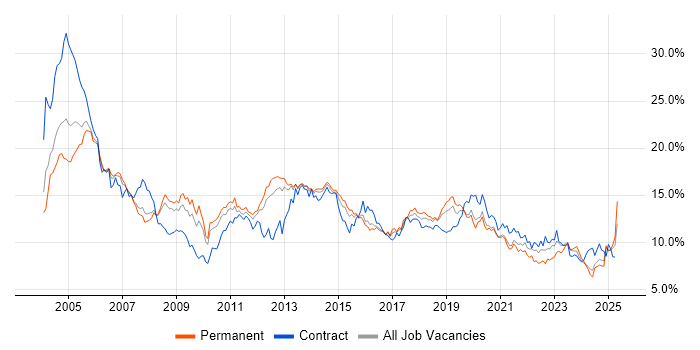
Job vacancy trend for Windows in Birmingham

Windows
Salary Trend in Birmingham

3-month moving average salary quoted in jobs citing Windows in Birmingham.

Salary trend for Windows in Birmingham

Windows
Salary Histogram in Birmingham

Salary distribution for jobs citing Windows in Birmingham over the 6 months to 1 May 2025.

Salary histogram for Windows in Birmingham

Windows
Co-occurring Skills and Capabilities in Birmingham by Category

The follow tables expand on the table above by listing co-occurrences grouped by category. The same employment type, locality and period is covered with up to 20 co-occurrences shown in each of the following categories:

Application Platforms
1 25 (19.38%) Microsoft Exchange
2 9 (6.98%) SharePoint
3 3 (2.33%) Confluence
4 1 (0.78%) CMS
4 1 (0.78%) IIS
4 1 (0.78%) WordPress
Applications
1 16 (12.40%) Microsoft Office
2 3 (2.33%) Mozilla Thunderbird
3 1 (0.78%) Microsoft Excel
3 1 (0.78%) Microsoft PowerPoint
Business Applications
1 6 (4.65%) Oracle EBS
2 4 (3.10%) NEC Housing
2 4 (3.10%) Oracle Applications
3 3 (2.33%) Remedy ITSM
4 2 (1.55%) Dynamics NAV
5 1 (0.78%) Elite 3E
Cloud Services
1 79 (61.24%) Microsoft 365
2 74 (57.36%) Azure
3 17 (13.18%) AWS
4 8 (6.20%) Entra ID
5 7 (5.43%) Amazon EC2
6 4 (3.10%) Azure Sentinel
6 4 (3.10%) Microsoft Purview
6 4 (3.10%) Route 53
7 3 (2.33%) Amazon CloudWatch
7 3 (2.33%) Amazon ECS
7 3 (2.33%) Amazon ELB
7 3 (2.33%) Amazon Glacier
7 3 (2.33%) Amazon GuardDuty
7 3 (2.33%) Amazon S3
7 3 (2.33%) AWS KMS
7 3 (2.33%) AWS Lambda
7 3 (2.33%) Serverless
7 3 (2.33%) Virtual Private Cloud
8 2 (1.55%) OneDrive
8 2 (1.55%) SaaS
Communications & Networking
1 60 (46.51%) WAN
2 54 (41.86%) LAN
3 32 (24.81%) Firewall
4 30 (23.26%) VoIP
5 12 (9.30%) VPN
6 11 (8.53%) DNS
7 10 (7.75%) DHCP
8 8 (6.20%) Wi-Fi
9 7 (5.43%) Network Security
10 6 (4.65%) SD-WAN
10 6 (4.65%) VLAN
11 5 (3.88%) Internet
11 5 (3.88%) WLAN
12 4 (3.10%) HTTPS
13 3 (2.33%) SAN
13 3 (2.33%) SSL
13 3 (2.33%) TCP/IP
14 1 (0.78%) BGP
14 1 (0.78%) Wireless
14 1 (0.78%) Wireshark
Database & Business Intelligence
1 6 (4.65%) Oracle Database
1 6 (4.65%) Oracle Exadata
2 5 (3.88%) Oracle Reports
2 5 (3.88%) SQL Server
3 4 (3.10%) BusinessObjects
3 4 (3.10%) DB2
3 4 (3.10%) MaxDB
3 4 (3.10%) MySQL
3 4 (3.10%) SAP HANA
4 3 (2.33%) Amazon RDS
4 3 (2.33%) Relational Database
5 1 (0.78%) Data Hub
5 1 (0.78%) Elasticsearch
5 1 (0.78%) MongoDB
5 1 (0.78%) SQL CLR
Development Applications
1 3 (2.33%) Bitbucket
1 3 (2.33%) Bitbucket Server
1 3 (2.33%) Git
1 3 (2.33%) Jenkins
1 3 (2.33%) JIRA
1 3 (2.33%) Vagrant
2 1 (0.78%) Appium
2 1 (0.78%) GDB
2 1 (0.78%) IDA Disassembler
2 1 (0.78%) Selenium
2 1 (0.78%) TestComplete
2 1 (0.78%) WebDriver
2 1 (0.78%) WinDbg
General
1 49 (37.98%) Social Skills
2 30 (23.26%) Retail
3 14 (10.85%) Inclusion and Diversity
4 8 (6.20%) Finance
5 7 (5.43%) Analytical Skills
6 5 (3.88%) Law
6 5 (3.88%) Presentation Skills
6 5 (3.88%) Public Sector
7 4 (3.10%) Local Government
7 4 (3.10%) Police
8 3 (2.33%) Legal
9 2 (1.55%) Marketing
10 1 (0.78%) Advertising
10 1 (0.78%) Back Office
10 1 (0.78%) Games
10 1 (0.78%) Organisational Skills
10 1 (0.78%) Telecoms
Job Titles
1 43 (33.33%) IT Support
2 30 (23.26%) IT Support Specialist
2 30 (23.26%) Support Specialist
3 29 (22.48%) Support Engineer
4 15 (11.63%) Infrastructure Engineer
5 14 (10.85%) IT Engineer
6 13 (10.08%) 2nd/3rd Line Support
6 13 (10.08%) 2nd/3rd Line Support Engineer
6 13 (10.08%) 3rd Line Engineer
6 13 (10.08%) 3rd Line Support
6 13 (10.08%) 3rd Line Support Engineer
7 10 (7.75%) Analyst
8 9 (6.98%) Consultant
9 8 (6.20%) Support Consultant
10 7 (5.43%) Infrastructure Support
10 7 (5.43%) Infrastructure Support Engineer
10 7 (5.43%) Service Analyst
10 7 (5.43%) Service Desk Analyst
11 6 (4.65%) Lead
11 6 (4.65%) Senior
Libraries, Frameworks & Software Standards
1 6 (4.65%) Middleware
1 6 (4.65%) Oracle Fusion
1 6 (4.65%) Oracle GoldenGate
2 5 (3.88%) .NET
3 4 (3.10%) SAP Basis
4 1 (0.78%) .NET Core
4 1 (0.78%) .NET Framework
4 1 (0.78%) Dapper ORM
4 1 (0.78%) Entity Framework
4 1 (0.78%) libvirt
4 1 (0.78%) Playwright
4 1 (0.78%) RabbitMQ
Miscellaneous
1 30 (23.26%) CCTV
2 15 (11.63%) Onboarding
3 7 (5.43%) Driving Licence
4 6 (4.65%) Enterprise Software
5 4 (3.10%) iPhone
6 3 (2.33%) Data Protection Act
6 3 (2.33%) iPad
7 2 (1.55%) FMCG
8 1 (0.78%) Clustering
8 1 (0.78%) Cyber Threat
8 1 (0.78%) e-Learning
8 1 (0.78%) Low-Code
8 1 (0.78%) Mobile App
8 1 (0.78%) Private Cloud
8 1 (0.78%) Self-Motivation
8 1 (0.78%) Team-Oriented Environment
8 1 (0.78%) Virtual Team
8 1 (0.78%) Wiki
Operating Systems
1 40 (31.01%) Windows 10
2 35 (27.13%) Windows Server
3 30 (23.26%) Linux
4 21 (16.28%) Windows Server 2016
5 15 (11.63%) Windows Server 2019
6 10 (7.75%) Unix
7 4 (3.10%) AIX
7 4 (3.10%) Solaris
8 3 (2.33%) Apple iOS
8 3 (2.33%) Ubuntu
8 3 (2.33%) VMS
9 1 (0.78%) Mac OS X
Processes & Methodologies
1 35 (27.13%) Cybersecurity
1 35 (27.13%) Problem-Solving
2 22 (17.05%) Mentoring
3 18 (13.95%) Infrastructure Management
4 15 (11.63%) Customer Service
4 15 (11.63%) Infrastructure Engineering
5 14 (10.85%) Data Security
5 14 (10.85%) Network Design
6 13 (10.08%) ITIL
7 12 (9.30%) Asset Management
8 11 (8.53%) Problem Management
9 10 (7.75%) Agile
9 10 (7.75%) Incident Management
9 10 (7.75%) Line Management
10 9 (6.98%) ITSM
11 8 (6.20%) Collaborative Culture
11 8 (6.20%) Performance Tuning
12 7 (5.43%) Continuous Improvement
12 7 (5.43%) Mobile Device Management
12 7 (5.43%) Patch Management
Programming Languages
1 20 (15.50%) PowerShell
1 20 (15.50%) SQL
2 8 (6.20%) Java
2 8 (6.20%) Shell Script
3 6 (4.65%) C#
3 6 (4.65%) PL/SQL
4 5 (3.88%) Python
5 4 (3.10%) ABAP
6 3 (2.33%) Groovy
6 3 (2.33%) Perl
6 3 (2.33%) Ruby
7 2 (1.55%) JavaScript
8 1 (0.78%) C
8 1 (0.78%) C++
8 1 (0.78%) CodeQL
8 1 (0.78%) PHP
8 1 (0.78%) VB
Qualifications
1 37 (28.68%) Degree
2 17 (13.18%) Microsoft Certification
3 11 (8.53%) MCP
4 8 (6.20%) Security Cleared
5 7 (5.43%) CCNA
5 7 (5.43%) Cisco Certification
5 7 (5.43%) MCSA
6 6 (4.65%) A+ Certification
6 6 (4.65%) Computer Science Degree
7 5 (3.88%) CCNP
7 5 (3.88%) DBS Check
7 5 (3.88%) LPIC
7 5 (3.88%) MCSE
7 5 (3.88%) OCA
7 5 (3.88%) OCP
7 5 (3.88%) Oracle Certification
8 4 (3.10%) AWS Certification
8 4 (3.10%) Azure Certification
8 4 (3.10%) CompTIA Security+
9 3 (2.33%) BPSS Clearance
Quality Assurance & Compliance
1 9 (6.98%) Accessibility
2 4 (3.10%) ISO 9001
3 2 (1.55%) Cyber Essentials
4 1 (0.78%) GDPR
4 1 (0.78%) QA
System Software
1 79 (61.24%) Active Directory
2 24 (18.60%) VMware Infrastructure
3 14 (10.85%) XenApp
4 7 (5.43%) BitLocker
4 7 (5.43%) Virtual Machines
5 6 (4.65%) Firmware
6 5 (3.88%) Hyper-V
7 4 (3.10%) Docker
7 4 (3.10%) Virtual Desktop
8 1 (0.78%) Xen
Systems Management
1 30 (23.26%) Microsoft Intune
2 8 (6.20%) SCCM
3 6 (4.65%) Ansible
3 6 (4.65%) Oracle RMAN
4 3 (2.33%) Nagios
4 3 (2.33%) Nessus
4 3 (2.33%) Proxmox
4 3 (2.33%) Terraform
Vendors
1 72 (55.81%) Microsoft
2 31 (24.03%) VMware
3 27 (20.93%) Cisco
4 24 (18.60%) Citrix
5 15 (11.63%) Meraki
6 14 (10.85%) CheckPoint
6 14 (10.85%) SonicWALL
7 10 (7.75%) Oracle
8 9 (6.98%) Apple
9 7 (5.43%) HP
10 6 (4.65%) MobileIron
11 4 (3.10%) Juniper
11 4 (3.10%) NEC
11 4 (3.10%) SAP
11 4 (3.10%) ServiceNow
12 3 (2.33%) Atlassian
12 3 (2.33%) McAfee
12 3 (2.33%) Remedy
13 1 (0.78%) Aruba
13 1 (0.78%) Veeam