SharePoint Jobs in Birmingham

Microsoft SharePoint
West Midlands > Birmingham

The table below provides summary statistics for permanent job vacancies advertised in Birmingham requiring SharePoint skills. It includes a benchmarking guide to the annual salaries offered in vacancies that cited SharePoint over the 6 months leading up to 12 May 2025, comparing them to the same period in the previous two years.

6 months to
12 May 2025
Same period 2024 Same period 2023
Rank 77 35 56
Rank change year-on-year -42 +21 +31
Permanent jobs citing SharePoint 30 149 86
As % of all permanent jobs advertised in Birmingham 2.09% 5.40% 4.42%
As % of the Application Platforms category 25.21% 44.88% 39.09%
Number of salaries quoted 29 133 60
10th Percentile £33,950 £36,250 £27,450
25th Percentile £34,000 £41,250 £31,250
Median annual salary (50th Percentile) £45,000 £55,000 £52,000
Median % change year-on-year -18.18% +5.77% +4.00%
75th Percentile £46,000 £63,750 £71,250
90th Percentile £64,750 £75,000 £85,000
West Midlands median annual salary £45,000 £45,000 £40,000
% change year-on-year - +12.50% -11.11%

All Application Platform Skills
Birmingham

SharePoint falls under the Application Platforms category. For comparison with the information above, the following table provides summary statistics for all permanent job vacancies requiring application platform skills in Birmingham.

Permanent vacancies with a requirement for application platform skills 119 332 220
As % of all permanent jobs advertised in Birmingham 8.31% 12.02% 11.31%
Number of salaries quoted 94 269 188
10th Percentile £33,825 £32,500 £28,886
25th Percentile £42,500 £41,250 £38,966
Median annual salary (50th Percentile) £50,000 £55,000 £55,000
Median % change year-on-year -9.09% - +4.76%
75th Percentile £67,500 £67,500 £67,813
90th Percentile £68,750 £77,500 £85,000
West Midlands median annual salary £50,000 £45,000 £47,500
% change year-on-year +11.11% -5.26% +5.56%

SharePoint
Job Vacancy Trend in Birmingham

Job postings citing SharePoint as a proportion of all IT jobs advertised in Birmingham.
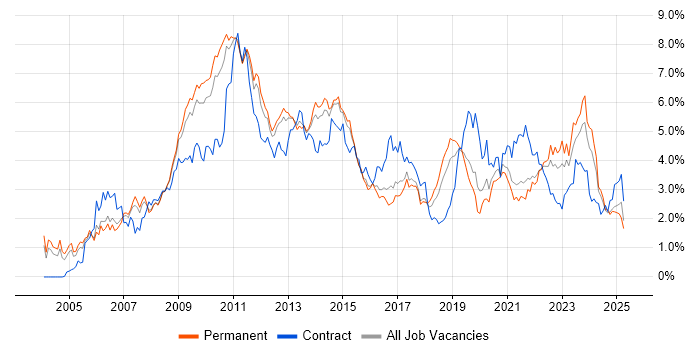
Job vacancy trend for SharePoint in Birmingham

SharePoint
Salary Trend in Birmingham

3-month moving average salary quoted in jobs citing SharePoint in Birmingham.

Salary trend for SharePoint in Birmingham

SharePoint
Salary Histogram in Birmingham

Salary distribution for jobs citing SharePoint in Birmingham over the 6 months to 12 May 2025.

Salary histogram for SharePoint in Birmingham

SharePoint
Co-occurring Skills and Capabilities in Birmingham by Category

The follow tables expand on the table above by listing co-occurrences grouped by category. The same employment type, locality and period is covered with up to 20 co-occurrences shown in each of the following categories:

Application Platforms
1 1 (3.33%) Microsoft Exchange
1 1 (3.33%) WordPress
Applications
1 4 (13.33%) Microsoft Office
2 1 (3.33%) MS Visio
Business Applications
1 3 (10.00%) Dynamics CRM
Cloud Services
1 23 (76.67%) Azure
2 15 (50.00%) Power Platform
3 12 (40.00%) Microsoft 365
4 11 (36.67%) Power Automate
4 11 (36.67%) PowerApps
5 9 (30.00%) Azure Data Factory
5 9 (30.00%) IaaS
5 9 (30.00%) PaaS
6 5 (16.67%) Dynamics 365
7 3 (10.00%) Entra ID
7 3 (10.00%) OneDrive
8 2 (6.67%) Azure DevOps
8 2 (6.67%) Azure Functions
8 2 (6.67%) Serverless
9 1 (3.33%) Microsoft Copilot
Communications & Networking
1 1 (3.33%) DHCP
1 1 (3.33%) DNS
Database & Business Intelligence
1 12 (40.00%) Power BI
2 9 (30.00%) Data Warehouse
2 9 (30.00%) SQL Server Integration Services
2 9 (30.00%) SQL Server Reporting Services
2 9 (30.00%) Star Schema
3 2 (6.67%) SQL Server
Development Applications
1 9 (30.00%) SQL Server Management Studio (SSMS)
General
1 12 (40.00%) Finance
2 5 (16.67%) Social Skills
3 1 (3.33%) Analytical Skills
3 1 (3.33%) Inclusion and Diversity
3 1 (3.33%) Legal
3 1 (3.33%) Marketing
Job Titles
1 11 (36.67%) Developer
2 9 (30.00%) Business Developer
2 9 (30.00%) Business Intelligence Developer
2 9 (30.00%) ETL Developer
2 9 (30.00%) Power BI Developer
2 9 (30.00%) SQL BI Developer
2 9 (30.00%) SQL Developer
3 7 (23.33%) Analyst
4 5 (16.67%) Service Analyst
4 5 (16.67%) Service Desk Analyst
4 5 (16.67%) SSIS Developer
5 2 (6.67%) Applications Support
5 2 (6.67%) Applications Support Analyst
5 2 (6.67%) Head of Analysis
5 2 (6.67%) Head of Business Analysis
5 2 (6.67%) IT Engineer
5 2 (6.67%) Project Manager
5 2 (6.67%) Support Analyst
6 1 (3.33%) Administrator
6 1 (3.33%) Programme Manager
Libraries, Frameworks & Software Standards
1 1 (3.33%) Oracle Fusion
Miscellaneous
1 10 (33.33%) Management Information System
2 2 (6.67%) Enterprise Software
3 1 (3.33%) Onboarding
3 1 (3.33%) Product Ownership
Operating Systems
1 9 (30.00%) Windows
2 2 (6.67%) Windows 10
3 1 (3.33%) Windows Server
Processes & Methodologies
1 15 (50.00%) Customer Service
2 13 (43.33%) Business Intelligence
2 13 (43.33%) CRM
3 11 (36.67%) Problem-Solving
4 9 (30.00%) Analytics
4 9 (30.00%) Case Management
4 9 (30.00%) Critical Thinking
4 9 (30.00%) Data Mapping
4 9 (30.00%) Decision-Making
4 9 (30.00%) ETL
4 9 (30.00%) Kimball Methodology
5 5 (16.67%) Agile
6 3 (10.00%) Budget Management
6 3 (10.00%) DevOps
6 3 (10.00%) Project Management
7 2 (6.67%) Business Analysis
7 2 (6.67%) Incident Management
7 2 (6.67%) ITIL
7 2 (6.67%) Problem Management
7 2 (6.67%) Service Delivery
Programming Languages
1 9 (30.00%) SQL
Qualifications
1 1 (3.33%) Degree
1 1 (3.33%) MCSA
1 1 (3.33%) Microsoft Certification
1 1 (3.33%) SC Cleared
1 1 (3.33%) Security Cleared
Quality Assurance & Compliance
1 9 (30.00%) Data Quality
2 2 (6.67%) QA
System Software
1 8 (26.67%) Active Directory
2 1 (3.33%) VMware Infrastructure
Systems Management
1 9 (30.00%) Microsoft Intune
Vendors
1 7 (23.33%) Microsoft
2 6 (20.00%) VMware
3 2 (6.67%) Oracle
4 1 (3.33%) Cisco
4 1 (3.33%) Citrix
4 1 (3.33%) IBM
4 1 (3.33%) Meraki
4 1 (3.33%) Planview
4 1 (3.33%) ServiceNow