Banking Jobs in London

Banking
England > London

The table below looks at the prevalence of the term Banking in permanent job vacancies advertised in London. Included is a benchmarking guide to the salaries offered in vacancies that have cited Banking over the 6 months to 30 November 2023 with a comparison to the same period over the previous 2 years.

6 months to
30 Nov 2023
Same period 2022 Same period 2021
Rank 23 19 47
Rank change year-on-year -4 +28 -19
Permanent jobs citing Banking 1,658 5,385 3,608
As % of all permanent jobs advertised in London 8.83% 11.07% 6.98%
As % of the General category 13.00% 15.52% 11.07%
Number of salaries quoted 1,247 3,488 2,519
10th Percentile £50,000 £47,658 £47,500
25th Percentile £63,631 £62,258 £62,412
Median annual salary (50th Percentile) £85,000 £80,000 £80,000
Median % change year-on-year +6.25% - -
75th Percentile £112,500 £100,000 £102,500
90th Percentile £140,000 £121,250 £122,500
England median annual salary £76,000 £75,000 £77,500
% change year-on-year +1.33% -3.23% -

All General Skills
London

Banking is in the General Skills category. The following table is for comparison with the above and provides summary statistics for all permanent job vacancies advertised in London with a requirement for common skills.

Permanent vacancies with a requirement for common skills 12,755 34,708 32,604
As % of all permanent jobs advertised in London 67.93% 71.33% 63.05%
Number of salaries quoted 9,851 22,544 20,992
10th Percentile £40,000 £41,250 £40,500
25th Percentile £55,480 £53,750 £52,500
Median annual salary (50th Percentile) £75,000 £72,500 £70,000
Median % change year-on-year +3.45% +3.57% -
75th Percentile £95,000 £95,000 £91,250
90th Percentile £120,000 £115,000 £112,500
England median annual salary £60,000 £60,000 £60,000
% change year-on-year - - +4.35%

Banking
Job Vacancy Trend in London

Job postings citing Banking as a proportion of all IT jobs advertised in London.
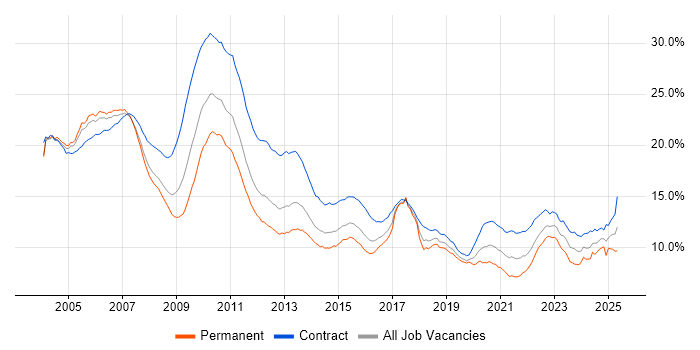
Job vacancy trend for Banking in London

Banking
Salary Trend in London

3-month moving average salary quoted in jobs citing Banking in London.

Salary trend for Banking in London

Banking
Salary Histogram in London

Salary distribution for jobs citing Banking in London over the 6 months to 30 November 2023.

Salary histogram for Banking in London

Banking
Job Locations in London

The table below looks at the demand and provides a guide to the median salaries quoted in IT jobs citing Banking within the London region over the 6 months to 30 November 2023. The 'Rank Change' column provides an indication of the change in demand within each location based on the same 6 month period last year.

Location Rank Change
on Same Period
Last Year
Matching
Permanent
IT Job Ads
Median Salary
Past 6 Months
Median Salary
% Change
on Same Period
Last Year
Live
Jobs
Central London +12 220 £82,500 -2.94% 122
West London +57 8 £85,000 +9.68% 10
South London +34 4 £61,250 -12.50% 3
East London -34 1 £52,500 -27.59% 58
Banking
England

Banking
Co-occurring Skills and Capabilities in London by Category

The follow tables expand on the table above by listing co-occurrences grouped by category. The same employment type, locality and period is covered with up to 20 co-occurrences shown in each of the following categories:

Application Platforms
1 110 (6.63%) Apache
2 92 (5.55%) Apache Airflow
3 40 (2.41%) SharePoint
4 31 (1.87%) Confluence
5 26 (1.57%) Apache Spark
6 18 (1.09%) SAS
7 12 (0.72%) IIS
7 12 (0.72%) MS Exchange
8 10 (0.60%) Tomcat
8 10 (0.60%) WebSphere
9 6 (0.36%) Camunda
10 5 (0.30%) WebSphere Application Server
11 4 (0.24%) Jetty
11 4 (0.24%) Jupyter
12 3 (0.18%) Captiva
12 3 (0.18%) FileNet
12 3 (0.18%) IBM HTTP Server
12 3 (0.18%) Oracle HTTP Server
13 2 (0.12%) nginx
14 1 (0.060%) Apache Solr
Applications
1 166 (10.01%) Microsoft Excel
2 153 (9.23%) Microsoft Office
3 144 (8.69%) Microsoft PowerPoint
4 9 (0.54%) MS Visio
5 8 (0.48%) Chatbot
6 3 (0.18%) Microsoft Project
7 2 (0.12%) Spreadsheet
Business Applications
1 17 (1.03%) Fidessa
2 13 (0.78%) Adaptiv
2 13 (0.78%) Dynamics CRM
3 8 (0.48%) Temenos T24
4 4 (0.24%) Elite 3E
5 3 (0.18%) Oracle Cash Management
5 3 (0.18%) Oracle ERP
5 3 (0.18%) Oracle FAH
6 2 (0.12%) Alphatax
6 2 (0.12%) Carpe Diem
6 2 (0.12%) Misys Midas
6 2 (0.12%) Oracle Applications
6 2 (0.12%) Oracle EBS
6 2 (0.12%) Oracle Financials
6 2 (0.12%) Salesforce CRM
7 1 (0.060%) FLEXCUBE
7 1 (0.060%) ION Anvil
7 1 (0.060%) Oracle Subledger Accounting
7 1 (0.060%) PlanetPress Connect
7 1 (0.060%) Sparx Enterprise Architect
Cloud Services
1 299 (18.03%) AWS
2 242 (14.60%) GCP
3 236 (14.23%) Azure
4 100 (6.03%) GitHub
5 97 (5.85%) Microsoft 365
6 82 (4.95%) Power Platform
7 62 (3.74%) GitHub Actions
8 55 (3.32%) dbt
9 50 (3.02%) PaaS
10 46 (2.77%) OpenShift
11 44 (2.65%) SaaS
12 29 (1.75%) Azure DevOps
13 28 (1.69%) IaaS
14 24 (1.45%) AWS CloudFormation
14 24 (1.45%) Entra ID
15 21 (1.27%) Vertex AI
16 17 (1.03%) Dynamics 365
17 14 (0.84%) Cloud Computing
17 14 (0.84%) Serverless
18 11 (0.66%) WhatsApp
Communications & Networking
1 60 (3.62%) Firewall
2 52 (3.14%) DNS
3 41 (2.47%) DHCP
4 34 (2.05%) Internet
5 32 (1.93%) TCP/IP
6 25 (1.51%) VPN
7 21 (1.27%) LAN
8 19 (1.15%) Intranet
9 17 (1.03%) Wi-Fi
10 16 (0.97%) FIX Connectivity
10 16 (0.97%) WAN
11 13 (0.78%) Wireless
12 12 (0.72%) HTTP
13 11 (0.66%) SAN
14 10 (0.60%) Network Security
15 5 (0.30%) Cisco IOS
15 5 (0.30%) Wireshark
16 4 (0.24%) 3G
16 4 (0.24%) Cisco Nexus
16 4 (0.24%) IPv4
Database & Business Intelligence
1 78 (4.70%) Apache Ignite
2 72 (4.34%) Power BI
3 64 (3.86%) SQL Server
4 56 (3.38%) PostgreSQL
5 54 (3.26%) Apache Arrow
5 54 (3.26%) Dremio
6 52 (3.14%) Amazon Athena
7 48 (2.90%) Data Warehouse
8 44 (2.65%) NoSQL
9 38 (2.29%) Data Lake
10 33 (1.99%) Tableau
11 26 (1.57%) Big Data
12 25 (1.51%) Relational Database
13 23 (1.39%) BigQuery
14 21 (1.27%) MySQL
14 21 (1.27%) SQL Server Integration Services
15 18 (1.09%) Looker
16 17 (1.03%) Bigtable
16 17 (1.03%) SQL Server Reporting Services
17 15 (0.90%) Oracle Database
Development Applications
1 81 (4.89%) Jenkins
2 69 (4.16%) Git
3 62 (3.74%) JIRA
4 38 (2.29%) GitLab
5 31 (1.87%) Cypress.io
6 26 (1.57%) Maven
7 17 (1.03%) Cucumber
8 15 (0.90%) JUnit
8 15 (0.90%) TeamCity
9 14 (0.84%) SonarQube
10 12 (0.72%) Atlassian Bamboo
10 12 (0.72%) Bitbucket
10 12 (0.72%) Selenium
11 8 (0.48%) WebDriver
12 7 (0.42%) Sonatype Nexus
13 6 (0.36%) Gatling
13 6 (0.36%) LoadRunner
13 6 (0.36%) Postman
14 5 (0.30%) IBM UrbanCode
14 5 (0.30%) Spinnaker
General
1 1,317 (79.43%) Finance
2 503 (30.34%) Investment Banking
3 351 (21.17%) Social Skills
4 245 (14.78%) Front Office
5 165 (9.95%) Analytical Skills
6 106 (6.39%) Retail
7 79 (4.76%) Inclusion and Diversity
8 58 (3.50%) Legal
9 57 (3.44%) Telecoms
10 50 (3.02%) Financial Institution
11 49 (2.96%) Back Office
12 42 (2.53%) French Language
13 40 (2.41%) Private Banking
13 40 (2.41%) Retail Banking
14 36 (2.17%) Presentation Skills
15 34 (2.05%) Marketing
16 23 (1.39%) Public Sector
17 22 (1.33%) Law
18 20 (1.21%) Documentation Skills
19 17 (1.03%) Influencing Skills
Job Titles
1 413 (24.91%) Analyst
2 305 (18.40%) Developer
3 156 (9.41%) Senior
4 138 (8.32%) Lead
5 125 (7.54%) Software Engineer
6 119 (7.18%) Architect
7 117 (7.06%) Business Strategy Analyst
7 117 (7.06%) Strategy Analyst
8 103 (6.21%) Java Developer
9 95 (5.73%) AWS Engineer
10 89 (5.37%) Banking Analyst
11 88 (5.31%) Python Developer
12 86 (5.19%) Developer/Software Engineer
13 75 (4.52%) Python Engineer
14 66 (3.98%) Business Analyst
14 66 (3.98%) DevOps Engineer
15 64 (3.86%) Consultant
16 54 (3.26%) AWS Developer
17 52 (3.14%) AWS Software Engineer
18 50 (3.02%) Python Software Engineer
Libraries, Frameworks & Software Standards
1 83 (5.01%) .NET
2 78 (4.70%) React
3 76 (4.58%) gRPC
4 64 (3.86%) Kafka
5 60 (3.62%) Protocol Buffers
6 55 (3.32%) NumPy
6 55 (3.32%) Pandas
7 52 (3.14%) SciPy
8 51 (3.08%) Spring
9 48 (2.90%) FIX Protocol
10 45 (2.71%) Redux
11 41 (2.47%) Web Services
12 37 (2.23%) Node.js
13 35 (2.11%) REST
14 34 (2.05%) Spring Boot
15 33 (1.99%) AngularJS
16 31 (1.87%) HTML
17 28 (1.69%) Material-UI
18 26 (1.57%) RESTful
19 22 (1.33%) CSS
Miscellaneous
1 130 (7.84%) Self-Motivation
2 79 (4.76%) Derivative
3 77 (4.64%) Fixed Income
4 72 (4.34%) Equities
5 70 (4.22%) Public Cloud
6 61 (3.68%) Foreign Exchange (FX)
7 54 (3.26%) Hedge funds
8 46 (2.77%) Greenfield Project
9 43 (2.59%) Onboarding
10 38 (2.29%) Credit Risk
11 36 (2.17%) Product Ownership
12 33 (1.99%) Management Information System
13 28 (1.69%) Algorithms
13 28 (1.69%) Mobile App
14 26 (1.57%) Distributed Systems
15 24 (1.45%) Data Centre
16 23 (1.39%) Blockchain
17 22 (1.33%) Cloud Native
18 21 (1.27%) Mainframe
19 20 (1.21%) Market Risk
Operating Systems
1 139 (8.38%) Windows
2 112 (6.76%) Linux
3 75 (4.52%) Unix
4 53 (3.20%) Windows 10
5 41 (2.47%) Windows Server
6 32 (1.93%) Red Hat Enterprise Linux
7 23 (1.39%) Android
8 22 (1.33%) Apple iOS
9 19 (1.15%) Solaris
10 15 (0.90%) Ubuntu
11 14 (0.84%) CentOS
12 7 (0.42%) AIX
12 7 (0.42%) Windows Server 2016
13 5 (0.30%) Data ONTAP
14 4 (0.24%) HPUX
14 4 (0.24%) Windows Server 2019
15 3 (0.18%) VMS
15 3 (0.18%) Windows 7
15 3 (0.18%) zOS
16 2 (0.12%) Windows Server 2012
Processes & Methodologies
1 538 (32.45%) Agile
2 348 (20.99%) Asset Management
3 236 (14.23%) DevOps
4 212 (12.79%) Analytics
4 212 (12.79%) Software Engineering
5 194 (11.70%) Problem-Solving
6 168 (10.13%) CI/CD
7 156 (9.41%) Business Strategy
8 138 (8.32%) Roadmaps
9 125 (7.54%) Competitor Analysis
9 125 (7.54%) Planning and Forecasting
9 125 (7.54%) Stakeholder Management
10 123 (7.42%) Benchmarking
11 119 (7.18%) Creative Thinking
12 118 (7.12%) Business Forecasting
13 112 (6.76%) Microservices
13 112 (6.76%) Migration
14 102 (6.15%) Artificial Intelligence
15 97 (5.85%) Test Automation
16 96 (5.79%) Mentoring
Programming Languages
1 328 (19.78%) Python
2 295 (17.79%) Java
3 283 (17.07%) SQL
4 161 (9.71%) JavaScript
5 108 (6.51%) TypeScript
6 98 (5.91%) C#
7 77 (4.64%) PowerShell
8 55 (3.32%) Go
9 42 (2.53%) Ruby
10 36 (2.17%) Bash
11 29 (1.75%) Perl
12 27 (1.63%) C++
13 23 (1.39%) Scala
14 17 (1.03%) R
15 15 (0.90%) Korn
15 15 (0.90%) T-SQL
16 13 (0.78%) Clojure
16 13 (0.78%) Data Analysis Expressions
16 13 (0.78%) VBA
17 12 (0.72%) Rust
Qualifications
1 197 (11.88%) Degree
2 44 (2.65%) Computer Science Degree
3 39 (2.35%) Master's Degree
4 23 (1.39%) Cisco Certification
5 20 (1.21%) CCNP
6 19 (1.15%) CFA
7 15 (0.90%) ACCA
8 13 (0.78%) CCIE
9 9 (0.54%) AWS Certification
9 9 (0.54%) Azure Certification
9 9 (0.54%) CISM
9 9 (0.54%) CISSP
9 9 (0.54%) Microsoft Certification
10 8 (0.48%) CCNA
10 8 (0.48%) MCSA
10 8 (0.48%) Security Cleared
11 6 (0.36%) CCIE Routing and Switching
11 6 (0.36%) ITIL Certification
11 6 (0.36%) PMI Certification
12 5 (0.30%) PMP
Quality Assurance & Compliance
1 47 (2.83%) QA
2 46 (2.77%) SLA
3 30 (1.81%) Data Quality
4 17 (1.03%) ISO/IEC 27001
5 16 (0.97%) PMO
6 15 (0.90%) GDPR
7 13 (0.78%) MiFID
8 12 (0.72%) GAAP
9 9 (0.54%) Cyber Essentials
9 9 (0.54%) NIST
10 8 (0.48%) Accessibility
11 7 (0.42%) IFRS
12 5 (0.30%) IFRS 9
13 4 (0.24%) EMIR
14 3 (0.18%) Actionable Recommendations
14 3 (0.18%) Basel III
14 3 (0.18%) COBIT
14 3 (0.18%) Cyber Essentials PLUS
14 3 (0.18%) NCSC
15 2 (0.12%) SOC 2
System Software
1 100 (6.03%) Active Directory
2 97 (5.85%) Docker
3 25 (1.51%) Virtual Machines
4 18 (1.09%) VMware Infrastructure
5 11 (0.66%) vSphere
6 7 (0.42%) VMware ESXi
7 4 (0.24%) Virtual Desktop
8 3 (0.18%) Oracle RAC
8 3 (0.18%) VMware NSX
9 2 (0.12%) Apache ZooKeeper
9 2 (0.12%) DFS Replication
9 2 (0.12%) HDFS
10 1 (0.060%) Apache Flume
10 1 (0.060%) Ceph
10 1 (0.060%) GFS2
10 1 (0.060%) GPFS
10 1 (0.060%) Hyper-V
10 1 (0.060%) iptables
10 1 (0.060%) OpenAM
10 1 (0.060%) Slurm Workload Manager
Systems Management
1 144 (8.69%) Kubernetes
2 99 (5.97%) Terraform
3 38 (2.29%) Rancher
4 33 (1.99%) Argo
5 27 (1.63%) SCCM
6 26 (1.57%) Ansible
7 18 (1.09%) Control-M
7 18 (1.09%) Single Sign-On
8 17 (1.03%) Puppet
9 15 (0.90%) Active Directory Federation Services
10 14 (0.84%) Oracle Enterprise Manager
11 13 (0.78%) Microsoft Intune
11 13 (0.78%) Red Hat Satellite
11 13 (0.78%) SafeCom
12 7 (0.42%) Istio
12 7 (0.42%) NetBackup
12 7 (0.42%) Prometheus
13 6 (0.36%) Cisco CUCM
13 6 (0.36%) Grafana
14 4 (0.24%) Cisco UCCX
Vendors
1 258 (15.56%) Microsoft
2 83 (5.01%) Oracle
3 74 (4.46%) Google
4 52 (3.14%) Bloomberg
5 44 (2.65%) Red Hat
6 43 (2.59%) Cisco
7 35 (2.11%) VMware
8 32 (1.93%) ServiceNow
9 24 (1.45%) IBM
10 23 (1.39%) Citrix
11 18 (1.09%) Reuters
11 18 (1.09%) Veritas
12 17 (1.03%) Sun
12 17 (1.03%) TOWER Software
13 16 (0.97%) CA
13 16 (0.97%) Fortinet
13 16 (0.97%) Salesforce
13 16 (0.97%) SolarWinds
14 15 (0.90%) ION Trading
15 13 (0.78%) Patsystems