Linux Jobs in the East Midlands

Linux
England > East Midlands

The table below provides summary statistics for permanent job vacancies advertised in the East Midlands requiring Linux skills. It includes a benchmarking guide to the annual salaries offered in vacancies that cited Linux over the 6 months leading up to 26 July 2024, comparing them to the same period in the previous two years.

6 months to
26 Jul 2024
Same period 2023 Same period 2022
Rank 29 59 36
Rank change year-on-year +30 -23 -12
Permanent jobs citing Linux 283 129 243
As % of all permanent jobs advertised in the East Midlands 6.24% 5.21% 6.93%
As % of the Operating Systems category 44.08% 27.51% 33.38%
Number of salaries quoted 150 55 158
10th Percentile £33,750 £37,500 £35,000
25th Percentile £37,500 £44,641 £43,125
Median annual salary (50th Percentile) £47,500 £55,000 £53,750
Median % change year-on-year -13.64% +2.33% +19.44%
75th Percentile £57,500 £67,500 £65,000
90th Percentile £60,000 £71,500 £80,000
England median annual salary £56,000 £63,150 £60,000
% change year-on-year -11.32% +5.25% +4.35%

All Operating Systems
East Midlands

Linux falls under the Operating Systems category. For comparison with the information above, the following table provides summary statistics for all permanent job vacancies requiring operating system skills in the East Midlands.

Permanent vacancies with a requirement for operating system skills 642 469 728
As % of all permanent jobs advertised in the East Midlands 14.16% 18.95% 20.78%
Number of salaries quoted 462 240 539
10th Percentile £24,750 £25,000 £24,750
25th Percentile £30,000 £27,688 £28,000
Median annual salary (50th Percentile) £40,000 £47,500 £45,000
Median % change year-on-year -15.79% +5.56% +5.88%
75th Percentile £51,000 £57,500 £55,000
90th Percentile £58,750 £66,250 £65,000
England median annual salary £47,500 £52,500 £52,500
% change year-on-year -9.52% - +5.00%

Linux
Job Vacancy Trend in the East Midlands

Job postings citing Linux as a proportion of all IT jobs advertised in the East Midlands.
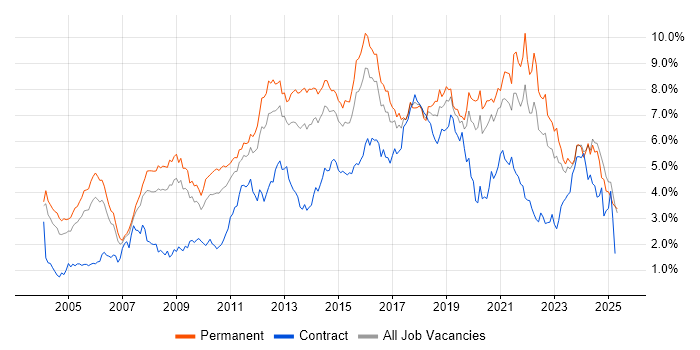
Job vacancy trend for Linux in the East Midlands

Linux
Salary Trend in the East Midlands

3-month moving average salary quoted in jobs citing Linux in the East Midlands.

Salary trend for Linux in the East Midlands

Linux
Salary Histogram in the East Midlands

Salary distribution for jobs citing Linux in the East Midlands over the 6 months to 26 July 2024.

Salary histogram for Linux in the East Midlands

Linux
Job Locations in the East Midlands

The table below looks at the demand and provides a guide to the median salaries quoted in IT jobs citing Linux within the East Midlands region over the 6 months to 26 July 2024. The 'Rank Change' column provides an indication of the change in demand within each location based on the same 6 month period last year.

Location Rank Change
on Same Period
Last Year
Matching
Permanent
IT Job Ads
Median Salary
Past 6 Months
Median Salary
% Change
on Same Period
Last Year
Live
Jobs
Leicestershire +20 116 £45,000 -8.70% 3
Derbyshire +33 62 £50,000 +0.27% 2
Northamptonshire -15 51 £40,000 -38.46% 3
Nottinghamshire +1 46 £47,500 -20.83% 9
Lincolnshire -1 2 £40,000 +33.33% 1
Linux
England

Linux
Co-occurring Skills and Capabilities in the East Midlands by Category

The follow tables expand on the table above by listing co-occurrences grouped by category. The same employment type, locality and period is covered with up to 20 co-occurrences shown in each of the following categories:

Application Platforms
1 8 (2.83%) Apache
2 4 (1.41%) Apache Spark
2 4 (1.41%) IIS
2 4 (1.41%) SharePoint
2 4 (1.41%) WebLogic
3 2 (0.71%) Confluence
3 2 (0.71%) Microsoft Exchange
4 1 (0.35%) CMS
4 1 (0.35%) Drupal
4 1 (0.35%) NetWeaver
4 1 (0.35%) OpenStack
4 1 (0.35%) PrestaShop
4 1 (0.35%) SAP Portal
4 1 (0.35%) WebSphere
4 1 (0.35%) WebSphere Application Server
4 1 (0.35%) WordPress
Applications
1 1 (0.35%) CATIA
1 1 (0.35%) GNU Octave
1 1 (0.35%) Microsoft Excel
1 1 (0.35%) NASTRAN
Business Applications
1 4 (1.41%) Sparx Enterprise Architect
2 1 (0.35%) Magento
2 1 (0.35%) Maximo
2 1 (0.35%) SAP CRM
2 1 (0.35%) SAP GRC
2 1 (0.35%) SAP MDG
2 1 (0.35%) SAP S/4HANA
2 1 (0.35%) Shopify
2 1 (0.35%) Teamcenter
Cloud Services
1 118 (41.70%) Azure
2 71 (25.09%) IBM Cloud
3 48 (16.96%) AWS
4 20 (7.07%) Microsoft 365
5 14 (4.95%) SaaS
6 7 (2.47%) Entra ID
7 5 (1.77%) Amazon EKS
7 5 (1.77%) Amazon S3
7 5 (1.77%) Azure DevOps
8 4 (1.41%) Amazon SQS
8 4 (1.41%) Azure Pipelines
9 3 (1.06%) AWS IoT
9 3 (1.06%) GCP
9 3 (1.06%) GitHub
9 3 (1.06%) Google Workspace
10 1 (0.35%) DigitalOcean
10 1 (0.35%) IaaS
10 1 (0.35%) OpenShift
10 1 (0.35%) PaaS
10 1 (0.35%) WhatsApp
Communications & Networking
1 39 (13.78%) Firewall
2 32 (11.31%) Internet
3 21 (7.42%) DNS
4 15 (5.30%) Network Security
4 15 (5.30%) TCP/IP
4 15 (5.30%) WLAN
5 14 (4.95%) VPN
6 13 (4.59%) DHCP
6 13 (4.59%) IPsec
7 12 (4.24%) DVB
7 12 (4.24%) VLAN
8 9 (3.18%) SAN
9 8 (2.83%) BGP
10 6 (2.12%) NetScaler
11 5 (1.77%) 802.11
11 5 (1.77%) Cisco Nexus
11 5 (1.77%) SNMP
11 5 (1.77%) Wireshark
12 4 (1.41%) MQTT
12 4 (1.41%) SSL
Database & Business Intelligence
1 82 (28.98%) PostgreSQL
2 80 (28.27%) MongoDB
3 72 (25.44%) DB2
4 71 (25.09%) NoSQL
5 18 (6.36%) SQL Server
6 9 (3.18%) Elasticsearch
6 9 (3.18%) Relational Database
7 8 (2.83%) Oracle Database
8 7 (2.47%) Data Warehouse
8 7 (2.47%) MySQL
9 5 (1.77%) RDBMS
10 4 (1.41%) Amazon RDS
10 4 (1.41%) Big Data
10 4 (1.41%) Redis
11 3 (1.06%) MariaDB
12 2 (0.71%) Data Lake
12 2 (0.71%) Ingres
13 1 (0.35%) SAP BW
13 1 (0.35%) SAP HANA
Development Applications
1 17 (6.01%) Git
2 14 (4.95%) Visual Studio
3 12 (4.24%) JIRA
4 4 (1.41%) GitLab
4 4 (1.41%) Jenkins
5 2 (0.71%) gulp
6 1 (0.35%) Bitbucket
6 1 (0.35%) Cucumber
6 1 (0.35%) PHPUnit
6 1 (0.35%) Selenium
General
1 75 (26.50%) Public Sector
2 71 (25.09%) Inclusion and Diversity
3 48 (16.96%) Social Skills
4 26 (9.19%) Manufacturing
5 23 (8.13%) Electronics
6 20 (7.07%) Telecoms
7 17 (6.01%) Finance
8 14 (4.95%) Analytical Skills
9 13 (4.59%) Law
10 7 (2.47%) Aerospace
10 7 (2.47%) Documentation Skills
11 6 (2.12%) Marketing
12 2 (0.71%) Health Technology
12 2 (0.71%) iGaming
12 2 (0.71%) Retail
13 1 (0.35%) Aviation
13 1 (0.35%) Dutch Language
13 1 (0.35%) German Language
13 1 (0.35%) Influencing Skills
13 1 (0.35%) Spanish Language
Job Titles
1 74 (26.15%) Azure Engineer
2 71 (25.09%) Full Stack Engineer
3 34 (12.01%) Software Engineer
4 33 (11.66%) Infrastructure Engineer
5 32 (11.31%) Linux Engineer
6 30 (10.60%) Embedded Engineer
7 28 (9.89%) IT Engineer
7 28 (9.89%) Senior
8 24 (8.48%) Support Engineer
9 22 (7.77%) IT Support
10 20 (7.07%) Administrator
11 17 (6.01%) Systems Engineer
12 16 (5.65%) Developer
12 16 (5.65%) Linux Systems Engineer
13 15 (5.30%) Cloud Engineer
13 15 (5.30%) Embedded Software Engineer
13 15 (5.30%) IT Support Engineer
14 14 (4.95%) Design Engineer
14 14 (4.95%) Systems Administrator
15 13 (4.59%) AWS Engineer
Libraries, Frameworks & Software Standards
1 89 (31.45%) .NET
2 86 (30.39%) HTML
3 85 (30.04%) CSS
4 76 (26.86%) REST
5 75 (26.50%) jQuery
6 73 (25.80%) React
6 73 (25.80%) Web Services
7 72 (25.44%) AngularJS
7 72 (25.44%) Vue
8 71 (25.09%) ASP.NET
8 71 (25.09%) ASP.NET Core
8 71 (25.09%) Backbone.js
8 71 (25.09%) Ember.js
8 71 (25.09%) Twitter Bootstrap
9 11 (3.89%) MFC
10 9 (3.18%) RabbitMQ
11 6 (2.12%) Qt
12 5 (1.77%) 802.1X
12 5 (1.77%) YAML
13 4 (1.41%) Spring Boot
Miscellaneous
1 78 (27.56%) Data Structures
2 74 (26.15%) Algorithms
3 71 (25.09%) Blockchain
3 71 (25.09%) e-Learning
3 71 (25.09%) Hybrid Cloud
4 24 (8.48%) Driving Licence
5 18 (6.36%) Self-Motivation
6 17 (6.01%) Management Information System
7 15 (5.30%) FPGA
7 15 (5.30%) Onboarding
8 13 (4.59%) Data Centre
9 12 (4.24%) VHDL
10 8 (2.83%) Public Cloud
11 7 (2.47%) Embedded Systems
11 7 (2.47%) Renewable Energy
12 6 (2.12%) Enterprise Software
12 6 (2.12%) IoT
13 4 (1.41%) Clustering
13 4 (1.41%) PKI
14 3 (1.06%) Device Driver
Operating Systems
1 145 (51.24%) Windows
2 71 (25.09%) Android
2 71 (25.09%) Apple iOS
3 21 (7.42%) Embedded Linux
4 18 (6.36%) Unix
4 18 (6.36%) Windows Server
5 12 (4.24%) Red Hat Enterprise Linux
6 11 (3.89%) Debian
7 8 (2.83%) CentOS
7 8 (2.83%) SUSE
7 8 (2.83%) Ubuntu
8 6 (2.12%) Windows Server 2016
8 6 (2.12%) Windows Server 2019
9 5 (1.77%) Data ONTAP
10 3 (1.06%) FreeRTOS
11 2 (0.71%) AIX
11 2 (0.71%) Amazon Linux
11 2 (0.71%) Windows Embedded Compact
12 1 (0.35%) Windows Server 2008
12 1 (0.35%) Windows Server 2012
Processes & Methodologies
1 111 (39.22%) Agile
2 95 (33.57%) Mentoring
3 76 (26.86%) OO
4 75 (26.50%) Artificial Intelligence
4 75 (26.50%) SOLID
5 74 (26.15%) OOP
6 73 (25.80%) Coaching
6 73 (25.80%) Full Stack Development
6 73 (25.80%) User Experience
6 73 (25.80%) Web Development
7 72 (25.44%) Code Quality
7 72 (25.44%) Design Patterns
8 71 (25.09%) Co-Creation
8 71 (25.09%) Design Thinking
8 71 (25.09%) MVC
8 71 (25.09%) MVVM
8 71 (25.09%) Responsive Web Design
9 51 (18.02%) Software Engineering
10 50 (17.67%) Problem-Solving
11 46 (16.25%) Computer Science
Programming Languages
1 115 (40.64%) SQL
2 93 (32.86%) C#
3 89 (31.45%) JavaScript
4 65 (22.97%) C++
5 53 (18.73%) C
6 31 (10.95%) Python
7 24 (8.48%) Embedded C
8 18 (6.36%) Java
9 15 (5.30%) PowerShell
10 13 (4.59%) VB
11 12 (4.24%) TypeScript
12 11 (3.89%) Assembly Language
12 11 (3.89%) Shell Script
13 7 (2.47%) Bash
13 7 (2.47%) Embedded C++
14 6 (2.12%) PL/SQL
15 4 (1.41%) PHP
16 1 (0.35%) ABAP
16 1 (0.35%) Delphi
16 1 (0.35%) VB.NET
Qualifications
1 59 (20.85%) Degree
2 29 (10.25%) CCNA
2 29 (10.25%) Cisco Certification
3 22 (7.77%) CCNP
4 21 (7.42%) Computer Science Degree
4 21 (7.42%) Microsoft Certification
5 17 (6.01%) MCSE
5 17 (6.01%) Security Cleared
6 15 (5.30%) LPIC
6 15 (5.30%) MCP
7 12 (4.24%) SC Cleared
8 9 (3.18%) DV Cleared
9 7 (2.47%) Azure Certification
9 7 (2.47%) DBS Check
9 7 (2.47%) VMware Certified Professional (VCP)
10 5 (1.77%) RHCSA
11 4 (1.41%) AWS Certification
11 4 (1.41%) AWS Certified Solutions Architect
11 4 (1.41%) ITIL Foundation Certificate
11 4 (1.41%) Network+ Certification
Quality Assurance & Compliance
1 23 (8.13%) QA
2 12 (4.24%) ISO/IEC 27001
3 7 (2.47%) Data Quality
4 1 (0.35%) GDPR
4 1 (0.35%) HIPAA
4 1 (0.35%) PCI DSS
4 1 (0.35%) Sarbanes-Oxley
System Software
1 30 (10.60%) Docker
2 28 (9.89%) Active Directory
3 26 (9.19%) VMware Infrastructure
4 21 (7.42%) Firmware
5 10 (3.53%) vSphere
6 8 (2.83%) Hyper-V
7 6 (2.12%) Virtual Machines
8 5 (1.77%) XenDesktop
9 4 (1.41%) VMware Server
10 3 (1.06%) Embedded Firmware
10 3 (1.06%) Virtual Servers
11 1 (0.35%) Microsoft Virtual Server
11 1 (0.35%) VMware ESXi
Systems Management
1 25 (8.83%) Kubernetes
2 24 (8.48%) Ansible
3 14 (4.95%) Docker Swarm
4 6 (2.12%) SCOM
4 6 (2.12%) vCenter Server
5 5 (1.77%) Active Directory Federation Services
5 5 (1.77%) EMC NetWorker
5 5 (1.77%) Prometheus
6 4 (1.41%) SCOrch
6 4 (1.41%) vMotion
7 3 (1.06%) Terraform
8 2 (0.71%) Data Guard
8 2 (0.71%) Oracle RMAN
8 2 (0.71%) Progress Chef
9 1 (0.35%) Argo
9 1 (0.35%) Microsoft Intune
9 1 (0.35%) Puppet
9 1 (0.35%) SCSM
9 1 (0.35%) Single Sign-On
9 1 (0.35%) WSUS
Vendors
1 90 (31.80%) Red Hat
2 73 (25.80%) IBM
3 48 (16.96%) Microsoft
4 32 (11.31%) VMware
5 29 (10.25%) Cisco
6 14 (4.95%) Oracle
7 7 (2.47%) Databricks
7 7 (2.47%) EMC
7 7 (2.47%) Palo Alto
8 6 (2.12%) Citrix
8 6 (2.12%) Dell
8 6 (2.12%) ESET
8 6 (2.12%) NetApp
8 6 (2.12%) Ubiquiti
9 5 (1.77%) Google
9 5 (1.77%) SAP
9 5 (1.77%) SolidFire
9 5 (1.77%) Splunk
9 5 (1.77%) Veeam
10 4 (1.41%) Sparx