Analytical Skills Jobs in the East Midlands

Analytical Skills
England > East Midlands

The table below looks at the prevalence of the term Analytical Skills in permanent job vacancies in the East Midlands. Included is a benchmarking guide to the salaries offered in vacancies that cited Analytical Skills over the 6 months leading up to 9 June 2025, comparing them to the same period in the previous two years.

6 months to
9 Jun 2025
Same period 2024 Same period 2023
Rank 31 14 34
Rank change year-on-year -17 +20 -22
Permanent jobs citing Analytical Skills 213 498 189
As % of all permanent jobs advertised in the East Midlands 7.93% 9.53% 7.07%
As % of the General category 12.07% 18.19% 10.51%
Number of salaries quoted 102 229 132
10th Percentile £29,150 £26,750 £30,500
25th Percentile £37,813 £30,500 £36,401
Median annual salary (50th Percentile) £48,250 £41,500 £50,000
Median % change year-on-year +16.27% -17.00% +13.64%
75th Percentile £58,750 £53,750 £60,313
90th Percentile £72,250 £67,500 £71,250
England median annual salary £55,000 £50,000 £55,000
% change year-on-year +10.00% -9.09% -

All General Skills
East Midlands

Analytical Skills falls under the General Skills category. For comparison with the information above, the following table provides summary statistics for all permanent job vacancies requiring common skills in the East Midlands.

Permanent vacancies with a requirement for common skills 1,765 2,738 1,798
As % of all permanent jobs advertised in the East Midlands 65.71% 52.38% 67.27%
Number of salaries quoted 723 1,709 789
10th Percentile £25,267 £25,500 £26,250
25th Percentile £28,750 £30,000 £35,000
Median annual salary (50th Percentile) £41,000 £42,500 £50,000
Median % change year-on-year -3.53% -15.00% +11.11%
75th Percentile £53,750 £55,000 £62,500
90th Percentile £68,525 £65,000 £75,000
England median annual salary £55,000 £52,500 £60,000
% change year-on-year +4.76% -12.50% -

Analytical Skills
Job Vacancy Trend in the East Midlands

Job postings citing Analytical Skills as a proportion of all IT jobs advertised in the East Midlands.
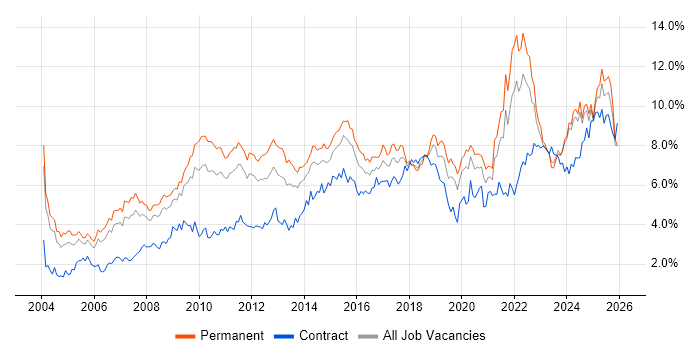
Job vacancy trend for Analytical Skills in the East Midlands

Analytical Skills
Salary Trend in the East Midlands

3-month moving average salary quoted in jobs citing Analytical Skills in the East Midlands.

Salary trend for Analytical Skills in the East Midlands

Analytical Skills
Salary Histogram in the East Midlands

Salary distribution for jobs citing Analytical Skills in the East Midlands over the 6 months to 9 June 2025.

Salary histogram for Analytical Skills in the East Midlands

Analytical Skills
Job Locations in the East Midlands

The table below looks at the demand and provides a guide to the median salaries quoted in IT jobs citing Analytical Skills within the East Midlands region over the 6 months to 9 June 2025. The 'Rank Change' column provides an indication of the change in demand within each location based on the same 6 month period last year.

Location Rank Change
on Same Period
Last Year
Matching
Permanent
IT Job Ads
Median Salary
Past 6 Months
Median Salary
% Change
on Same Period
Last Year
Live
Jobs
Nottinghamshire +9 75 £47,500 -2.06% 63
Leicestershire -7 49 £48,500 +21.25% 49
Derbyshire -13 37 £42,000 +1.20% 26
Lincolnshire +24 35 £37,500 -14.77% 22
Northamptonshire -57 16 £57,500 +43.75% 87
Analytical Skills
England

Analytical Skills
Co-occurring Skills and Capabilities in the East Midlands by Category

The follow tables expand on the table above by listing co-occurrences grouped by category. The same employment type, locality and period is covered with up to 20 co-occurrences shown in each of the following categories:

Application Platforms
1 10 (4.69%) SharePoint
2 6 (2.82%) Microsoft Exchange
3 3 (1.41%) Apache Spark
Applications
1 24 (11.27%) Microsoft Office
2 18 (8.45%) Microsoft Excel
3 14 (6.57%) Chatbot
4 10 (4.69%) Microsoft PowerPoint
5 5 (2.35%) MS Visio
6 3 (1.41%) Microsoft Project
6 3 (1.41%) Trello
7 2 (0.94%) EngageOne
Business Applications
1 9 (4.23%) SAP S/4HANA
2 4 (1.88%) Infor LN
2 4 (1.88%) SAP BPC
3 3 (1.41%) Infor CloudSuite
3 3 (1.41%) Infor CloudSuite Industrial (formerly SyteLine)
3 3 (1.41%) Magento
3 3 (1.41%) Shopify
4 2 (0.94%) Sprinklr
5 1 (0.47%) SAP MDM
Cloud Services
1 27 (12.68%) Azure
2 14 (6.57%) Microsoft 365
2 14 (6.57%) Power Platform
3 10 (4.69%) Google Ads
3 10 (4.69%) Google Analytics
4 8 (3.76%) AWS
5 7 (3.29%) SaaS
6 6 (2.82%) OneDrive
7 5 (2.35%) Azure Data Factory
7 5 (2.35%) Azure DevOps
8 4 (1.88%) GCP
8 4 (1.88%) IaaS
8 4 (1.88%) PaaS
9 3 (1.41%) BigCommerce
10 2 (0.94%) AWS Lambda
10 2 (0.94%) Facebook Ads
10 2 (0.94%) Serverless
11 1 (0.47%) BrowserStack
11 1 (0.47%) Dynamics 365
11 1 (0.47%) Sauce Labs
Communications & Networking
1 11 (5.16%) VPN
2 8 (3.76%) Cisco IOS
3 6 (2.82%) VoIP
4 4 (1.88%) Wi-Fi
5 2 (0.94%) Broadband
5 2 (0.94%) CHAP
5 2 (0.94%) DNS
5 2 (0.94%) SMS
6 1 (0.47%) 4G
6 1 (0.47%) 5G
6 1 (0.47%) Ethernet
6 1 (0.47%) Firewall
6 1 (0.47%) LAN
6 1 (0.47%) Modbus
6 1 (0.47%) Profibus
6 1 (0.47%) WAN
Database & Business Intelligence
1 23 (10.80%) SQL Server
2 18 (8.45%) Tableau
3 15 (7.04%) SQL Server Integration Services
4 13 (6.10%) Power BI
5 11 (5.16%) SQL Server Reporting Services
6 10 (4.69%) Azure SQL Database
7 8 (3.76%) Data Lake
8 6 (2.82%) Data Warehouse
9 3 (1.41%) MS Access
9 3 (1.41%) PostgreSQL
10 1 (0.47%) Big Data
10 1 (0.47%) Data Mining
10 1 (0.47%) Elasticsearch
10 1 (0.47%) Metadata
10 1 (0.47%) Metadata Repository
10 1 (0.47%) MySQL
Development Applications
1 10 (4.69%) Git
2 6 (2.82%) JIRA
3 5 (2.35%) Visual Studio
4 4 (1.88%) Oracle Forms
5 3 (1.41%) Postman
6 2 (0.94%) JMeter
6 2 (0.94%) LoadRunner
7 1 (0.47%) Atlassian Bamboo
7 1 (0.47%) Cucumber
7 1 (0.47%) FitNesse
7 1 (0.47%) Jenkins
7 1 (0.47%) Newman
7 1 (0.47%) SpecFlow
General
1 103 (48.36%) Social Skills
2 44 (20.66%) Finance
2 44 (20.66%) Retail
3 26 (12.21%) Marketing
4 23 (10.80%) Law
5 20 (9.39%) Organisational Skills
6 19 (8.92%) Inclusion and Diversity
7 16 (7.51%) Manufacturing
8 12 (5.63%) Presentation Skills
9 9 (4.23%) Electronics
10 6 (2.82%) Influencing Skills
11 5 (2.35%) Banking
11 5 (2.35%) Financial Institution
11 5 (2.35%) Legal
12 4 (1.88%) Police
13 3 (1.41%) Social Housing
13 3 (1.41%) Tech for Good
14 2 (0.94%) Automotive
14 2 (0.94%) Pharmaceutical
15 1 (0.47%) Health Technology
Job Titles
1 38 (17.84%) Analyst
2 26 (12.21%) Trainer
3 23 (10.80%) Administrator
4 19 (8.92%) Senior
5 13 (6.10%) IT Support
6 10 (4.69%) Data Analyst
6 10 (4.69%) DBA
7 9 (4.23%) Developer
7 9 (4.23%) Infrastructure Engineer
7 9 (4.23%) Lead
8 8 (3.76%) 2nd Line Support
8 8 (3.76%) Senior Electrical Engineer
8 8 (3.76%) SQL DBA
9 7 (3.29%) Applications Support
9 7 (3.29%) Consultant
10 6 (2.82%) Architect
10 6 (2.82%) Data Engineer
10 6 (2.82%) Operations Manager
10 6 (2.82%) Support Analyst
11 5 (2.35%) IT Analyst
Libraries, Frameworks & Software Standards
1 8 (3.76%) Elastic Stack
2 6 (2.82%) .NET
3 5 (2.35%) REST
4 4 (1.88%) SOAP
4 4 (1.88%) YAML
5 3 (1.41%) CSS
5 3 (1.41%) HTML
5 3 (1.41%) PySpark
6 2 (0.94%) .NET Core
6 2 (0.94%) Playwright
6 2 (0.94%) React
6 2 (0.94%) Swagger
7 1 (0.47%) .NET Framework
7 1 (0.47%) ASP.NET
7 1 (0.47%) Node.js
7 1 (0.47%) Pandas
7 1 (0.47%) SAP Basis
Miscellaneous
1 12 (5.63%) Robotics
2 11 (5.16%) Analytical Mindset
3 10 (4.69%) Cyberattack
3 10 (4.69%) Data Structures
4 8 (3.76%) Driving Licence
4 8 (3.76%) Self-Motivation
4 8 (3.76%) Social Media
5 7 (3.29%) Management Information System
6 6 (2.82%) EPoS
7 5 (2.35%) Replication
8 4 (1.88%) Onboarding
9 3 (1.41%) Algorithms
9 3 (1.41%) Renewable Energy
10 2 (0.94%) Marketing Technology
10 2 (0.94%) Product Ownership
10 2 (0.94%) Smart Energy
11 1 (0.47%) Data Centre
11 1 (0.47%) Insider Threat
11 1 (0.47%) Security Posture
11 1 (0.47%) Team-Oriented Environment
Operating Systems
1 30 (14.08%) Windows
2 13 (6.10%) Linux
3 10 (4.69%) Android
4 6 (2.82%) Windows 10
5 3 (1.41%) Windows 7
6 1 (0.47%) VMS
6 1 (0.47%) Windows Server
Processes & Methodologies
1 120 (56.34%) Problem-Solving
2 43 (20.19%) Analytics
3 36 (16.90%) Artificial Intelligence
4 34 (15.96%) Decision-Making
5 26 (12.21%) Chemistry
5 26 (12.21%) Visualisation
6 23 (10.80%) Customer Service
6 23 (10.80%) Mathematics
6 23 (10.80%) Mentoring
7 21 (9.86%) Data Analysis
8 20 (9.39%) Agile
9 19 (8.92%) Machine Learning
10 17 (7.98%) Asset Management
10 17 (7.98%) Business Intelligence
10 17 (7.98%) Project Management
11 16 (7.51%) Data Privacy
11 16 (7.51%) ERP
11 16 (7.51%) ETL
11 16 (7.51%) IT Asset Management
11 16 (7.51%) Software Asset Management
Programming Languages
1 51 (23.94%) SQL
2 29 (13.62%) Python
3 11 (5.16%) T-SQL
4 8 (3.76%) Bash
4 8 (3.76%) C#
4 8 (3.76%) PowerShell
5 6 (2.82%) JavaScript
6 3 (1.41%) C++
6 3 (1.41%) TypeScript
7 2 (0.94%) Go
7 2 (0.94%) Java
7 2 (0.94%) Shell Script
8 1 (0.47%) C
8 1 (0.47%) Ladder Logic
8 1 (0.47%) Rust
8 1 (0.47%) SAPscript
8 1 (0.47%) VB.NET
Qualifications
1 70 (32.86%) Degree
2 31 (14.55%) Master's Degree
3 16 (7.51%) PhD
4 13 (6.10%) BPSS Clearance
5 12 (5.63%) DBS Check
6 4 (1.88%) ACCA
6 4 (1.88%) CIMA
6 4 (1.88%) Security Cleared
7 2 (0.94%) DV Cleared
7 2 (0.94%) ISTQB
7 2 (0.94%) ITIL Certification
7 2 (0.94%) SC Cleared
7 2 (0.94%) Six Sigma Green Belt
8 1 (0.47%) Chartered Engineer
8 1 (0.47%) CIPD
8 1 (0.47%) Computer Science Degree
8 1 (0.47%) MCITP
8 1 (0.47%) Microsoft Certification
8 1 (0.47%) NVQ Level 4
8 1 (0.47%) SAP Certification
Quality Assurance & Compliance
1 12 (5.63%) Data Quality
2 7 (3.29%) QA
3 4 (1.88%) GAAP
3 4 (1.88%) IFRS
4 3 (1.41%) GDPR
4 3 (1.41%) PCI DSS
5 1 (0.47%) Cyber Essentials
5 1 (0.47%) Cyber Essentials PLUS
5 1 (0.47%) GRC
5 1 (0.47%) ISO 14001
5 1 (0.47%) ISO 9000
5 1 (0.47%) ISO/IEC 27001
5 1 (0.47%) NIST
5 1 (0.47%) PMO
5 1 (0.47%) SLA
System Software
1 11 (5.16%) Active Directory
2 10 (4.69%) Docker
3 8 (3.76%) Hyper-V
3 8 (3.76%) VMware NSX
3 8 (3.76%) vSphere
Systems Management
1 13 (6.10%) Terraform
2 10 (4.69%) Ansible
3 1 (0.47%) Kubernetes
3 1 (0.47%) Single Sign-On
Vendors
1 40 (18.78%) Microsoft
2 25 (11.74%) Databricks
3 23 (10.80%) Google
4 17 (7.98%) Adobe
5 14 (6.57%) PayPal
6 13 (6.10%) SAP
7 10 (4.69%) Facebook
8 8 (3.76%) 3PAR
8 8 (3.76%) Cisco
8 8 (3.76%) Juniper
8 8 (3.76%) Salesforce
8 8 (3.76%) Splunk
9 7 (3.29%) Infor
10 6 (2.82%) Sage
11 5 (2.35%) Oracle
12 4 (1.88%) Cognos
13 3 (1.41%) dotdigital
13 3 (1.41%) Zoho
14 2 (0.94%) Ahrefs
14 2 (0.94%) YouTube