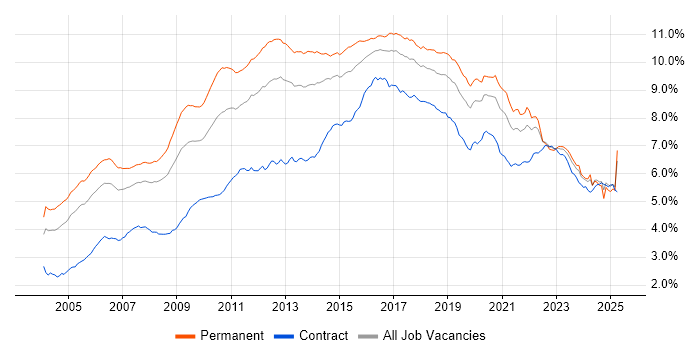
Linux Jobs in England

Linux
UK > England

The table below provides summary statistics for permanent job vacancies advertised in England requiring Linux skills. It includes a benchmarking guide to the annual salaries offered in vacancies that cited Linux over the 6 months leading up to 2 July 2025, comparing them to the same period in the previous two years.

6 months to
2 Jul 2025
Same period 2024 Same period 2023
Rank 42 30 32
Rank change year-on-year -12 +2 +1
Permanent jobs citing Linux 2,850 5,354 5,608
As % of all permanent jobs advertised in England 5.57% 5.69% 7.09%
As % of the Operating Systems category 41.66% 41.93% 42.68%
Number of salaries quoted 1,215 3,532 3,630
10th Percentile £31,750 £35,000 £35,400
25th Percentile £41,250 £42,500 £46,250
Median annual salary (50th Percentile) £60,000 £55,000 £62,500
Median % change year-on-year +9.09% -12.00% +4.17%
75th Percentile £80,000 £75,000 £82,500
90th Percentile £100,000 £90,000 £105,000
UK median annual salary £60,000 £55,000 £62,500
% change year-on-year +9.09% -12.00% +4.17%

All Operating Systems
England

Linux falls under the Operating Systems category. For comparison with the information above, the following table provides summary statistics for all permanent job vacancies requiring operating system skills in England.

Permanent vacancies with a requirement for operating system skills 6,841 12,770 13,139
As % of all permanent jobs advertised in England 13.38% 13.56% 16.61%
Number of salaries quoted 4,215 9,752 9,240
10th Percentile £27,000 £26,000 £27,000
25th Percentile £31,750 £31,250 £35,000
Median annual salary (50th Percentile) £42,500 £45,000 £52,500
Median % change year-on-year -5.56% -14.29% -
75th Percentile £63,750 £62,500 £71,250
90th Percentile £80,000 £80,000 £91,250
UK median annual salary £43,000 £45,500 £52,500
% change year-on-year -5.49% -13.33% -

Linux
Job Vacancy Trend in England

Job postings citing Linux as a proportion of all IT jobs advertised in England.

Job vacancy trend for Linux in England

Linux
Salary Trend in England

3-month moving average salary quoted in jobs citing Linux in England.

Salary trend for Linux in England

Linux
Salary Histogram in England

Salary distribution for jobs citing Linux in England over the 6 months to 2 July 2025.

Salary histogram for Linux in England

Linux
Job Locations in England

The table below looks at the demand and provides a guide to the median salaries quoted in IT jobs citing Linux within the England region over the 6 months to 2 July 2025. The 'Rank Change' column provides an indication of the change in demand within each location based on the same 6 month period last year.

Location Rank Change
on Same Period
Last Year
Matching
Permanent
IT Job Ads
Median Salary
Past 6 Months
Median Salary
% Change
on Same Period
Last Year
Live
Jobs
North of England +21 1,092 £52,500 +5.00% 669
North West +21 959 £53,750 +2.38% 413
London -6 708 £80,000 +3.23% 2,981
South East -40 374 £52,500 -4.55% 861
Midlands -42 225 £57,500 +15.00% 342
South West -20 202 £46,500 -11.43% 434
East of England -51 149 £55,320 +0.58% 455
West Midlands -6 140 £60,000 +11.11% 214
Yorkshire -21 113 £42,500 -5.56% 218
East Midlands -53 82 £43,750 -12.50% 128
North East +9 20 £65,000 +23.81% 40
Linux
UK

Linux
Co-occurring Skills and Capabilities in England by Category

The follow tables expand on the table above by listing co-occurrences grouped by category. The same employment type, locality and period is covered with up to 20 co-occurrences shown in each of the following categories:

Application Platforms
1 122 (4.28%) Confluence
2 93 (3.26%) Microsoft Exchange
3 46 (1.61%) Apache
4 38 (1.33%) IIS
5 35 (1.23%) SharePoint
6 25 (0.88%) nginx
7 15 (0.53%) Tomcat
8 10 (0.35%) OpenEdge
8 10 (0.35%) OpenStack
9 7 (0.25%) Apache Solr
9 7 (0.25%) CMS
10 6 (0.21%) GemFire
11 5 (0.18%) SAS
11 5 (0.18%) WordPress
12 4 (0.14%) Apache Spark
12 4 (0.14%) WebSphere
13 3 (0.11%) Apache Airflow
13 3 (0.11%) JBoss
13 3 (0.11%) Oracle SOA Suite
14 2 (0.070%) Drupal
Applications
1 64 (2.25%) Microsoft Office
2 35 (1.23%) Microsoft Excel
3 15 (0.53%) Chatbot
4 11 (0.39%) Mozilla Thunderbird
5 5 (0.18%) Photoshop
6 4 (0.14%) Simulink
7 2 (0.070%) EngageOne
7 2 (0.070%) Microsoft Project
7 2 (0.070%) OrCAD
8 1 (0.035%) GNU Octave
8 1 (0.035%) Microsoft PowerPoint
8 1 (0.035%) MS Visio
8 1 (0.035%) OmniGraffle
8 1 (0.035%) PlantUML
8 1 (0.035%) Trello
8 1 (0.035%) Weka
Business Applications
1 9 (0.32%) Fidessa
2 5 (0.18%) Oracle EBS
3 4 (0.14%) Dynamics NAV
3 4 (0.14%) Oracle Applications
4 3 (0.11%) Sage 50
5 2 (0.070%) MFGPRO
5 2 (0.070%) Payment Gateway
5 2 (0.070%) Refinitiv Enterprise Platform
5 2 (0.070%) Remedy ITSM
Cloud Services
1 895 (31.40%) AWS
2 684 (24.00%) Azure
3 275 (9.65%) GCP
4 231 (8.11%) Pulumi
5 170 (5.96%) Microsoft 365
6 92 (3.23%) Amazon EC2
7 82 (2.88%) Amazon S3
7 82 (2.88%) AWS CloudFormation
8 73 (2.56%) Amazon EKS
9 69 (2.42%) GitHub
10 65 (2.28%) Entra ID
11 64 (2.25%) SaaS
12 57 (2.00%) Amazon CloudWatch
13 53 (1.86%) Virtual Private Cloud
14 50 (1.75%) AWS KMS
15 39 (1.37%) Serverless
16 38 (1.33%) Amazon ECS
16 38 (1.33%) PaaS
17 37 (1.30%) Cloud Computing
18 36 (1.26%) Amazon ELB
Communications & Networking
1 824 (28.91%) VPN
2 559 (19.61%) DNS
3 286 (10.04%) Cisco IOS
4 248 (8.70%) Firewall
5 215 (7.54%) Broadband
6 176 (6.18%) TCP/IP
7 119 (4.18%) DHCP
8 75 (2.63%) WAN
9 73 (2.56%) VLAN
10 60 (2.11%) SAN
11 55 (1.93%) LAN
12 54 (1.89%) Wireless
13 37 (1.30%) Network Security
13 37 (1.30%) VoIP
14 32 (1.12%) Wi-Fi
15 29 (1.02%) HTTP
16 26 (0.91%) Multicast
16 26 (0.91%) SD-WAN
16 26 (0.91%) Software-Defined Radio
16 26 (0.91%) SSH
Database & Business Intelligence
1 299 (10.49%) Relational Database
2 278 (9.75%) NoSQL
3 224 (7.86%) RDBMS
4 131 (4.60%) SQL Server
5 118 (4.14%) PostgreSQL
6 114 (4.00%) MySQL
7 95 (3.33%) Amazon RDS
8 89 (3.12%) Elasticsearch
9 57 (2.00%) MongoDB
10 29 (1.02%) Redis
11 18 (0.63%) Amazon Aurora
12 17 (0.60%) DB2
13 14 (0.49%) DynamoDB
14 13 (0.46%) Oracle Database
15 9 (0.32%) Oracle Reports
16 8 (0.28%) Azure SQL Database
16 8 (0.28%) Big Data
17 5 (0.18%) Metadata
17 5 (0.18%) Oracle Exadata
17 5 (0.18%) Power BI
Development Applications
1 264 (9.26%) Git
2 216 (7.58%) Jaeger
3 188 (6.60%) JIRA
4 163 (5.72%) Jenkins
5 78 (2.74%) Cucumber
6 64 (2.25%) Robot Framework
7 62 (2.18%) GitLab
8 55 (1.93%) Maven
9 54 (1.89%) Bitbucket
9 54 (1.89%) JUnit
10 42 (1.47%) Sonatype Nexus
11 40 (1.40%) SonarQube
12 36 (1.26%) Mockito
13 35 (1.23%) Vagrant
14 27 (0.95%) Eclipse
15 23 (0.81%) TeamCity
16 19 (0.67%) IntelliJ
17 18 (0.63%) Artifactory
17 18 (0.63%) Bitbucket Server
18 17 (0.60%) Visual Studio
General
1 1,248 (43.79%) Inclusion and Diversity
2 842 (29.54%) Analytical Skills
3 757 (26.56%) Finance
4 520 (18.25%) Social Skills
5 141 (4.95%) Banking
6 116 (4.07%) Telecoms
7 70 (2.46%) Law
8 67 (2.35%) Public Sector
9 51 (1.79%) Manufacturing
10 50 (1.75%) Presentation Skills
11 48 (1.68%) Front Office
12 42 (1.47%) Retail
13 41 (1.44%) Electronics
14 35 (1.23%) Investment Banking
15 29 (1.02%) Organisational Skills
16 27 (0.95%) Automotive
17 26 (0.91%) Games
18 23 (0.81%) Aerospace
19 20 (0.70%) Marketing
20 19 (0.67%) Military
Job Titles
1 682 (23.93%) Developer
2 492 (17.26%) Senior
3 470 (16.49%) Software Developer
4 396 (13.89%) Infrastructure Engineer
5 362 (12.70%) Software Engineer
6 341 (11.96%) Lead
7 243 (8.53%) Senior Software Engineer
8 231 (8.11%) Team Leader
9 143 (5.02%) Support Engineer
10 124 (4.35%) Analyst
11 118 (4.14%) Administrator
12 100 (3.51%) Linux Engineer
13 99 (3.47%) Cloud Engineer
13 99 (3.47%) DevOps Engineer
14 91 (3.19%) IT Support
15 87 (3.05%) Support Analyst
16 79 (2.77%) Test Engineer
17 78 (2.74%) Systems Administrator
18 77 (2.70%) IT Engineer
19 69 (2.42%) Systems Engineer
Libraries, Frameworks & Software Standards
1 513 (18.00%) Elastic Stack
2 295 (10.35%) .NET
3 258 (9.05%) Node.js
4 215 (7.54%) OpenTelemetry
5 70 (2.46%) React
6 60 (2.11%) HTML
7 59 (2.07%) Pandas
8 55 (1.93%) Middleware
9 54 (1.89%) REST
10 50 (1.75%) CSS
11 49 (1.72%) Spring
12 46 (1.61%) FIX Protocol
13 44 (1.54%) AngularJS
14 39 (1.37%) Spring Boot
15 38 (1.33%) Hibernate
16 33 (1.16%) RESTful
17 29 (1.02%) RabbitMQ
18 28 (0.98%) Kafka
19 27 (0.95%) Bootstrap
19 27 (0.95%) JPA
Miscellaneous
1 889 (31.19%) Cyberattack
2 300 (10.53%) Linux Command Line
3 234 (8.21%) Self-Motivation
4 90 (3.16%) Algorithms
4 90 (3.16%) Management Information System
5 88 (3.09%) Data Centre
6 75 (2.63%) Cloud Native
7 68 (2.39%) Distributed Systems
8 64 (2.25%) Equities
8 64 (2.25%) Hybrid Cloud
9 60 (2.11%) Embedded Systems
10 58 (2.04%) e-Learning
11 56 (1.96%) Hedge funds
12 53 (1.86%) Public Cloud
13 45 (1.58%) Clustering
14 43 (1.51%) Data Structures
15 41 (1.44%) Driving Licence
16 40 (1.40%) Replication
17 35 (1.23%) Legacy Code
18 30 (1.05%) Derivative
Operating Systems
1 1,035 (36.32%) Windows
2 749 (26.28%) Android
3 402 (14.11%) Unix
4 248 (8.70%) Windows Server
5 160 (5.61%) Red Hat Enterprise Linux
6 69 (2.42%) CentOS
7 64 (2.25%) Ubuntu
8 59 (2.07%) Mac OS
9 58 (2.04%) Windows Server 2016
10 53 (1.86%) Windows 10
11 52 (1.82%) Embedded Linux
12 41 (1.44%) VMS
13 39 (1.37%) Windows Server 2019
14 33 (1.16%) Apple iOS
15 27 (0.95%) Mac OS X
16 26 (0.91%) Rocky
17 23 (0.81%) Debian
18 21 (0.74%) Solaris
19 19 (0.67%) Amazon Linux
20 12 (0.42%) AIX
Processes & Methodologies
1 1,148 (40.28%) Agile
2 910 (31.93%) DevOps
3 794 (27.86%) Mathematics
4 711 (24.95%) Line Management
5 636 (22.32%) Problem-Solving
6 614 (21.54%) Mentoring
7 519 (18.21%) OO
7 519 (18.21%) Task Automation
8 494 (17.33%) Software Engineering
9 487 (17.09%) OOP
10 460 (16.14%) Design Patterns
11 457 (16.04%) Android Development
12 422 (14.81%) Infrastructure Engineering
13 416 (14.60%) Containerisation
14 396 (13.89%) Infrastructure as Code
15 351 (12.32%) CI/CD
16 347 (12.18%) Platform Engineering
17 321 (11.26%) Continuous Integration
18 314 (11.02%) High Availability
19 291 (10.21%) Risk Management
Programming Languages
1 1,734 (60.84%) Python
2 1,077 (37.79%) Java
3 919 (32.25%) Go
4 884 (31.02%) C++
5 779 (27.33%) Bash
6 664 (23.30%) JavaScript
7 616 (21.61%) PowerShell
8 336 (11.79%) SQL
9 297 (10.42%) Rust
10 179 (6.28%) C
11 82 (2.88%) C#
12 81 (2.84%) Shell Script
13 60 (2.11%) Perl
14 52 (1.82%) PHP
15 41 (1.44%) Groovy
16 39 (1.37%) TypeScript
17 29 (1.02%) PL/SQL
18 24 (0.84%) R
19 19 (0.67%) Kotlin
20 17 (0.60%) MATLAB
Qualifications
1 929 (32.60%) Security Cleared
2 733 (25.72%) DV Cleared
3 441 (15.47%) AWS Certification
4 389 (13.65%) Degree
5 196 (6.88%) SC Cleared
6 183 (6.42%) AWS Certified Solutions Architect
7 179 (6.28%) AWS Certified Developer
8 93 (3.26%) Microsoft Certification
9 89 (3.12%) Cisco Certification
10 88 (3.09%) Computer Science Degree
11 61 (2.14%) CCNP
12 52 (1.82%) BPSS Clearance
13 49 (1.72%) CCNA
14 41 (1.44%) MCSE
15 38 (1.33%) Network+ Certification
16 37 (1.30%) Azure Certification
17 36 (1.26%) MCSA
18 33 (1.16%) PhD
19 28 (0.98%) RHCSA
20 25 (0.88%) HND
Quality Assurance & Compliance
1 124 (4.35%) QA
2 58 (2.04%) SLA
3 31 (1.09%) ISO/IEC 27001
4 30 (1.05%) GDPR
5 16 (0.56%) Cyber Essentials
6 12 (0.42%) Sarbanes-Oxley
7 11 (0.39%) NIST
8 9 (0.32%) ISO 9001
9 8 (0.28%) Accessibility
9 8 (0.28%) Data Quality
9 8 (0.28%) PCI DSS
10 7 (0.25%) HIPAA
10 7 (0.25%) MIL-STD-1553
11 6 (0.21%) PMO
11 6 (0.21%) SOC 2
12 5 (0.18%) Def Stans
12 5 (0.18%) ITGC
13 4 (0.14%) Cyber Essentials PLUS
14 3 (0.11%) JTAG
15 2 (0.070%) ISO 9000
System Software
1 1,183 (41.51%) Docker
2 351 (12.32%) Hyper-V
3 313 (10.98%) vSphere
4 271 (9.51%) VMware NSX
5 269 (9.44%) Active Directory
6 203 (7.12%) VMware Infrastructure
7 63 (2.21%) VMware ESXi
8 46 (1.61%) Firmware
8 46 (1.61%) Virtual Machines
9 29 (1.02%) Embedded Firmware
10 24 (0.84%) DFS Replication
11 22 (0.77%) NFS
12 17 (0.60%) Virtual Desktop
13 13 (0.46%) Postfix
14 9 (0.32%) Veritas Cluster Server
15 8 (0.28%) Dovecot
15 8 (0.28%) KVM
16 7 (0.25%) BitLocker
17 6 (0.21%) Citrix Hypervisor
17 6 (0.21%) Microsoft App-V
Systems Management
1 1,234 (43.30%) Ansible
2 792 (27.79%) Terraform
3 527 (18.49%) Kubernetes
4 301 (10.56%) Prometheus
5 221 (7.75%) Argo
6 216 (7.58%) Kustomize
7 106 (3.72%) Grafana
8 93 (3.26%) Microsoft Intune
9 56 (1.96%) Puppet
10 32 (1.12%) SCCM
11 29 (1.02%) Nagios
12 25 (0.88%) Progress Chef
13 18 (0.63%) FortiGate
14 17 (0.60%) Nessus
14 17 (0.60%) Proxmox
14 17 (0.60%) Single Sign-On
14 17 (0.60%) vCenter Server
15 16 (0.56%) Kibana
16 15 (0.53%) Active Directory Federation Services
16 15 (0.53%) Red Hat Satellite
Vendors
1 425 (14.91%) Cisco
2 397 (13.93%) Microsoft
3 300 (10.53%) Splunk
4 298 (10.46%) Juniper
5 291 (10.21%) VMware
6 272 (9.54%) Google
7 262 (9.19%) 3PAR
8 174 (6.11%) Red Hat
9 137 (4.81%) Oracle
10 75 (2.63%) Atlassian
11 51 (1.79%) IBM
12 49 (1.72%) ServiceNow
13 46 (1.61%) Dell
14 40 (1.40%) Apple
15 36 (1.26%) Veeam
16 33 (1.16%) SAP
17 32 (1.12%) Citrix
18 26 (0.91%) HP
19 24 (0.84%) Commvault
19 24 (0.84%) Fortinet