AWS Jobs in Manchester

Amazon Web Services (AWS)
North West > Manchester

The table below provides summary statistics for permanent job vacancies advertised in Manchester requiring AWS skills. It includes a benchmarking guide to the annual salaries offered in vacancies that cited AWS over the 6 months leading up to 10 May 2025, comparing them to the same period in the previous two years.

6 months to
10 May 2025
Same period 2024 Same period 2023
Rank 5 9 5
Rank change year-on-year +4 -4 -2
Permanent jobs citing AWS 452 675 1,179
As % of all permanent jobs advertised in Manchester 20.04% 13.03% 24.11%
As % of the Cloud Services category 45.98% 33.35% 50.08%
Number of salaries quoted 274 490 601
10th Percentile £46,544 £42,500 £42,500
25th Percentile £52,500 £51,250 £51,250
Median annual salary (50th Percentile) £67,037 £63,141 £65,000
Median % change year-on-year +6.17% -2.86% -
75th Percentile £82,500 £76,250 £78,750
90th Percentile £112,500 £85,250 £86,250
North West median annual salary £67,037 £62,783 £65,000
% change year-on-year +6.78% -3.41% +4.00%

All Cloud Skills
Manchester

AWS falls under the Cloud Services category. For comparison with the information above, the following table provides summary statistics for all permanent job vacancies requiring cloud computing skills in Manchester.

Permanent vacancies with a requirement for cloud computing skills 983 2,024 2,354
As % of all permanent jobs advertised in Manchester 43.59% 39.07% 48.14%
Number of salaries quoted 656 1,609 1,385
10th Percentile £32,000 £32,500 £36,250
25th Percentile £45,000 £42,500 £46,250
Median annual salary (50th Percentile) £62,500 £57,500 £57,500
Median % change year-on-year +8.70% - -
75th Percentile £77,500 £72,500 £73,750
90th Percentile £97,514 £85,000 £85,000
North West median annual salary £57,500 £55,000 £55,000
% change year-on-year +4.55% - -

AWS
Job Vacancy Trend in Manchester

Job postings citing AWS as a proportion of all IT jobs advertised in Manchester.
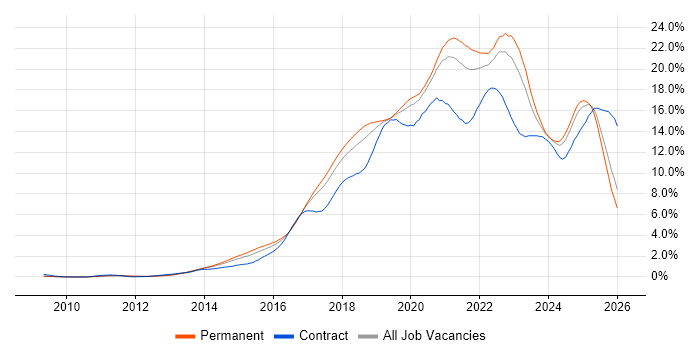
Job vacancy trend for AWS in Manchester

AWS
Salary Trend in Manchester

3-month moving average salary quoted in jobs citing AWS in Manchester.

Salary trend for AWS in Manchester

AWS
Salary Histogram in Manchester

Salary distribution for jobs citing AWS in Manchester over the 6 months to 10 May 2025.

Salary histogram for AWS in Manchester

AWS
Job Locations in Manchester

The table below looks at the demand and provides a guide to the median salaries quoted in IT jobs citing AWS within the Manchester region over the 6 months to 10 May 2025. The 'Rank Change' column provides an indication of the change in demand within each location based on the same 6 month period last year.

Location Rank Change
on Same Period
Last Year
Matching
Permanent
IT Job Ads
Median Salary
Past 6 Months
Median Salary
% Change
on Same Period
Last Year
Live
Jobs
Altrincham +7 16 £53,750 -2.27% 35
Stockport -2 15 £75,000 +25.00% 13
Cheadle +12 11 - - 3
Oldham - 11 £31,500 -
Salford +3 9 £67,626 -9.83% 18
Sale - 8 £50,000 -
Ashton-under-Lyne - 7 - - 26
Heywood - 6 - -
Rochdale +8 5 £57,500 - 2
Bury +3 5 - - 32
Dukinfield - 5 - -
Stalybridge - 5 - -
Wigan - 3 £31,500 - 1
Bolton -27 2 - - 34
AWS
North West

AWS
Co-occurring Skills and Capabilities in Manchester by Category

The follow tables expand on the table above by listing co-occurrences grouped by category. The same employment type, locality and period is covered with up to 20 co-occurrences shown in each of the following categories:

Application Platforms
1 16 (3.54%) Confluence
2 9 (1.99%) Apache Spark
3 6 (1.33%) IIS
3 6 (1.33%) Microsoft Exchange
4 5 (1.11%) Apache
4 5 (1.11%) CMS
5 4 (0.88%) SharePoint
6 3 (0.66%) nginx
7 2 (0.44%) Apache Airflow
7 2 (0.44%) Headless CMS
7 2 (0.44%) WordPress
8 1 (0.22%) Strapi
Applications
1 1 (0.22%) Chatbot
1 1 (0.22%) Microsoft Office
Cloud Services
1 222 (49.12%) Azure
2 170 (37.61%) GCP
3 43 (9.51%) Serverless
4 28 (6.19%) AWS Lambda
5 25 (5.53%) AWS CloudFormation
5 25 (5.53%) SaaS
6 21 (4.65%) Cloud Computing
7 18 (3.98%) Microsoft 365
8 15 (3.32%) Amazon EKS
8 15 (3.32%) GitHub
8 15 (3.32%) Power Platform
9 13 (2.88%) Azure Machine Learning
10 12 (2.65%) Amazon SQS
11 11 (2.43%) Cloud Composer
12 10 (2.21%) Amazon S3
12 10 (2.21%) GitHub Actions
13 9 (1.99%) Snowflake
14 8 (1.77%) Amazon EC2
14 8 (1.77%) Amazon ECS
14 8 (1.77%) Entra ID
Communications & Networking
1 17 (3.76%) DNS
2 9 (1.99%) Firewall
2 9 (1.99%) WAN
3 7 (1.55%) VPN
4 6 (1.33%) TCP/IP
5 5 (1.11%) HTTP
5 5 (1.11%) Internet
6 4 (0.88%) Cisco IOS
6 4 (0.88%) LoRaWAN
6 4 (0.88%) SD-WAN
6 4 (0.88%) SSH
7 3 (0.66%) DHCP
8 2 (0.44%) LAN
8 2 (0.44%) Reverse Proxy
8 2 (0.44%) Wireless
9 1 (0.22%) Ethernet
9 1 (0.22%) Network Security
9 1 (0.22%) OSPF
9 1 (0.22%) Unified Communications
Database & Business Intelligence
1 45 (9.96%) SQL Server
2 44 (9.73%) MySQL
3 35 (7.74%) MongoDB
4 33 (7.30%) NoSQL
5 19 (4.20%) PostgreSQL
6 15 (3.32%) Power BI
7 13 (2.88%) Tableau
8 12 (2.65%) BigQuery
9 11 (2.43%) Amazon RDS
9 11 (2.43%) Cloud Spanner
9 11 (2.43%) DynamoDB
9 11 (2.43%) Elasticsearch
9 11 (2.43%) Relational Database
10 8 (1.77%) Data Lake
11 6 (1.33%) Amazon Aurora
11 6 (1.33%) Data Warehouse
11 6 (1.33%) Redis
12 5 (1.11%) Big Data
12 5 (1.11%) RDBMS
13 4 (0.88%) Amazon Athena
Development Applications
1 34 (7.52%) GitLab
1 34 (7.52%) JIRA
2 32 (7.08%) Git
3 22 (4.87%) Selenium
4 19 (4.20%) Bitbucket
5 18 (3.98%) Cucumber
5 18 (3.98%) Jenkins
5 18 (3.98%) Maven
5 18 (3.98%) SonarQube
5 18 (3.98%) Sonatype Nexus
6 7 (1.55%) JMeter
7 5 (1.11%) Jasmine
7 5 (1.11%) Karma Test Runner
8 4 (0.88%) Appium
8 4 (0.88%) Fiddler
8 4 (0.88%) LoadRunner
8 4 (0.88%) Postman
9 2 (0.44%) CircleCI
9 2 (0.44%) Storybook
10 1 (0.22%) IBM UrbanCode
General
1 103 (22.79%) Inclusion and Diversity
2 99 (21.90%) Finance
3 83 (18.36%) Social Skills
4 50 (11.06%) Banking
5 40 (8.85%) Analytical Skills
6 32 (7.08%) Retail
7 20 (4.42%) Games
8 17 (3.76%) Manufacturing
9 11 (2.43%) Influencing Skills
10 9 (1.99%) Corporate Banking
10 9 (1.99%) Investment Banking
11 8 (1.77%) Public Sector
12 6 (1.33%) Cantonese Language
12 6 (1.33%) Financial Institution
12 6 (1.33%) Law
12 6 (1.33%) Mandarin Language
12 6 (1.33%) Marketing
13 5 (1.11%) Automotive
13 5 (1.11%) Digital Healthcare
13 5 (1.11%) Pharmaceutical
Job Titles
1 177 (39.16%) Software Engineer
2 168 (37.17%) Senior
3 115 (25.44%) Senior Software Engineer
4 97 (21.46%) Lead
5 62 (13.72%) Developer
6 30 (6.64%) AWS Engineer
7 23 (5.09%) Senior Developer
8 22 (4.87%) .NET Developer
9 21 (4.65%) Data Engineer
10 19 (4.20%) Cloud Engineer
10 19 (4.20%) Lead Software Engineer
11 17 (3.76%) DevOps Engineer
11 17 (3.76%) Lead Developer
12 16 (3.54%) Architect
13 15 (3.32%) Technical Leader
14 14 (3.10%) Analyst
15 13 (2.88%) Front-End Developer (Client-Side Developer)
15 13 (2.88%) Principal Engineer
16 11 (2.43%) AWS Software Engineer
17 10 (2.21%) Solutions Architect
Libraries, Frameworks & Software Standards
1 144 (31.86%) .NET
2 142 (31.42%) Node.js
3 107 (23.67%) React
4 54 (11.95%) CSS
4 54 (11.95%) HTML
5 44 (9.73%) Kafka
6 41 (9.07%) RESTful
7 37 (8.19%) Spring Boot
8 32 (7.08%) AngularJS
9 30 (6.64%) Redux
10 28 (6.19%) .NET Core
10 28 (6.19%) Spring
11 25 (5.53%) REST
12 18 (3.98%) JPA
12 18 (3.98%) Sass
12 18 (3.98%) Vue
13 16 (3.54%) Web Services
14 15 (3.32%) HTML5
15 14 (3.10%) GraphQL
15 14 (3.10%) Jest
Miscellaneous
1 84 (18.58%) Cyberattack
2 83 (18.36%) Self-Motivation
3 82 (18.14%) Linux Command Line
4 42 (9.29%) Product Ownership
5 34 (7.52%) Cloud Native
6 26 (5.75%) Enterprise Software
7 15 (3.32%) Public Cloud
8 13 (2.88%) Distributed Systems
8 13 (2.88%) Greenfield Project
9 12 (2.65%) Algorithms
10 9 (1.99%) Data Centre
10 9 (1.99%) IoT
10 9 (1.99%) Mobile App
11 8 (1.77%) Legacy Systems
11 8 (1.77%) Renewable Energy
12 7 (1.55%) Life Science
12 7 (1.55%) Sports Betting
13 6 (1.33%) Hybrid Cloud
13 6 (1.33%) Legacy Code
14 5 (1.11%) LIMS
Operating Systems
1 120 (26.55%) Linux
2 31 (6.86%) Windows
3 11 (2.43%) Windows Server
4 7 (1.55%) CentOS
5 5 (1.11%) Ubuntu
6 4 (0.88%) Android
6 4 (0.88%) Unix
7 2 (0.44%) Debian
7 2 (0.44%) Windows Server 2016
8 1 (0.22%) Mac OS
8 1 (0.22%) Windows 10
Processes & Methodologies
1 240 (53.10%) Software Engineering
2 226 (50.00%) Agile
3 176 (38.94%) Microservices
4 158 (34.96%) Mentoring
5 129 (28.54%) DevOps
6 124 (27.43%) CI/CD
7 119 (26.33%) User Experience
8 109 (24.12%) Machine Learning
9 105 (23.23%) Cloud Security
10 104 (23.01%) Scrum
11 101 (22.35%) Data Engineering
12 96 (21.24%) Site Reliability Engineering
13 79 (17.48%) Problem-Solving
14 64 (14.16%) Roadmaps
15 53 (11.73%) Full-Stack Development
16 50 (11.06%) Test Automation
17 49 (10.84%) Containerisation
18 40 (8.85%) Infrastructure as Code
18 40 (8.85%) TDD
18 40 (8.85%) Technical Leadership
Programming Languages
1 204 (45.13%) JavaScript
2 180 (39.82%) Python
3 178 (39.38%) Java
4 95 (21.02%) Go
4 95 (21.02%) TypeScript
5 87 (19.25%) SQL
6 84 (18.58%) C++
7 82 (18.14%) Rust
8 51 (11.28%) C#
9 26 (5.75%) PHP
10 15 (3.32%) PowerShell
11 10 (2.21%) Bash
12 5 (1.11%) Scala
13 3 (0.66%) R
14 2 (0.44%) Bicep
14 2 (0.44%) Ruby
15 1 (0.22%) PL/SQL
15 1 (0.22%) Shell Script
15 1 (0.22%) T-SQL
Qualifications
1 95 (21.02%) AWS Certification
2 90 (19.91%) Security Cleared
3 89 (19.69%) AWS Certified Solutions Architect
4 83 (18.36%) DV Cleared
5 82 (18.14%) AWS Certified Developer
6 37 (8.19%) Degree
7 22 (4.87%) Computer Science Degree
8 9 (1.99%) Azure Certification
9 7 (1.55%) SC Cleared
10 6 (1.33%) Master's Degree
11 4 (0.88%) ISTQB
12 3 (0.66%) Linux+ Certification
12 3 (0.66%) RHCE
13 2 (0.44%) PhD
14 1 (0.22%) DBS Check
14 1 (0.22%) HND
Quality Assurance & Compliance
1 37 (8.19%) QA
2 25 (5.53%) Data Quality
3 22 (4.87%) Accessibility
4 13 (2.88%) GDPR
5 7 (1.55%) HIPAA
5 7 (1.55%) PCI DSS
6 5 (1.11%) California Consumer Privacy Act
6 5 (1.11%) HL7
6 5 (1.11%) NIST
7 4 (0.88%) ISO/IEC 27001
7 4 (0.88%) SLA
8 1 (0.22%) Cyber Essentials
8 1 (0.22%) SEPA
System Software
1 101 (22.35%) Docker
2 18 (3.98%) Active Directory
3 13 (2.88%) VMware Infrastructure
4 7 (1.55%) Hyper-V
5 3 (0.66%) Dovecot
5 3 (0.66%) Postfix
5 3 (0.66%) Virtual Machines
6 2 (0.44%) VMware ESXi
6 2 (0.44%) VMware NSX
7 1 (0.22%) vSphere
Systems Management
1 88 (19.47%) Kubernetes
2 76 (16.81%) Terraform
3 20 (4.42%) Ansible
4 13 (2.88%) Grafana
5 7 (1.55%) Puppet
6 5 (1.11%) Single Sign-On
7 4 (0.88%) Kibana
7 4 (0.88%) Prometheus
8 3 (0.66%) AWS Copilot
9 2 (0.44%) Microsoft Intune
9 2 (0.44%) Salt
10 1 (0.22%) Argo
10 1 (0.22%) Automic
10 1 (0.22%) Consul
10 1 (0.22%) Jamf Pro
10 1 (0.22%) Karpenter
10 1 (0.22%) Rancher
10 1 (0.22%) SCCM
Vendors
1 39 (8.63%) Google
2 18 (3.98%) Solace
3 15 (3.32%) VMware
4 12 (2.65%) Informatica
4 12 (2.65%) Microsoft
5 11 (2.43%) Ping Identity
6 9 (1.99%) Oracle
7 7 (1.55%) Databricks
7 7 (1.55%) Okta
8 5 (1.11%) IBM
8 5 (1.11%) Veeam
9 4 (0.88%) Cisco
9 4 (0.88%) Hitachi
9 4 (0.88%) Perforce
9 4 (0.88%) ServiceNow
10 3 (0.66%) Atlassian
10 3 (0.66%) Red Hat
10 3 (0.66%) Splunk
10 3 (0.66%) Twitter
10 3 (0.66%) Zscaler