C# Jobs in the North West

C#
England > North West

The table below provides summary statistics for permanent job vacancies advertised in the North West requiring C# skills. It includes a benchmarking guide to the annual salaries offered in vacancies that cited C# over the 6 months leading up to 26 October 2024, comparing them to the same period in the previous two years.

6 months to
26 Oct 2024
Same period 2023 Same period 2022
Rank 38 25 15
Rank change year-on-year -13 -10 -2
Permanent jobs citing C# 377 385 1,186
As % of all permanent jobs advertised in the North West 4.57% 8.34% 13.10%
As % of the Programming Languages category 18.01% 21.06% 31.55%
Number of salaries quoted 280 296 665
10th Percentile £31,700 £40,000 £36,250
25th Percentile £42,500 £45,000 £45,000
Median annual salary (50th Percentile) £50,000 £57,500 £55,000
Median % change year-on-year -13.04% +4.55% +4.76%
75th Percentile £62,500 £68,750 £72,500
90th Percentile £73,997 £76,250 £82,500
England median annual salary £60,000 £65,000 £60,000
% change year-on-year -7.69% +8.33% +9.09%

All Programming Languages
North West

C# falls under the Programming Languages category. For comparison with the information above, the following table provides summary statistics for all permanent job vacancies requiring coding skills in the North West.

Permanent vacancies with a requirement for coding skills 2,093 1,828 3,759
As % of all permanent jobs advertised in the North West 25.38% 39.58% 41.52%
Number of salaries quoted 1,181 1,324 2,396
10th Percentile £35,802 £36,270 £35,000
25th Percentile £44,106 £43,800 £42,500
Median annual salary (50th Percentile) £55,000 £55,000 £55,000
Median % change year-on-year - - +10.00%
75th Percentile £65,000 £71,250 £71,250
90th Percentile £77,500 £82,548 £85,000
England median annual salary £65,000 £65,000 £65,000
% change year-on-year - - +8.33%

C#
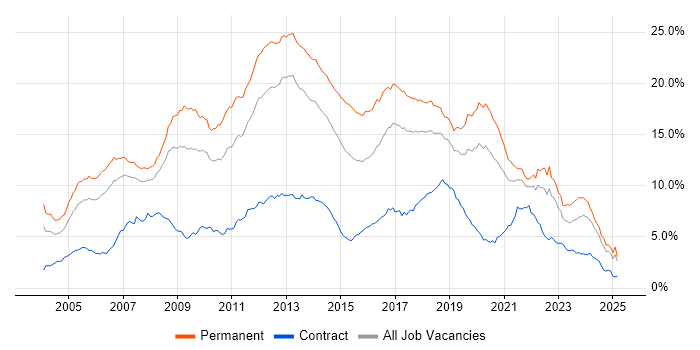
Job Vacancy Trend in the North West

Job postings citing C# as a proportion of all IT jobs advertised in the North West.

Job vacancy trend for C# in the North West

C#
Salary Trend in the North West

3-month moving average salary quoted in jobs citing C# in the North West.

Salary trend for C# in the North West

C#
Salary Histogram in the North West

Salary distribution for jobs citing C# in the North West over the 6 months to 26 October 2024.

Salary histogram for C# in the North West

C#
Job Locations in the North West

The table below looks at the demand and provides a guide to the median salaries quoted in IT jobs citing C# within the North West region over the 6 months to 26 October 2024. The 'Rank Change' column provides an indication of the change in demand within each location based on the same 6 month period last year.

Location Rank Change
on Same Period
Last Year
Matching
Permanent
IT Job Ads
Median Salary
Past 6 Months
Median Salary
% Change
on Same Period
Last Year
Live
Jobs
Manchester -10 198 £57,500 -4.17% 135
Cheshire +16 78 £50,000 -16.67% 31
Merseyside +16 60 £42,000 -11.58% 14
Lancashire -47 39 £50,055 +0.11% 19
Cumbria - 2 £45,000 - 6
C#
England

C#
Co-occurring Skills and Capabilities in the North West by Category

The follow tables expand on the table above by listing co-occurrences grouped by category. The same employment type, locality and period is covered with up to 20 co-occurrences shown in each of the following categories:

Application Platforms
1 24 (6.37%) Umbraco
2 19 (5.04%) CMS
3 5 (1.33%) SharePoint
4 3 (0.80%) Apache Solr
4 3 (0.80%) IIS
4 3 (0.80%) NServiceBus
5 1 (0.27%) Apache
5 1 (0.27%) Apache Spark
5 1 (0.27%) Confluence
5 1 (0.27%) Microsoft Exchange
Applications
1 3 (0.80%) Microsoft Office
1 3 (0.80%) MS Visio
2 1 (0.27%) Microsoft Excel
Business Applications
1 10 (2.65%) Dynamics CRM
2 1 (0.27%) NEC Housing
2 1 (0.27%) Visualfiles
Cloud Services
1 171 (45.36%) Azure
2 67 (17.77%) AWS
3 32 (8.49%) Azure DevOps
4 25 (6.63%) SaaS
5 21 (5.57%) Power Platform
6 15 (3.98%) Dynamics 365
7 13 (3.45%) GCP
8 7 (1.86%) Cloud Computing
9 6 (1.59%) GitHub
9 6 (1.59%) Power Automate
10 4 (1.06%) Azure Pipelines
10 4 (1.06%) Serverless
10 4 (1.06%) Zapier
11 3 (0.80%) Amazon ElastiCache
11 3 (0.80%) Azure Cosmos DB
11 3 (0.80%) Azure Logic Apps
11 3 (0.80%) Azure Service Bus
11 3 (0.80%) Microsoft 365
11 3 (0.80%) PaaS
11 3 (0.80%) PowerApps
Communications & Networking
1 19 (5.04%) Intranet
2 4 (1.06%) Internet
3 1 (0.27%) Firewall
3 1 (0.27%) VPN
Database & Business Intelligence
1 84 (22.28%) SQL Server
2 13 (3.45%) Azure SQL Database
2 13 (3.45%) MySQL
3 10 (2.65%) MongoDB
4 7 (1.86%) NoSQL
5 6 (1.59%) SQL Server Integration Services
6 5 (1.33%) Data Warehouse
6 5 (1.33%) SQL Server Reporting Services
7 4 (1.06%) Power BI
7 4 (1.06%) Tableau
8 3 (0.80%) Amazon RDS
8 3 (0.80%) Elasticsearch
8 3 (0.80%) Relational Database
9 2 (0.53%) Oracle Database
9 2 (0.53%) PostgreSQL
9 2 (0.53%) RDBMS
10 1 (0.27%) Amazon Athena
10 1 (0.27%) Big Data
10 1 (0.27%) DynamoDB
10 1 (0.27%) Hadoop
Development Applications
1 20 (5.31%) Git
2 12 (3.18%) JIRA
3 11 (2.92%) Selenium
4 10 (2.65%) Jenkins
5 8 (2.12%) Cypress.io
6 7 (1.86%) Cucumber
7 6 (1.59%) Team Foundation Server
7 6 (1.59%) Visual Studio
8 5 (1.33%) SpecFlow
9 4 (1.06%) TeamCity
10 3 (0.80%) JMeter
10 3 (0.80%) SonarQube
10 3 (0.80%) WebDriver
11 2 (0.53%) Jasmine
11 2 (0.53%) Karma Test Runner
11 2 (0.53%) Postman
12 1 (0.27%) Bitbucket
12 1 (0.27%) Moq
12 1 (0.27%) NUnit
12 1 (0.27%) Subversion
General
1 81 (21.49%) Social Skills
2 38 (10.08%) Finance
3 34 (9.02%) Analytical Skills
4 23 (6.10%) Retail
5 20 (5.31%) Public Sector
6 12 (3.18%) Back Office
7 10 (2.65%) Manufacturing
8 8 (2.12%) Advertising
8 8 (2.12%) Aerospace
8 8 (2.12%) Avionics
8 8 (2.12%) Legal
8 8 (2.12%) Tech for Good
9 7 (1.86%) Games
9 7 (1.86%) Law
10 5 (1.33%) Electronics
10 5 (1.33%) Marketing
11 3 (0.80%) Automotive
11 3 (0.80%) Inclusion and Diversity
11 3 (0.80%) Military
12 2 (0.53%) Banking
Job Titles
1 238 (63.13%) Developer
2 119 (31.56%) .NET Developer
3 70 (18.57%) Senior
4 67 (17.77%) Software Engineer
5 58 (15.38%) C# Developer
6 50 (13.26%) Software Developer
7 42 (11.14%) Senior Developer
8 34 (9.02%) Lead
9 31 (8.22%) C# .NET Developer
10 28 (7.43%) Senior .NET Developer
11 23 (6.10%) Senior Software Engineer
12 22 (5.84%) Lead Developer
13 20 (5.31%) Analyst
13 20 (5.31%) Umbraco Developer
14 18 (4.77%) C# Software Engineer
15 14 (3.71%) Lead Software Developer
16 12 (3.18%) .NET Software Developer
16 12 (3.18%) C# Software Developer
16 12 (3.18%) Full-Stack Developer
17 11 (2.92%) Software Manager
Libraries, Frameworks & Software Standards
1 284 (75.33%) .NET
2 80 (21.22%) .NET Framework
3 75 (19.89%) .NET Core
4 74 (19.63%) HTML
5 73 (19.36%) CSS
6 51 (13.53%) React
7 45 (11.94%) ASP.NET
8 35 (9.28%) HTML5
9 34 (9.02%) ASP.NET Web API
10 33 (8.75%) REST
11 31 (8.22%) AngularJS
12 28 (7.43%) Entity Framework
13 24 (6.37%) jQuery
14 18 (4.77%) Blazor
15 16 (4.24%) CSS3
15 16 (4.24%) Vue
15 16 (4.24%) WPF
16 13 (3.45%) WinForms
17 12 (3.18%) RabbitMQ
18 11 (2.92%) Web Services
Miscellaneous
1 24 (6.37%) Greenfield Project
2 21 (5.57%) NHS
3 11 (2.92%) Management Information System
4 8 (2.12%) Algorithms
4 8 (2.12%) IoT
4 8 (2.12%) Sports Betting
5 7 (1.86%) Mobile App
5 7 (1.86%) Social Network
6 6 (1.59%) Home Automation
6 6 (1.59%) Social Media
6 6 (1.59%) Virtual Team
7 5 (1.33%) Onboarding
7 5 (1.33%) Video\Live Streaming
8 4 (1.06%) Self-Motivation
9 3 (0.80%) Cloud Native
9 3 (0.80%) Legacy Applications
9 3 (0.80%) Operational Technology
9 3 (0.80%) Product Ownership
9 3 (0.80%) Renewable Energy
9 3 (0.80%) SCADA
Operating Systems
1 10 (2.65%) Android
2 6 (1.59%) Windows
3 5 (1.33%) Linux
4 3 (0.80%) Apple iOS
5 1 (0.27%) CentOS
5 1 (0.27%) Red Hat Enterprise Linux
5 1 (0.27%) Ubuntu
5 1 (0.27%) Unix
5 1 (0.27%) Windows Server
Processes & Methodologies
1 139 (36.87%) Agile
2 109 (28.91%) Software Engineering
3 83 (22.02%) DevOps
4 70 (18.57%) Full-Stack Development
5 65 (17.24%) Problem-Solving
6 53 (14.06%) CI/CD
7 49 (13.00%) TDD
8 48 (12.73%) Microservices
9 47 (12.47%) Scrum
10 44 (11.67%) Mentoring
11 43 (11.41%) SDLC
12 41 (10.88%) Clean Code
13 38 (10.08%) Design Patterns
14 35 (9.28%) Computer Science
15 33 (8.75%) Test Automation
16 29 (7.69%) OOP
17 26 (6.90%) MVC
18 25 (6.63%) Software Testing
19 24 (6.37%) Web Development
20 23 (6.10%) Kanban
Programming Languages
1 146 (38.73%) SQL
2 110 (29.18%) JavaScript
3 38 (10.08%) TypeScript
4 33 (8.75%) Java
5 32 (8.49%) Python
6 23 (6.10%) C++
7 14 (3.71%) T-SQL
8 13 (3.45%) Go
9 10 (2.65%) PowerShell
10 8 (2.12%) Ada
11 7 (1.86%) VB.NET
12 6 (1.59%) VB
13 4 (1.06%) C
14 3 (0.80%) Bash
14 3 (0.80%) PL/SQL
15 2 (0.53%) Bicep
15 2 (0.53%) R
15 2 (0.53%) Ruby
15 2 (0.53%) VB6
16 1 (0.27%) Scala
Qualifications
1 83 (22.02%) Degree
2 27 (7.16%) Computer Science Degree
3 12 (3.18%) Security Cleared
4 7 (1.86%) ISTQB
5 5 (1.33%) Microsoft Certification
6 4 (1.06%) CISSP
6 4 (1.06%) CSSLP
6 4 (1.06%) Master's Degree
6 4 (1.06%) SC Cleared
7 3 (0.80%) BC Cleared
7 3 (0.80%) Chartered Engineer
8 2 (0.53%) Azure Certification
8 2 (0.53%) DV Cleared
9 1 (0.27%) AWS Certification
Quality Assurance & Compliance
1 25 (6.63%) QA
2 23 (6.10%) Accessibility
3 21 (5.57%) GDPR
4 19 (5.04%) WCAG
5 5 (1.33%) ISO/IEC 27001
6 4 (1.06%) NIST
7 1 (0.27%) Data Quality
7 1 (0.27%) IEC 62304
System Software
1 25 (6.63%) Docker
2 8 (2.12%) Virtual Machines
3 4 (1.06%) vSphere
4 2 (0.53%) Firmware
5 1 (0.27%) Embedded Firmware
Systems Management
1 16 (4.24%) Kubernetes
2 10 (2.65%) Terraform
3 1 (0.27%) Single Sign-On
Vendors
1 62 (16.45%) Microsoft
2 19 (5.04%) HP
3 8 (2.12%) Google
3 8 (2.12%) Oracle
3 8 (2.12%) Serena
4 4 (1.06%) Salesforce
5 3 (0.80%) YouTube
6 2 (0.53%) BT
7 1 (0.27%) Atlassian
7 1 (0.27%) Citrix
7 1 (0.27%) DevExpress
7 1 (0.27%) Facebook
7 1 (0.27%) MuleSoft
7 1 (0.27%) NEC
7 1 (0.27%) OpenAI
7 1 (0.27%) Planview
7 1 (0.27%) Twitter
7 1 (0.27%) VMware
7 1 (0.27%) Xamarin