Java Jobs in the North West

Java
England > North West

The following table provides summary statistics for permanent job vacancies advertised in the North West with a requirement for Java skills. Included is a benchmarking guide to the salaries offered in vacancies that have cited Java over the 6 months to 7 December 2023 with a comparison to the same period in the previous 2 years.

6 months to
7 Dec 2023
Same period 2022 Same period 2021
Rank 20 21 17
Rank change year-on-year +1 -4 +14
Permanent jobs citing Java 373 1,056 891
As % of all permanent jobs advertised in the North West 9.20% 11.82% 10.45%
As % of the Programming Languages category 23.64% 26.93% 23.37%
Number of salaries quoted 194 497 595
10th Percentile £40,000 £38,350 £37,600
25th Percentile £47,500 £45,000 £45,000
Median annual salary (50th Percentile) £61,250 £60,000 £57,500
Median % change year-on-year +2.08% +4.35% +4.55%
75th Percentile £77,715 £82,500 £68,750
90th Percentile £84,056 £88,750 £82,500
England median annual salary £75,000 £75,000 £70,000
% change year-on-year - +7.14% +7.69%

All Programming Languages
North West

Java is in the Programming Languages category. The following table is for comparison with the above and provides summary statistics for all permanent job vacancies advertised in the North West with a requirement for coding skills.

Permanent vacancies with a requirement for coding skills 1,578 3,921 3,812
As % of all permanent jobs advertised in the North West 38.93% 43.89% 44.71%
Number of salaries quoted 1,136 2,289 2,977
10th Percentile £36,250 £35,000 £33,750
25th Percentile £43,188 £42,500 £40,000
Median annual salary (50th Percentile) £57,500 £55,000 £52,500
Median % change year-on-year +4.55% +4.76% +5.00%
75th Percentile £71,250 £70,000 £66,500
90th Percentile £82,548 £85,000 £81,250
England median annual salary £65,000 £65,000 £60,000
% change year-on-year - +8.33% +4.35%

Java
Job Vacancy Trend in the North West

Job postings citing Java as a proportion of all IT jobs advertised in the North West.
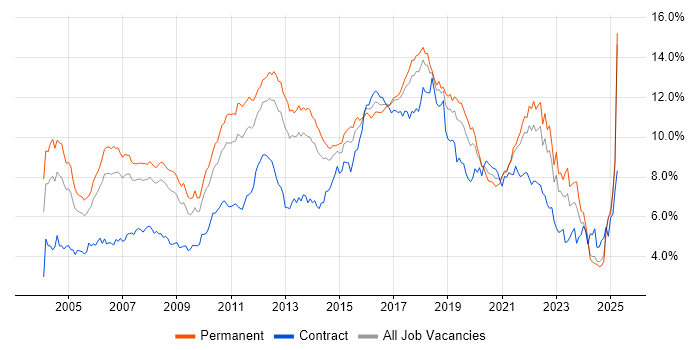
Job vacancy trend for Java in the North West

Java
Salary Trend in the North West

3-month moving average salary quoted in jobs citing Java in the North West.

Salary trend for Java in the North West

Java
Salary Histogram in the North West

Salary distribution for jobs citing Java in the North West over the 6 months to 7 December 2023.

Salary histogram for Java in the North West

Java
Job Locations in the North West

The table below looks at the demand and provides a guide to the median salaries quoted in IT jobs citing Java within the North West region over the 6 months to 7 December 2023. The 'Rank Change' column provides an indication of the change in demand within each location based on the same 6 month period last year.

Location Rank Change
on Same Period
Last Year
Matching
Permanent
IT Job Ads
Median Salary
Past 6 Months
Median Salary
% Change
on Same Period
Last Year
Live
Jobs
Manchester -1 295 £61,000 +1.67% 71
Merseyside -14 52 £39,500 -50.63% 4
Cheshire +15 20 £79,816 +77.37% 26
Cumbria +7 3 £82,500 -
Lancashire -12 1 £50,000 +5.26% 17
Java
England

Java
Co-occurring Skills and Capabilities in the North West by Category

The follow tables expand on the table above by listing co-occurrences grouped by category. The same employment type, locality and period is covered with up to 20 co-occurrences shown in each of the following categories:

Application Platforms
1 14 (3.75%) JBoss
1 14 (3.75%) Red Hat Fuse
2 9 (2.41%) Apache Spark
3 7 (1.88%) WebSphere
4 6 (1.61%) Tomcat
5 4 (1.07%) Apache
5 4 (1.07%) Captiva
5 4 (1.07%) FileNet
5 4 (1.07%) nginx
6 3 (0.80%) Apache Airflow
6 3 (0.80%) Jetty
6 3 (0.80%) WebSphere Application Server
7 2 (0.54%) Confluence
8 1 (0.27%) NetWeaver
Applications
1 2 (0.54%) Microsoft Office
Business Applications
1 1 (0.27%) SAP ERP
1 1 (0.27%) SAP S/4HANA
Cloud Services
1 162 (43.43%) AWS
2 113 (30.29%) Azure
3 76 (20.38%) GCP
4 65 (17.43%) Serverless
5 48 (12.87%) OpenShift
6 26 (6.97%) GitHub
7 18 (4.83%) Azure DevOps
8 16 (4.29%) Amazon S3
9 13 (3.49%) Amazon EC2
9 13 (3.49%) SaaS
10 11 (2.95%) AWS Lambda
11 9 (2.41%) Google Kubernetes Engine
12 5 (1.34%) Power Platform
13 4 (1.07%) Amazon EKS
13 4 (1.07%) AWS CloudFormation
13 4 (1.07%) Cloud Computing
14 3 (0.80%) Apigee
14 3 (0.80%) Google Analytics
14 3 (0.80%) npm
14 3 (0.80%) Sumo Logic
Communications & Networking
1 9 (2.41%) Firewall
1 9 (2.41%) HTTP
2 7 (1.88%) DHCP
2 7 (1.88%) DNS
2 7 (1.88%) Internet
2 7 (1.88%) TCP/IP
3 4 (1.07%) Wireless
4 2 (0.54%) Asterisk PBX
4 2 (0.54%) PBX
4 2 (0.54%) VoIP
5 1 (0.27%) Unified Communications
Database & Business Intelligence
1 35 (9.38%) MongoDB
2 27 (7.24%) Elasticsearch
2 27 (7.24%) Relational Database
3 22 (5.90%) PostgreSQL
4 17 (4.56%) RDBMS
5 14 (3.75%) Big Data
5 14 (3.75%) Oracle Database
6 10 (2.68%) Amazon RDS
6 10 (2.68%) MySQL
6 10 (2.68%) Redis
7 7 (1.88%) NoSQL
7 7 (1.88%) SQL Server
8 6 (1.61%) Hadoop
9 5 (1.34%) Data Lake
9 5 (1.34%) Power BI
10 4 (1.07%) DynamoDB
10 4 (1.07%) JasperReports
10 4 (1.07%) Oracle Reports
11 3 (0.80%) BusinessObjects
11 3 (0.80%) Data Warehouse
Development Applications
1 74 (19.84%) Git
2 69 (18.50%) Jenkins
3 38 (10.19%) Selenium
4 35 (9.38%) Cucumber
5 28 (7.51%) Cypress.io
6 21 (5.63%) IntelliJ
7 19 (5.09%) Spinnaker
8 16 (4.29%) JIRA
9 11 (2.95%) GitLab
10 10 (2.68%) JUnit
11 8 (2.14%) Gradle
11 8 (2.14%) Maven
12 7 (1.88%) Mockito
12 7 (1.88%) TeamCity
13 6 (1.61%) JDeveloper
13 6 (1.61%) WebDriver
14 5 (1.34%) Protractor
14 5 (1.34%) SonarQube
15 4 (1.07%) GDB
15 4 (1.07%) IBM UrbanCode
General
1 90 (24.13%) Finance
2 81 (21.72%) Social Skills
3 61 (16.35%) Banking
4 48 (12.87%) Inclusion and Diversity
5 32 (8.58%) Aerospace
6 29 (7.77%) Police
7 24 (6.43%) Analytical Skills
8 22 (5.90%) Public Sector
9 13 (3.49%) Retail
10 7 (1.88%) Retail Banking
11 5 (1.34%) Automotive
11 5 (1.34%) Organisational Skills
12 3 (0.80%) Marketing
12 3 (0.80%) Telecoms
13 2 (0.54%) Mandarin Language
13 2 (0.54%) Tech for Good
14 1 (0.27%) Investment Banking
14 1 (0.27%) Law
14 1 (0.27%) Pharmaceutical
14 1 (0.27%) Presentation Skills
Job Titles
1 173 (46.38%) Software Engineer
2 106 (28.42%) Developer
3 91 (24.40%) Senior
4 58 (15.55%) Java Engineer
5 55 (14.75%) Java Software Engineer
6 52 (13.94%) Java Developer
7 50 (13.40%) Senior Software Engineer
8 30 (8.04%) Software Developer
9 27 (7.24%) Architect
10 24 (6.43%) Senior Developer
11 20 (5.36%) Lead
11 20 (5.36%) Senior Java Engineer
12 19 (5.09%) Senior Java Software Engineer
12 19 (5.09%) Solutions Architect
13 14 (3.75%) Ruby Engineer
14 13 (3.49%) DevOps Engineer
15 12 (3.22%) DV Cleared Software Engineer
15 12 (3.22%) Principal Engineer
15 12 (3.22%) Principal Software Engineer
15 12 (3.22%) Senior Java Developer
Libraries, Frameworks & Software Standards
1 111 (29.76%) Spring
2 90 (24.13%) React
3 75 (20.11%) Node.js
4 50 (13.40%) Spring Boot
5 44 (11.80%) HTML
6 42 (11.26%) .NET
7 41 (10.99%) AngularJS
8 39 (10.46%) REST
9 35 (9.38%) Kafka
10 34 (9.12%) XML
11 32 (8.58%) Ruby on Rails
12 28 (7.51%) CSS
13 27 (7.24%) J2EE
14 23 (6.17%) Hibernate
14 23 (6.17%) RESTful
15 22 (5.90%) JSON
16 21 (5.63%) Web Services
17 14 (3.75%) JPA
17 14 (3.75%) SOAP
17 14 (3.75%) XSD
Miscellaneous
1 31 (8.31%) Self-Motivation
2 29 (7.77%) Cyberattack
3 23 (6.17%) Linux Command Line
3 23 (6.17%) Product Ownership
4 19 (5.09%) Private Cloud
5 11 (2.95%) Hybrid Cloud
6 8 (2.14%) Legacy Applications
7 7 (1.88%) Enterprise Software
7 7 (1.88%) Greenfield Project
7 7 (1.88%) Online Banking
8 6 (1.61%) Cloud Native
8 6 (1.61%) Public Cloud
9 5 (1.34%) Data Protection Act
10 4 (1.07%) DataPower
10 4 (1.07%) Distributed Applications
10 4 (1.07%) Embedded Systems
10 4 (1.07%) Robotics
11 3 (0.80%) Data Centre
11 3 (0.80%) Hackathon
11 3 (0.80%) Legacy Systems
Operating Systems
1 89 (23.86%) Linux
2 25 (6.70%) Windows
3 11 (2.95%) Unix
4 7 (1.88%) Android
4 7 (1.88%) Mac OS
4 7 (1.88%) Red Hat Enterprise Linux
5 3 (0.80%) Windows Server
6 2 (0.54%) CentOS
7 1 (0.27%) Apple iOS
7 1 (0.27%) FreeBSD
7 1 (0.27%) Mac OS X
Processes & Methodologies
1 235 (63.00%) Software Engineering
2 225 (60.32%) Agile
3 130 (34.85%) Microservices
4 106 (28.42%) Problem-Solving
5 101 (27.08%) Mentoring
6 100 (26.81%) DevOps
7 94 (25.20%) Actionable Insight
8 82 (21.98%) Design Patterns
9 76 (20.38%) Containerisation
10 73 (19.57%) CI/CD
11 67 (17.96%) Unit Testing
12 61 (16.35%) Continuous Integration
13 49 (13.14%) Code Quality
14 47 (12.60%) TDD
15 44 (11.80%) Scrum
16 43 (11.53%) Clean Code
17 42 (11.26%) Coaching
18 40 (10.72%) SDLC
19 37 (9.92%) Collaborative Working
19 37 (9.92%) User Experience
Programming Languages
1 201 (53.89%) Python
2 155 (41.55%) JavaScript
3 66 (17.69%) SQL
4 55 (14.75%) C#
5 54 (14.48%) C++
6 48 (12.87%) Ruby
7 45 (12.06%) Go
8 36 (9.65%) TypeScript
9 33 (8.85%) Rust
10 28 (7.51%) Bash
11 19 (5.09%) Perl
12 17 (4.56%) PowerShell
13 15 (4.02%) C
14 12 (3.22%) Kotlin
15 11 (2.95%) Scala
16 7 (1.88%) PL/SQL
17 4 (1.07%) VB.NET
18 3 (0.80%) Groovy
19 2 (0.54%) F#
19 2 (0.54%) Haskell
Qualifications
1 148 (39.68%) Security Cleared
2 73 (19.57%) SC Cleared
3 52 (13.94%) DV Cleared
4 27 (7.24%) AWS Certification
5 24 (6.43%) AWS Certified Cloud Practitioner
5 24 (6.43%) Degree
6 23 (6.17%) AWS Certified Developer
6 23 (6.17%) AWS Certified Solutions Architect
7 15 (4.02%) Computer Science Degree
8 8 (2.14%) OCP
8 8 (2.14%) Oracle Certification
9 6 (1.61%) Master's Degree
10 3 (0.80%) ITIL Certification
11 1 (0.27%) ISEB
11 1 (0.27%) ISTQB
Quality Assurance & Compliance
1 46 (12.33%) QA
2 4 (1.07%) Accessibility
2 4 (1.07%) GDPR
3 3 (0.80%) GMP
4 2 (0.54%) NCSC
4 2 (0.54%) Software Quality Assurance
System Software
1 110 (29.49%) Docker
2 7 (1.88%) Hyper-V
2 7 (1.88%) VMware Infrastructure
3 2 (0.54%) Firmware
3 2 (0.54%) Kamailio
3 2 (0.54%) OpenSIPS
Systems Management
1 98 (26.27%) Kubernetes
2 14 (3.75%) Ansible
3 11 (2.95%) Terraform
4 9 (2.41%) Puppet
5 3 (0.80%) Progress Chef
6 2 (0.54%) Grafana
6 2 (0.54%) Prometheus
7 1 (0.27%) Single Sign-On
Vendors
1 39 (10.46%) Oracle
2 9 (2.41%) Confluent
3 8 (2.14%) Google
3 8 (2.14%) IBM
3 8 (2.14%) Red Hat
4 7 (1.88%) ServiceNow
4 7 (1.88%) VMware
5 6 (1.61%) SAP
6 5 (1.34%) Microsoft
7 4 (1.07%) Kofax
7 4 (1.07%) Pega
7 4 (1.07%) Veracode
8 3 (0.80%) Adobe
9 2 (0.54%) ESRI
10 1 (0.27%) Cadence
10 1 (0.27%) Dynatrace
10 1 (0.27%) New Relic
10 1 (0.27%) Workday