C# Jobs in England

C#
UK > England

The table below provides summary statistics for permanent job vacancies advertised in England requiring C# skills. It includes a benchmarking guide to the annual salaries offered in vacancies that cited C# over the 6 months leading up to 1 May 2025, comparing them to the same period in the previous two years.

6 months to
1 May 2025
Same period 2024 Same period 2023
Rank 48 17 22
Rank change year-on-year -31 +5 -3
Permanent jobs citing C# 2,367 7,175 8,653
As % of all permanent jobs advertised in England 5.14% 8.42% 9.35%
As % of the Programming Languages category 16.95% 25.96% 21.55%
Number of salaries quoted 1,992 6,152 6,621
10th Percentile £40,000 £36,250 £41,250
25th Percentile £47,603 £44,250 £50,000
Median annual salary (50th Percentile) £62,500 £58,500 £65,000
Median % change year-on-year +6.84% -10.00% +8.33%
75th Percentile £78,375 £73,750 £84,000
90th Percentile £97,250 £95,000 £101,250
UK median annual salary £62,500 £57,500 £62,500
% change year-on-year +8.70% -8.00% +7.76%

All Programming Languages
England

C# falls under the Programming Languages category. For comparison with the information above, the following table provides summary statistics for all permanent job vacancies requiring coding skills in England.

Permanent vacancies with a requirement for coding skills 13,968 27,641 40,153
As % of all permanent jobs advertised in England 30.33% 32.44% 43.40%
Number of salaries quoted 10,268 22,520 25,798
10th Percentile £37,500 £35,250 £39,750
25th Percentile £47,683 £45,000 £50,000
Median annual salary (50th Percentile) £62,000 £60,000 £65,000
Median % change year-on-year +3.33% -7.69% +4.00%
75th Percentile £83,750 £80,000 £87,500
90th Percentile £110,000 £100,000 £108,750
UK median annual salary £60,000 £60,000 £65,000
% change year-on-year - -7.69% +4.00%

C#
Job Vacancy Trend in England

Job postings citing C# as a proportion of all IT jobs advertised in England.
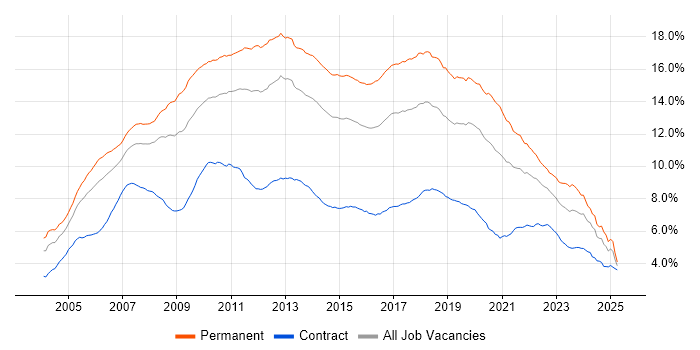
Job vacancy trend for C# in England

C#
Salary Trend in England

3-month moving average salary quoted in jobs citing C# in England.

Salary trend for C# in England

C#
Salary Histogram in England

Salary distribution for jobs citing C# in England over the 6 months to 1 May 2025.

Salary histogram for C# in England

C#
Job Locations in England

The table below looks at the demand and provides a guide to the median salaries quoted in IT jobs citing C# within the England region over the 6 months to 1 May 2025. The 'Rank Change' column provides an indication of the change in demand within each location based on the same 6 month period last year.

Location Rank Change
on Same Period
Last Year
Matching
Permanent
IT Job Ads
Median Salary
Past 6 Months
Median Salary
% Change
on Same Period
Last Year
Live
Jobs
London -28 694 £75,000 -3.23% 737
South East -26 454 £60,000 +4.35% 502
North of England -57 426 £51,068 -7.15% 518
Midlands -28 340 £55,000 +10.00% 324
East of England -4 278 £66,206 +15.14% 170
North West -71 247 £50,055 -8.99% 308
West Midlands -20 234 £55,000 +4.76% 164
South West -47 132 £55,000 +10.00% 149
Yorkshire -29 117 £56,000 +6.67% 134
East Midlands -45 105 £55,000 +10.00% 142
North East -3 62 £57,500 -4.17% 84
C#
UK

C#
Co-occurring Skills and Capabilities in England by Category

The follow tables expand on the table above by listing co-occurrences grouped by category. The same employment type, locality and period is covered with up to 20 co-occurrences shown in each of the following categories:

Application Platforms
1 77 (3.25%) SharePoint
2 57 (2.41%) Confluence
3 47 (1.99%) CMS
4 31 (1.31%) Umbraco
5 23 (0.97%) Apache
6 22 (0.93%) IIS
7 11 (0.46%) Microsoft Exchange
8 8 (0.34%) Kinematics
9 6 (0.25%) NServiceBus
9 6 (0.25%) WordPress
10 5 (0.21%) Apache Airflow
10 5 (0.21%) Apache Spark
10 5 (0.21%) Sitefinity
11 4 (0.17%) Headless CMS
11 4 (0.17%) Kentico
12 3 (0.13%) OpenEdge
12 3 (0.13%) Oracle SOA Suite
12 3 (0.13%) WinCC
13 2 (0.084%) DNN
13 2 (0.084%) Sitecore CMS
Applications
1 129 (5.45%) Chatbot
2 26 (1.10%) Microsoft Office
3 21 (0.89%) Microsoft Excel
4 12 (0.51%) Trello
5 9 (0.38%) Revit
6 5 (0.21%) MS Visio
7 4 (0.17%) Microsoft PowerPoint
8 3 (0.13%) Adobe XD
8 3 (0.13%) AutoCAD
8 3 (0.13%) Productboard
9 1 (0.042%) Adobe Illustrator
9 1 (0.042%) GNU Octave
9 1 (0.042%) InVision
9 1 (0.042%) Photoshop
9 1 (0.042%) Sketch
9 1 (0.042%) S-PLUS
Business Applications
1 106 (4.48%) Dynamics CRM
2 14 (0.59%) Payment Gateway
3 10 (0.42%) Endur
4 8 (0.34%) Oracle EBS
4 8 (0.34%) Orchestrade
5 7 (0.30%) Elite 3E
5 7 (0.30%) Magento
6 5 (0.21%) Shopify
7 3 (0.13%) SAP Business One
8 2 (0.084%) Dynamics GP
8 2 (0.084%) Eikon
8 2 (0.084%) Infor CloudSuite
8 2 (0.084%) Infor CloudSuite Industrial (formerly SyteLine)
8 2 (0.084%) RMDS
9 1 (0.042%) Carpe Diem
9 1 (0.042%) JDE EnterpriseOne
9 1 (0.042%) Visualfiles
Cloud Services
1 996 (42.08%) Azure
2 328 (13.86%) AWS
3 318 (13.43%) Azure DevOps
4 263 (11.11%) Power Platform
5 205 (8.66%) Dynamics 365
6 160 (6.76%) SaaS
7 134 (5.66%) Power Automate
8 133 (5.62%) PowerApps
9 117 (4.94%) Serverless
10 111 (4.69%) GitHub
11 98 (4.14%) Azure Service Bus
12 94 (3.97%) Azure Logic Apps
13 66 (2.79%) Azure Cosmos DB
14 64 (2.70%) Azure Data Factory
15 63 (2.66%) Microsoft 365
16 56 (2.37%) GCP
17 53 (2.24%) Azure Functions
18 40 (1.69%) AWS Lambda
19 39 (1.65%) Azure Synapse Analytics
20 36 (1.52%) GitHub Actions
Communications & Networking
1 24 (1.01%) HTTP
2 23 (0.97%) Intranet
3 15 (0.63%) Firewall
3 15 (0.63%) TCP/IP
4 11 (0.46%) Internet
5 10 (0.42%) Intrusion Detection
6 9 (0.38%) Network Security
7 8 (0.34%) Ethernet
8 6 (0.25%) DNS
9 4 (0.17%) SSL
10 3 (0.13%) Wireshark
11 2 (0.084%) Broadband
11 2 (0.084%) SAN
12 1 (0.042%) FTP
12 1 (0.042%) HTTPS
12 1 (0.042%) Modbus
12 1 (0.042%) MQTT
12 1 (0.042%) Profibus
12 1 (0.042%) SMTP
12 1 (0.042%) tcpdump
Database & Business Intelligence
1 632 (26.70%) SQL Server
2 118 (4.99%) MySQL
3 107 (4.52%) NoSQL
4 102 (4.31%) Relational Database
5 99 (4.18%) MongoDB
6 89 (3.76%) SQL Server Integration Services
7 86 (3.63%) Azure SQL Database
7 86 (3.63%) Power BI
8 81 (3.42%) SQL Server Reporting Services
9 67 (2.83%) Elasticsearch
10 59 (2.49%) PostgreSQL
11 36 (1.52%) Redis
12 32 (1.35%) Big Data
12 32 (1.35%) DB2
13 29 (1.23%) Data Warehouse
14 18 (0.76%) Data Lake
15 13 (0.55%) DynamoDB
16 12 (0.51%) RDBMS
16 12 (0.51%) Tableau
17 10 (0.42%) Amazon Athena
Development Applications
1 336 (14.20%) Git
2 154 (6.51%) Visual Studio
3 153 (6.46%) JIRA
4 77 (3.25%) Octopus Deploy
5 74 (3.13%) Selenium
6 67 (2.83%) Bitbucket
7 54 (2.28%) Team Foundation Server
8 49 (2.07%) Jenkins
9 41 (1.73%) NUnit
10 39 (1.65%) TeamCity
11 37 (1.56%) MSBuild
12 31 (1.31%) Postman
13 28 (1.18%) SpecFlow
14 23 (0.97%) Cypress.io
14 23 (0.97%) GitLab
15 19 (0.80%) Eclipse
15 19 (0.80%) Eclipse RCP
16 18 (0.76%) Atlassian Bamboo
16 18 (0.76%) Visual Studio Code
17 16 (0.68%) Rational DOORS
General
1 573 (24.21%) Social Skills
2 401 (16.94%) Finance
3 152 (6.42%) Analytical Skills
4 115 (4.86%) Retail
5 104 (4.39%) Banking
6 103 (4.35%) Law
7 72 (3.04%) Manufacturing
8 67 (2.83%) Inclusion and Diversity
9 61 (2.58%) Public Sector
10 50 (2.11%) Front Office
11 48 (2.03%) Marketing
12 47 (1.99%) Electronics
13 36 (1.52%) Automotive
14 32 (1.35%) Legal
15 29 (1.23%) Investment Banking
16 25 (1.06%) Games
17 24 (1.01%) Tech for Good
18 19 (0.80%) Back Office
19 18 (0.76%) Organisational Skills
20 17 (0.72%) Retail Banking
Job Titles
1 1,196 (50.53%) Developer
2 598 (25.26%) Senior
3 419 (17.70%) Software Engineer
4 321 (13.56%) C# Developer
5 319 (13.48%) .NET Developer
6 318 (13.43%) Senior Developer
7 273 (11.53%) Lead
8 224 (9.46%) Software Developer
9 151 (6.38%) Full-Stack Developer
10 143 (6.04%) Senior Software Engineer
11 138 (5.83%) C# .NET Developer
12 117 (4.94%) Trainer
13 102 (4.31%) Dynamics 365 Developer
14 99 (4.18%) Analyst
15 92 (3.89%) Architect
16 88 (3.72%) Senior C# Developer
17 80 (3.38%) Senior .NET Developer
18 71 (3.00%) Lead Developer
19 65 (2.75%) Graduate
20 63 (2.66%) Full-Stack C# Developer
Libraries, Frameworks & Software Standards
1 1,440 (60.84%) .NET
2 475 (20.07%) HTML
3 395 (16.69%) ASP.NET
4 365 (15.42%) .NET Core
4 365 (15.42%) CSS
5 354 (14.96%) React
6 327 (13.81%) .NET Framework
7 294 (12.42%) AngularJS
8 189 (7.98%) REST
9 179 (7.56%) RESTful
10 170 (7.18%) Entity Framework
11 139 (5.87%) XML
12 125 (5.28%) ASP.NET Web API
13 118 (4.99%) HTML5
14 113 (4.77%) ASP.NET MVC
15 106 (4.48%) Web Services
16 100 (4.22%) Blazor
17 99 (4.18%) JSON
18 98 (4.14%) jQuery
19 89 (3.76%) Node.js
Miscellaneous
1 87 (3.68%) Cloud Native
2 82 (3.46%) Product Ownership
3 80 (3.38%) Mobile App
4 79 (3.34%) Greenfield Project
5 55 (2.32%) Management Information System
6 52 (2.20%) Algorithms
7 49 (2.07%) Data Structures
7 49 (2.07%) Distributed Systems
8 45 (1.90%) Legacy Applications
9 37 (1.56%) Enterprise Software
10 36 (1.52%) Legacy Systems
11 30 (1.27%) NHS
12 29 (1.23%) Self-Motivation
13 25 (1.06%) Onboarding
13 25 (1.06%) Virtual Team
14 24 (1.01%) Public Cloud
15 23 (0.97%) Client/Server
15 23 (0.97%) Hedge funds
15 23 (0.97%) Robotics
16 20 (0.84%) Foreign Exchange (FX)
Operating Systems
1 185 (7.82%) Windows
2 105 (4.44%) Linux
3 35 (1.48%) Android
4 33 (1.39%) Apple iOS
5 18 (0.76%) Windows Server
6 5 (0.21%) Red Hat Enterprise Linux
7 4 (0.17%) Mac OS
8 2 (0.084%) VMS
8 2 (0.084%) Windows 10
9 1 (0.042%) Windows Server 2016
9 1 (0.042%) Windows Server 2019
Processes & Methodologies
1 869 (36.71%) Agile
2 701 (29.62%) Software Engineering
3 616 (26.02%) DevOps
4 573 (24.21%) Problem-Solving
5 471 (19.90%) CI/CD
6 346 (14.62%) Full-Stack Development
7 336 (14.20%) Microservices
8 319 (13.48%) Computer Science
9 311 (13.14%) MVC
10 282 (11.91%) Mentoring
11 235 (9.93%) Code Quality
12 224 (9.46%) Artificial Intelligence
13 221 (9.34%) OO
14 211 (8.91%) SDLC
15 204 (8.62%) Test Automation
16 198 (8.37%) TDD
17 175 (7.39%) Design Patterns
18 165 (6.97%) Continuous Improvement
19 161 (6.80%) Scrum
20 155 (6.55%) Unit Testing
Programming Languages
1 991 (41.87%) SQL
2 804 (33.97%) JavaScript
3 507 (21.42%) Python
4 404 (17.07%) Java
5 299 (12.63%) TypeScript
6 285 (12.04%) C++
7 101 (4.27%) PowerShell
8 96 (4.06%) T-SQL
9 88 (3.72%) C
10 82 (3.46%) VB.NET
11 62 (2.62%) PHP
12 53 (2.24%) Ada
13 46 (1.94%) PL/SQL
14 43 (1.82%) Rust
15 39 (1.65%) VB
16 25 (1.06%) X++
17 24 (1.01%) Bash
18 20 (0.84%) Go
19 18 (0.76%) Kotlin
20 17 (0.72%) Delphi
Qualifications
1 653 (27.59%) Degree
2 174 (7.35%) Computer Science Degree
3 99 (4.18%) BPSS Clearance
4 96 (4.06%) Security Cleared
5 76 (3.21%) Master's Degree
6 50 (2.11%) SC Cleared
7 48 (2.03%) Microsoft Certification
8 38 (1.61%) Azure Certification
9 35 (1.48%) PhD
10 17 (0.72%) Numerate Degree
11 12 (0.51%) AWS Certification
12 11 (0.46%) AWS Certified Solutions Architect
13 8 (0.34%) ISTQB
14 6 (0.25%) DV Cleared
14 6 (0.25%) ISTQB Foundation Certification
15 5 (0.21%) CompTIA Security+
15 5 (0.21%) MCSE
15 5 (0.21%) TOGAF Certification
16 4 (0.17%) Chartered Engineer
16 4 (0.17%) HND
Quality Assurance & Compliance
1 188 (7.94%) QA
2 70 (2.96%) GDPR
3 49 (2.07%) Accessibility
4 30 (1.27%) WCAG
5 26 (1.10%) ISO/IEC 27001
6 23 (0.97%) Data Quality
7 11 (0.46%) COBIT
8 10 (0.42%) NIST
9 7 (0.30%) SLA
10 6 (0.25%) CDISC
10 6 (0.25%) HIPAA
10 6 (0.25%) PCI DSS
11 5 (0.21%) SOC 2
12 3 (0.13%) Software Quality Assurance
13 2 (0.084%) Actionable Recommendations
13 2 (0.084%) HL7
13 2 (0.084%) MiFID
13 2 (0.084%) MISRA
14 1 (0.042%) ISO 9001
14 1 (0.042%) NIST 800
System Software
1 237 (10.01%) Docker
2 17 (0.72%) Firmware
3 9 (0.38%) Active Directory
4 8 (0.34%) Virtual Machines
5 7 (0.30%) VMware Infrastructure
6 3 (0.13%) LXC
7 2 (0.084%) Embedded Firmware
7 2 (0.084%) vSphere
8 1 (0.042%) HDFS
8 1 (0.042%) Hyper-V
8 1 (0.042%) Squid
8 1 (0.042%) Virtual Desktop
8 1 (0.042%) Xen
Systems Management
1 213 (9.00%) Kubernetes
2 95 (4.01%) Terraform
3 52 (2.20%) Ansible
4 31 (1.31%) Grafana
5 27 (1.14%) Prometheus
6 5 (0.21%) Kibana
7 4 (0.17%) Control-M
8 3 (0.13%) Docker Swarm
8 3 (0.13%) Functional Safety
8 3 (0.13%) Graylog
8 3 (0.13%) Puppet
9 2 (0.084%) Microsoft Intune
9 2 (0.084%) MIIS
9 2 (0.084%) Nmap
9 2 (0.084%) Progress Chef
10 1 (0.042%) Consul
10 1 (0.042%) logstash
10 1 (0.042%) Packer
10 1 (0.042%) Salt
10 1 (0.042%) vRealize
Vendors
1 588 (24.84%) Microsoft
2 123 (5.20%) PayPal
3 91 (3.84%) Oracle
4 63 (2.66%) Databricks
5 61 (2.58%) Google
6 49 (2.07%) Atlassian
7 35 (1.48%) ServiceNow
8 27 (1.14%) Xamarin
9 21 (0.89%) HP
10 20 (0.84%) Salesforce
11 17 (0.72%) IBM
11 17 (0.72%) MuleSoft
12 15 (0.63%) Informatica
13 10 (0.42%) EMC
13 10 (0.42%) Epicor
13 10 (0.42%) OpenLink
13 10 (0.42%) SAP
13 10 (0.42%) Telerik
14 8 (0.34%) Intapp
14 8 (0.34%) VMware