Mentoring Jobs in the North West

Mentorship
England > North West

The following table provides summary statistics for permanent job vacancies advertised in the North West with a requirement for Mentoring skills. Included is a benchmarking guide to the salaries offered in vacancies that have cited Mentoring over the 6 months to 7 December 2023 with a comparison to the same period in the previous 2 years.

6 months to
7 Dec 2023
Same period 2022 Same period 2021
Rank 24 18 24
Rank change year-on-year -6 +6 +34
Permanent jobs citing Mentoring 348 1,125 729
As % of all permanent jobs advertised in the North West 8.59% 12.59% 8.55%
As % of the Processes & Methodologies category 9.05% 13.13% 8.97%
Number of salaries quoted 205 421 491
10th Percentile £29,500 £30,831 £31,250
25th Percentile £42,500 £41,250 £42,500
Median annual salary (50th Percentile) £57,291 £57,500 £55,000
Median % change year-on-year -0.36% +4.55% +4.76%
75th Percentile £73,250 £72,500 £71,250
90th Percentile £91,500 £85,000 £85,000
England median annual salary £67,500 £67,500 £65,000
% change year-on-year - +3.85% +4.00%

All Process and Methodology Skills
North West

Mentoring is in the Processes and Methodologies category. The following table is for comparison with the above and provides summary statistics for all permanent job vacancies advertised in the North West with a requirement for process or methodology skills.

Permanent vacancies with a requirement for process or methodology skills 3,847 8,569 8,125
As % of all permanent jobs advertised in the North West 94.92% 95.91% 95.30%
Number of salaries quoted 2,588 4,969 5,874
10th Percentile £31,175 £31,000 £30,000
25th Percentile £41,500 £40,834 £37,914
Median annual salary (50th Percentile) £55,000 £54,500 £50,000
Median % change year-on-year +0.92% +9.00% -
75th Percentile £70,000 £68,750 £65,000
90th Percentile £83,750 £85,000 £80,000
England median annual salary £60,000 £62,500 £60,000
% change year-on-year -4.00% +4.17% +9.09%

Mentoring
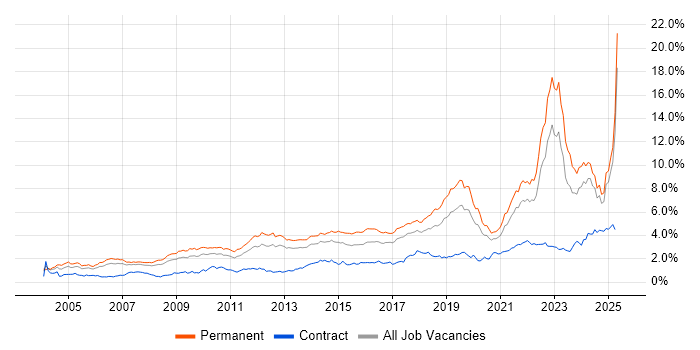
Job Vacancy Trend in the North West

Job postings citing Mentoring as a proportion of all IT jobs advertised in the North West.

Job vacancy trend for Mentoring in the North West

Mentoring
Salary Trend in the North West

3-month moving average salary quoted in jobs citing Mentoring in the North West.

Salary trend for Mentoring in the North West

Mentoring
Salary Histogram in the North West

Salary distribution for jobs citing Mentoring in the North West over the 6 months to 7 December 2023.

Salary histogram for Mentoring in the North West

Mentoring
Job Locations in the North West

The table below looks at the demand and provides a guide to the median salaries quoted in IT jobs citing Mentoring within the North West region over the 6 months to 7 December 2023. The 'Rank Change' column provides an indication of the change in demand within each location based on the same 6 month period last year.

Location Rank Change
on Same Period
Last Year
Matching
Permanent
IT Job Ads
Median Salary
Past 6 Months
Median Salary
% Change
on Same Period
Last Year
Live
Jobs
Manchester -4 245 £62,500 +4.17% 165
Merseyside -5 52 £51,250 -2.38% 20
Cheshire +17 21 £42,681 -24.40% 35
Lancashire -23 20 £48,750 +4.49% 36
Cumbria +7 5 £62,000 +37.78% 8
Mentoring
England

Mentoring
Co-occurring Skills and Capabilities in the North West by Category

The follow tables expand on the table above by listing co-occurrences grouped by category. The same employment type, locality and period is covered with up to 20 co-occurrences shown in each of the following categories:

Application Platforms
1 14 (4.02%) JBoss
1 14 (4.02%) Red Hat Fuse
2 9 (2.59%) IIS
3 5 (1.44%) Confluence
4 4 (1.15%) SharePoint
5 3 (0.86%) Apache
5 3 (0.86%) Apache Airflow
5 3 (0.86%) NServiceBus
5 3 (0.86%) WebSphere
5 3 (0.86%) WebSphere Application Server
6 2 (0.57%) CMS
6 2 (0.57%) Sitecore CMS
7 1 (0.29%) WordPress
Applications
1 11 (3.16%) Microsoft Excel
2 4 (1.15%) Microsoft Office
3 1 (0.29%) Trello
Business Applications
1 2 (0.57%) Magento
1 2 (0.57%) Remedy ITSM
2 1 (0.29%) Dynamics CRM
Cloud Services
1 134 (38.51%) Azure
2 65 (18.68%) AWS
3 51 (14.66%) Power Platform
4 49 (14.08%) GCP
5 42 (12.07%) Serverless
6 40 (11.49%) Azure DevOps
7 31 (8.91%) Dynamics 365
8 26 (7.47%) Microsoft 365
9 12 (3.45%) GitHub
9 12 (3.45%) SaaS
10 7 (2.01%) PaaS
11 6 (1.72%) IaaS
12 5 (1.44%) Amazon EC2
12 5 (1.44%) Amazon S3
12 5 (1.44%) AWS Lambda
12 5 (1.44%) Azure Sentinel
12 5 (1.44%) dbt
13 4 (1.15%) Collibra
13 4 (1.15%) Microsoft Purview
14 3 (0.86%) Cloud Composer
Communications & Networking
1 11 (3.16%) LAN
2 10 (2.87%) Firewall
3 8 (2.30%) SAN
3 8 (2.30%) Structured Cabling
3 8 (2.30%) WAN
4 5 (1.44%) Unified Communications
4 5 (1.44%) Wireless
5 4 (1.15%) DNS
5 4 (1.15%) Network Security
6 3 (0.86%) DHCP
6 3 (0.86%) Internet
6 3 (0.86%) Wi-Fi
7 2 (0.57%) IPv4
7 2 (0.57%) NGFW
7 2 (0.57%) TCP/IP
7 2 (0.57%) VPN
8 1 (0.29%) Ethernet
8 1 (0.29%) HTTP
8 1 (0.29%) PPP
8 1 (0.29%) WLAN
Database & Business Intelligence
1 19 (5.46%) Power BI
2 18 (5.17%) SQL Server
3 9 (2.59%) Big Data
4 7 (2.01%) MongoDB
5 6 (1.72%) Data Lake
5 6 (1.72%) DataStage
5 6 (1.72%) IBM InfoSphere
5 6 (1.72%) PostgreSQL
5 6 (1.72%) SQL Server Analysis Services
6 5 (1.44%) Amazon RDS
6 5 (1.44%) Data Warehouse
6 5 (1.44%) Elasticsearch
6 5 (1.44%) Relational Database
7 4 (1.15%) Metadata
7 4 (1.15%) MySQL
8 3 (0.86%) BigQuery
8 3 (0.86%) BusinessObjects
8 3 (0.86%) BusinessObjects Business Intelligence
8 3 (0.86%) Looker
8 3 (0.86%) Tableau
Development Applications
1 54 (15.52%) Git
2 22 (6.32%) Jenkins
3 14 (4.02%) IntelliJ
4 13 (3.74%) Spinnaker
5 12 (3.45%) JIRA
6 5 (1.44%) IBM UrbanCode
7 4 (1.15%) GDB
8 3 (0.86%) git-flow
8 3 (0.86%) Oracle APEX
8 3 (0.86%) Sonatype Nexus
9 2 (0.57%) GitLab
9 2 (0.57%) Rational DOORS
9 2 (0.57%) SonarQube
10 1 (0.29%) GoCD
10 1 (0.29%) Gradle
10 1 (0.29%) Octopus Deploy
10 1 (0.29%) TeamCity
General
1 109 (31.32%) Social Skills
2 103 (29.60%) Finance
3 47 (13.51%) Inclusion and Diversity
4 38 (10.92%) Banking
5 32 (9.20%) Retail
6 27 (7.76%) Analytical Skills
7 25 (7.18%) Public Sector
8 19 (5.46%) Police
9 15 (4.31%) Marketing
10 14 (4.02%) Law
11 12 (3.45%) Organisational Skills
11 12 (3.45%) Presentation Skills
12 4 (1.15%) Games
12 4 (1.15%) Legal
12 4 (1.15%) Local Government
12 4 (1.15%) Manufacturing
13 3 (0.86%) Advertising
13 3 (0.86%) Automotive
13 3 (0.86%) Telecoms
14 1 (0.29%) Electronics
Job Titles
1 81 (23.28%) Senior
2 66 (18.97%) Software Engineer
3 62 (17.82%) Lead
4 51 (14.66%) Developer
5 48 (13.79%) Architect
6 39 (11.21%) Analyst
7 35 (10.06%) Java Engineer
7 35 (10.06%) Java Software Engineer
8 30 (8.62%) Dynamics 365 Architect
9 27 (7.76%) Senior Developer
10 26 (7.47%) Solutions Architect
11 24 (6.90%) Dynamics 365 Solution Architect
12 23 (6.61%) Senior Software Engineer
13 14 (4.02%) Software Developer
13 14 (4.02%) Team Leader
14 13 (3.74%) Infrastructure Engineer
14 13 (3.74%) Senior Analyst
15 12 (3.45%) Java Developer
16 11 (3.16%) DevOps Engineer
16 11 (3.16%) Principal Engineer
Libraries, Frameworks & Software Standards
1 53 (15.23%) React
2 46 (13.22%) .NET
3 43 (12.36%) Spring
4 32 (9.20%) Node.js
5 25 (7.18%) J2EE
5 25 (7.18%) Ruby on Rails
6 17 (4.89%) Web Services
7 16 (4.60%) AngularJS
7 16 (4.60%) REST
8 15 (4.31%) SOAP
8 15 (4.31%) XML
9 14 (4.02%) Hibernate
9 14 (4.02%) JPA
9 14 (4.02%) JSON
9 14 (4.02%) Kafka
9 14 (4.02%) XSD
10 13 (3.74%) Java EE
11 12 (3.45%) HTML
12 11 (3.16%) RESTful
13 10 (2.87%) .NET Core
Miscellaneous
1 28 (8.05%) Cyberattack
2 24 (6.90%) Self-Motivation
3 23 (6.61%) Linux Command Line
4 22 (6.32%) Product Ownership
4 22 (6.32%) Public Cloud
5 10 (2.87%) Onboarding
5 10 (2.87%) Private Cloud
5 10 (2.87%) Video Conferencing
6 8 (2.30%) Cloud Native
6 8 (2.30%) Virtual Team
7 7 (2.01%) Security Posture
8 6 (1.72%) Analytical Mindset
8 6 (1.72%) Data Protection Act
8 6 (1.72%) Greenfield Project
8 6 (1.72%) Management Information System
9 5 (1.44%) Digital Signage
9 5 (1.44%) Hybrid Cloud
10 4 (1.15%) Cyber Threat
10 4 (1.15%) Distributed Applications
10 4 (1.15%) Distributed Systems
Operating Systems
1 48 (13.79%) Linux
2 44 (12.64%) Windows
3 20 (5.75%) Windows Server
4 15 (4.31%) Windows Server 2012
5 13 (3.74%) Windows 10
6 8 (2.30%) Unix
6 8 (2.30%) Windows Server 2019
7 4 (1.15%) Windows Vista
8 1 (0.29%) Apple iOS
8 1 (0.29%) CoreOS
8 1 (0.29%) Mac OS
8 1 (0.29%) zOS
Processes & Methodologies
1 173 (49.71%) Agile
2 112 (32.18%) Coaching
3 91 (26.15%) Software Engineering
4 85 (24.43%) Problem-Solving
5 82 (23.56%) Actionable Insight
6 81 (23.28%) Microservices
7 76 (21.84%) DevOps
8 47 (13.51%) User Experience
9 43 (12.36%) CI/CD
9 43 (12.36%) Unit Testing
10 42 (12.07%) Scrum
11 40 (11.49%) Containerisation
12 38 (10.92%) Design Patterns
13 36 (10.34%) Software Delivery
14 35 (10.06%) Customer Engagement
15 34 (9.77%) Code Quality
15 34 (9.77%) Machine Learning
16 33 (9.48%) Data Engineering
16 33 (9.48%) Project Management
17 32 (9.20%) Analytics
Programming Languages
1 101 (29.02%) Java
2 69 (19.83%) Python
3 50 (14.37%) C#
4 40 (11.49%) JavaScript
5 35 (10.06%) Go
6 27 (7.76%) Ruby
7 26 (7.47%) SQL
8 23 (6.61%) Rust
9 22 (6.32%) TypeScript
10 15 (4.31%) PowerShell
11 9 (2.59%) Bash
11 9 (2.59%) T-SQL
12 8 (2.30%) PHP
13 6 (1.72%) Scala
14 5 (1.44%) Groovy
15 4 (1.15%) C
15 4 (1.15%) C++
16 3 (0.86%) Kusto Query Language
16 3 (0.86%) PL/SQL
17 2 (0.57%) Bicep
Qualifications
1 89 (25.57%) Security Cleared
2 58 (16.67%) SC Cleared
3 44 (12.64%) Degree
4 31 (8.91%) DV Cleared
5 26 (7.47%) AWS Certification
6 23 (6.61%) AWS Certified Cloud Practitioner
6 23 (6.61%) AWS Certified Developer
6 23 (6.61%) AWS Certified Solutions Architect
7 10 (2.87%) Microsoft Certification
8 7 (2.01%) ITIL Certification
9 5 (1.44%) MCSE
10 4 (1.15%) Chartered Engineer
11 3 (0.86%) Computer Science Degree
11 3 (0.86%) PMI Certification
11 3 (0.86%) PMP
12 2 (0.57%) Azure Certification
12 2 (0.57%) ISEB
12 2 (0.57%) ISTQB
13 1 (0.29%) GCIH
13 1 (0.29%) IIBA
Quality Assurance & Compliance
1 39 (11.21%) QA
2 14 (4.02%) Cyber Essentials
3 6 (1.72%) Accessibility
3 6 (1.72%) Cyber Essentials PLUS
4 5 (1.44%) PMO
5 4 (1.15%) Data Quality
5 4 (1.15%) GMP
6 3 (0.86%) ISO/IEC 27001
6 3 (0.86%) NIST
6 3 (0.86%) SLA
7 2 (0.57%) PCI DSS
8 1 (0.29%) GDPR
8 1 (0.29%) IFRS
8 1 (0.29%) IFRS 17
8 1 (0.29%) NCSC
8 1 (0.29%) NIST 800
8 1 (0.29%) WCAG
System Software
1 32 (9.20%) Docker
2 20 (5.75%) Active Directory
3 12 (3.45%) VMware Infrastructure
4 8 (2.30%) Virtual Servers
4 8 (2.30%) vSphere
5 3 (0.86%) Embedded Firmware
5 3 (0.86%) Firmware
6 2 (0.57%) Hyper-V
6 2 (0.57%) Virtual Machines
7 1 (0.29%) Snort
Systems Management
1 34 (9.77%) Kubernetes
2 22 (6.32%) Terraform
3 16 (4.60%) Ansible
4 10 (2.87%) Microsoft Intune
5 8 (2.30%) Nessus
6 3 (0.86%) MIIS
7 2 (0.57%) CSIRT
7 2 (0.57%) Progress Chef
8 1 (0.29%) CA Endevor
8 1 (0.29%) Single Sign-On
Vendors
1 83 (23.85%) Microsoft
2 21 (6.03%) Google
3 15 (4.31%) Oracle
4 12 (3.45%) IBM
4 12 (3.45%) VMware
5 11 (3.16%) ServiceNow
6 8 (2.30%) arcserve
6 8 (2.30%) Sophos
7 6 (1.72%) Cisco
7 6 (1.72%) Confluent
8 3 (0.86%) Intel
9 2 (0.57%) NEC
9 2 (0.57%) Remedy
9 2 (0.57%) Sitecore
10 1 (0.29%) Apple
10 1 (0.29%) Cadence
10 1 (0.29%) Palo Alto
10 1 (0.29%) Red Hat
10 1 (0.29%) SolarWinds
10 1 (0.29%) Spotify