SC Cleared Jobs in the North West

Security Check (SC) Clearance
England > North West

The following table provides summary statistics for permanent job vacancies advertised in the North West with a requirement for SC Cleared qualifications. Included is a benchmarking guide to the salaries offered over the 6 months to 2 December 2023 with a comparison to the same period in the previous 2 years.

6 months to
2 Dec 2023
Same period 2022 Same period 2021
Rank 35 131 52
Rank change year-on-year +96 -79 +81
Permanent jobs citing SC Cleared 285 236 440
As % of all permanent jobs advertised in the North West 6.95% 2.61% 5.10%
As % of the Qualifications category 23.85% 9.70% 21.69%
Number of salaries quoted 119 142 317
10th Percentile £40,771 £33,750 £29,215
25th Percentile £47,500 £43,528 £38,750
Median annual salary (50th Percentile) £60,000 £55,250 £53,350
Median % change year-on-year +8.60% +3.56% +42.27%
75th Percentile £69,800 £72,188 £71,250
90th Percentile £72,527 £94,875 £82,500
England median annual salary £57,500 £57,500 £60,050
% change year-on-year - -4.25% +9.18%

All Academic and Professional Certifications
North West

SC Cleared is in the Academic Qualifications and Professional Certifications category. The following table is for comparison with the above and provides summary statistics for all permanent job vacancies advertised in the North West with a requirement for academic qualifications or professional certifications.

Permanent vacancies requiring academic qualifications or professional certifications 1,195 2,434 2,029
As % of all permanent jobs advertised in the North West 29.13% 26.94% 23.54%
Number of salaries quoted 663 1,196 1,255
10th Percentile £29,500 £30,000 £26,850
25th Percentile £42,500 £38,750 £36,250
Median annual salary (50th Percentile) £55,000 £50,000 £50,500
Median % change year-on-year +10.00% -0.99% +4.53%
75th Percentile £67,688 £67,500 £67,500
90th Percentile £77,500 £85,000 £80,750
England median annual salary £57,500 £56,000 £55,000
% change year-on-year +2.68% +1.82% -

SC Cleared
Job Vacancy Trend in the North West

Job postings citing SC Cleared as a proportion of all IT jobs advertised in the North West.
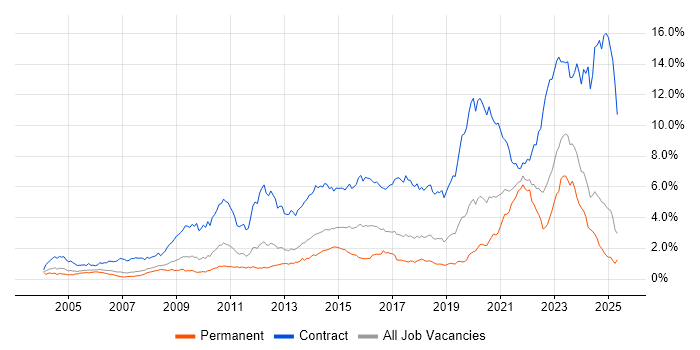
Job vacancy trend for SC Cleared in the North West

SC Cleared
Salary Trend in the North West

3-month moving average salary quoted in jobs citing SC Cleared in the North West.

Salary trend for SC Cleared in the North West

SC Cleared
Salary Histogram in the North West

Salary distribution for jobs citing SC Cleared in the North West over the 6 months to 2 December 2023.

Salary histogram for SC Cleared in the North West

SC Cleared
Job Locations in the North West

The table below looks at the demand and provides a guide to the median salaries quoted in IT jobs citing SC Cleared within the North West region over the 6 months to 2 December 2023. The 'Rank Change' column provides an indication of the change in demand within each location based on the same 6 month period last year.

Location Rank Change
on Same Period
Last Year
Matching
Permanent
IT Job Ads
Median Salary
Past 6 Months
Median Salary
% Change
on Same Period
Last Year
Live
Jobs
Manchester +103 149 £57,291 -4.52% 41
Merseyside +86 78 £60,000 +26.32% 3
Cheshire +42 20 £42,500 -4.20% 26
Lancashire +12 16 £65,000 -31.58% 15
Cumbria +3 14 £57,500 +32.18% 15
SC Cleared
England

SC Cleared
Co-occurring Skills and Capabilities in the North West by Category

The follow tables expand on the table above by listing co-occurrences grouped by category. The same employment type, locality and period is covered with up to 20 co-occurrences shown in each of the following categories:

Application Platforms
1 14 (4.91%) JBoss
1 14 (4.91%) Red Hat Fuse
2 4 (1.40%) Confluence
3 3 (1.05%) WebSphere
3 3 (1.05%) WebSphere Application Server
4 2 (0.70%) SharePoint
Applications
1 16 (5.61%) Microsoft Office
2 4 (1.40%) Windchill
3 2 (0.70%) Chatbot
3 2 (0.70%) Microsoft Excel
3 2 (0.70%) Microsoft PowerPoint
3 2 (0.70%) Simulink
4 1 (0.35%) Acrobat
Business Applications
1 12 (4.21%) Primavera
2 1 (0.35%) Dynamics CRM
2 1 (0.35%) Remedy ITSM
Cloud Services
1 47 (16.49%) Azure
2 39 (13.68%) Serverless
3 34 (11.93%) AWS
4 14 (4.91%) GCP
4 14 (4.91%) Power Platform
5 9 (3.16%) Azure DevOps
6 8 (2.81%) Microsoft 365
7 6 (2.11%) dbt
8 5 (1.75%) AWS Lambda
8 5 (1.75%) Cloud Computing
9 4 (1.40%) GitHub
10 3 (1.05%) Amazon EC2
10 3 (1.05%) Amazon ECS
10 3 (1.05%) Amazon S3
10 3 (1.05%) AWS CloudFormation
10 3 (1.05%) Azure Cosmos DB
11 2 (0.70%) Amazon EKS
11 2 (0.70%) Azure LUIS
11 2 (0.70%) Power Automate
11 2 (0.70%) PowerApps
Communications & Networking
1 22 (7.72%) Wireless
2 15 (5.26%) LAN
3 11 (3.86%) Firewall
4 10 (3.51%) WLAN
5 8 (2.81%) WAN
6 6 (2.11%) SD-WAN
6 6 (2.11%) Software-Defined Radio
7 5 (1.75%) Cisco Firepower
7 5 (1.75%) Cisco IOS
7 5 (1.75%) Cisco ISE
7 5 (1.75%) Ethernet
7 5 (1.75%) F5 BIG-IP GTM
7 5 (1.75%) F5 BIG-IP LTM
7 5 (1.75%) NX-OS
8 4 (1.40%) DNS
8 4 (1.40%) Wireshark
9 3 (1.05%) TCP/IP
10 2 (0.70%) NGFW
10 2 (0.70%) VPN
11 1 (0.35%) IPv6
Database & Business Intelligence
1 17 (5.96%) RDBMS
1 17 (5.96%) Relational Database
2 14 (4.91%) SQL Server
3 12 (4.21%) Power BI
4 10 (3.51%) MySQL
5 8 (2.81%) Oracle Database
6 6 (2.11%) Big Data
6 6 (2.11%) PostgreSQL
7 4 (1.40%) Data Lake
7 4 (1.40%) JasperReports
7 4 (1.40%) Oracle Reports
8 3 (1.05%) BusinessObjects
8 3 (1.05%) BusinessObjects Business Intelligence
8 3 (1.05%) Elasticsearch
9 2 (0.70%) Amazon RDS
9 2 (0.70%) Data Warehouse
9 2 (0.70%) NoSQL
9 2 (0.70%) Redis
10 1 (0.35%) DynamoDB
10 1 (0.35%) GIS
Development Applications
1 39 (13.68%) Git
2 14 (4.91%) IntelliJ
3 12 (4.21%) Jenkins
3 12 (4.21%) JIRA
4 6 (2.11%) GitLab
4 6 (2.11%) Selenium
5 4 (1.40%) AutoIt
5 4 (1.40%) eggPlant
5 4 (1.40%) Maven
5 4 (1.40%) Rational DOORS
6 3 (1.05%) GDB
6 3 (1.05%) Oracle APEX
7 2 (0.70%) Bitbucket
7 2 (0.70%) Cucumber
7 2 (0.70%) Cypress.io
8 1 (0.35%) Eclipse
8 1 (0.35%) REST Assured
8 1 (0.35%) Serenity BDD
8 1 (0.35%) Subversion
8 1 (0.35%) Visual Studio
General
1 106 (37.19%) Social Skills
2 47 (16.49%) Public Sector
3 29 (10.18%) Police
4 15 (5.26%) Analytical Skills
4 15 (5.26%) Inclusion and Diversity
5 14 (4.91%) Influencing Skills
5 14 (4.91%) Retail
6 13 (4.56%) Finance
7 11 (3.86%) Presentation Skills
8 10 (3.51%) Aerospace
9 7 (2.46%) Organisational Skills
10 6 (2.11%) Telecoms
11 4 (1.40%) Automotive
11 4 (1.40%) Avionics
12 2 (0.70%) Digital Economy
12 2 (0.70%) Electronics
12 2 (0.70%) Legal
12 2 (0.70%) Military
13 1 (0.35%) Manufacturing
Job Titles
1 70 (24.56%) Architect
2 54 (18.95%) Software Engineer
3 52 (18.25%) Solutions Architect
4 40 (14.04%) Presales Solution Architect
5 34 (11.93%) Senior
6 31 (10.88%) Developer
7 29 (10.18%) Java Engineer
7 29 (10.18%) Java Software Engineer
8 15 (5.26%) Lead
9 12 (4.21%) Senior Developer
9 12 (4.21%) Systems Engineer
10 11 (3.86%) Consultant
10 11 (3.86%) DevOps Engineer
10 11 (3.86%) Senior Software Engineer
11 10 (3.51%) Business Development Manager
11 10 (3.51%) Business Manager
11 10 (3.51%) Development Manager
11 10 (3.51%) Project Engineer
11 10 (3.51%) Senior Java Engineer
11 10 (3.51%) Senior Java Software Engineer
Libraries, Frameworks & Software Standards
1 41 (14.39%) Spring
2 35 (12.28%) React
3 20 (7.02%) JSON
4 19 (6.67%) J2EE
4 19 (6.67%) Ruby on Rails
4 19 (6.67%) Web Services
4 19 (6.67%) XML
5 16 (5.61%) AngularJS
5 16 (5.61%) RESTful
6 15 (5.26%) Node.js
6 15 (5.26%) SOAP
7 14 (4.91%) Hibernate
7 14 (4.91%) JPA
7 14 (4.91%) REST
7 14 (4.91%) XSD
8 13 (4.56%) .NET
9 12 (4.21%) Java EE
10 6 (2.11%) HTML
11 3 (1.05%) CSS
11 3 (1.05%) HTML5
Miscellaneous
1 16 (5.61%) Public Cloud
2 9 (3.16%) Embedded Systems
2 9 (3.16%) Virtual Team
3 8 (2.81%) Algorithms
3 8 (2.81%) Data Centre
3 8 (2.81%) FPGA
3 8 (2.81%) Management Information System
4 6 (2.11%) VHDL
5 5 (1.75%) Onboarding
5 5 (1.75%) Self-Motivation
6 4 (1.40%) Cloud Native
6 4 (1.40%) Hybrid Cloud
6 4 (1.40%) Security Posture
7 3 (1.05%) Blog
7 3 (1.05%) Cyberattack
7 3 (1.05%) Private Cloud
8 2 (0.70%) Data Structures
8 2 (0.70%) IoT
8 2 (0.70%) Mobile App
8 2 (0.70%) Video Conferencing
Operating Systems
1 27 (9.47%) Linux
2 24 (8.42%) Windows
3 11 (3.86%) Unix
4 4 (1.40%) Windows 10
4 4 (1.40%) Windows Server
5 3 (1.05%) Apple iOS
6 2 (0.70%) Android
7 1 (0.35%) FreeBSD
7 1 (0.35%) Mac OS
7 1 (0.35%) Mac OS X
7 1 (0.35%) Windows 7
7 1 (0.35%) Windows 8
Processes & Methodologies
1 141 (49.47%) Actionable Insight
2 128 (44.91%) Problem-Solving
3 72 (25.26%) Agile
4 66 (23.16%) Software Engineering
5 57 (20.00%) Mentoring
6 52 (18.25%) Analytics
7 48 (16.84%) DevOps
7 48 (16.84%) IT Strategy
8 46 (16.14%) Technology Strategy
9 43 (15.09%) Coaching
9 43 (15.09%) Presales
10 42 (14.74%) Business Case
10 42 (14.74%) Thought Leadership
11 41 (14.39%) Contract Negotiation
12 40 (14.04%) Commercial Awareness
12 40 (14.04%) Data Analytics
12 40 (14.04%) Digital Transformation Programme
13 39 (13.68%) Microservices
14 37 (12.98%) Continuous Integration
14 37 (12.98%) Design Patterns
Programming Languages
1 72 (25.26%) Java
2 66 (23.16%) Python
3 33 (11.58%) Ruby
4 31 (10.88%) C#
5 20 (7.02%) SQL
6 18 (6.32%) JavaScript
7 16 (5.61%) C++
8 14 (4.91%) Go
9 12 (4.21%) Bash
10 11 (3.86%) Perl
10 11 (3.86%) PowerShell
11 8 (2.81%) MATLAB
12 7 (2.46%) C
13 4 (1.40%) VB.NET
14 3 (1.05%) Kusto Query Language
14 3 (1.05%) PL/SQL
15 2 (0.70%) Kotlin
16 1 (0.35%) Shell Script
Qualifications
1 285 (100.00%) Security Cleared
2 29 (10.18%) Degree
3 21 (7.37%) DV Cleared
4 6 (2.11%) Computer Science Degree
4 6 (2.11%) PhD
5 4 (1.40%) CTC Cleared
5 4 (1.40%) TOGAF Certification
6 3 (1.05%) Azure Certification
6 3 (1.05%) ITIL Certification
6 3 (1.05%) Microsoft Certification
7 2 (0.70%) BPSS Clearance
7 2 (0.70%) CCNP
7 2 (0.70%) Cisco Certification
8 1 (0.35%) AWS Certification
8 1 (0.35%) CCNA
8 1 (0.35%) CREST Certified
8 1 (0.35%) DBS Check
8 1 (0.35%) GCFE
8 1 (0.35%) GREM
8 1 (0.35%) OSCP
Quality Assurance & Compliance
1 17 (5.96%) QA
2 2 (0.70%) PMO
3 1 (0.35%) Accessibility
3 1 (0.35%) Def Stans
3 1 (0.35%) ISO/IEC 15288
System Software
1 14 (4.91%) Active Directory
2 8 (2.81%) Docker
3 7 (2.46%) VMware Infrastructure
4 5 (1.75%) VMware NSX
5 2 (0.70%) Firmware
6 1 (0.35%) Hyper-V
6 1 (0.35%) VMware ESXi
6 1 (0.35%) vSphere
Systems Management
1 15 (5.26%) Terraform
2 12 (4.21%) Kubernetes
3 11 (3.86%) Ansible
4 5 (1.75%) FortiGate
5 2 (0.70%) CSIRT
5 2 (0.70%) SCCM
6 1 (0.35%) Microsoft Intune
6 1 (0.35%) Packer
6 1 (0.35%) Puppet
6 1 (0.35%) SCOM
6 1 (0.35%) Single Sign-On
6 1 (0.35%) vCenter Server
Vendors
1 34 (11.93%) Microsoft
2 19 (6.67%) Oracle
3 12 (4.21%) Juniper
3 12 (4.21%) VMware
4 10 (3.51%) Aruba
4 10 (3.51%) ServiceNow
5 9 (3.16%) Infoblox
6 8 (2.81%) Cisco
6 8 (2.81%) Google
7 7 (2.46%) Fortinet
8 5 (1.75%) Blue Coat
8 5 (1.75%) CA
8 5 (1.75%) CheckPoint
8 5 (1.75%) F5
8 5 (1.75%) SolarWinds
9 3 (1.05%) NetApp
10 2 (0.70%) Advent
10 2 (0.70%) IBM
10 2 (0.70%) Intel
10 2 (0.70%) Xamarin