Manufacturing Jobs in the North West

Manufacturing
England > North West

The table below looks at the prevalence of the term Manufacturing in permanent job vacancies in the North West. Included is a benchmarking guide to the salaries offered in vacancies that cited Manufacturing over the 6 months leading up to 30 May 2025, comparing them to the same period in the previous two years.

6 months to
30 May 2025
Same period 2024 Same period 2023
Rank 22 55 125
Rank change year-on-year +33 +70 -49
Permanent jobs citing Manufacturing 779 374 213
As % of all permanent jobs advertised in the North West 9.98% 3.61% 2.81%
As % of the General category 14.19% 6.88% 4.19%
Number of salaries quoted 276 285 137
10th Percentile £32,125 £29,850 £26,100
25th Percentile £41,250 £35,000 £36,250
Median annual salary (50th Percentile) £55,500 £47,500 £47,500
Median % change year-on-year +16.84% - -
75th Percentile £60,000 £57,500 £57,500
90th Percentile - £68,750 £65,800
England median annual salary £52,500 £45,000 £55,000
% change year-on-year +16.67% -18.18% +10.00%

All General Skills
North West

Manufacturing falls under the General Skills category. For comparison with the information above, the following table provides summary statistics for all permanent job vacancies requiring common skills in the North West.

Permanent vacancies with a requirement for common skills 5,490 5,440 5,083
As % of all permanent jobs advertised in the North West 70.35% 52.58% 66.96%
Number of salaries quoted 2,395 3,982 2,369
10th Percentile £25,750 £26,000 £27,250
25th Percentile £41,000 £33,750 £37,500
Median annual salary (50th Percentile) £50,055 £47,500 £52,500
Median % change year-on-year +5.38% -9.52% +3.02%
75th Percentile £61,250 £62,500 £67,500
90th Percentile £77,500 £75,772 £80,000
England median annual salary £56,000 £52,500 £60,000
% change year-on-year +6.67% -12.50% -

Manufacturing
Job Vacancy Trend in the North West

Job postings citing Manufacturing as a proportion of all IT jobs advertised in the North West.
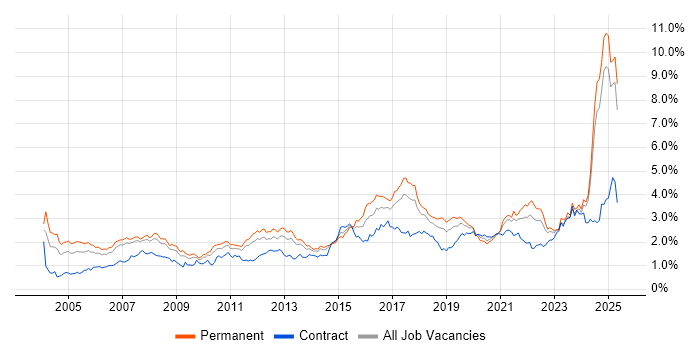
Job vacancy trend for Manufacturing in the North West

Manufacturing
Salary Trend in the North West

3-month moving average salary quoted in jobs citing Manufacturing in the North West.

Salary trend for Manufacturing in the North West

Manufacturing
Salary Histogram in the North West

Salary distribution for jobs citing Manufacturing in the North West over the 6 months to 30 May 2025.

Salary histogram for Manufacturing in the North West

Manufacturing
Job Locations in the North West

The table below looks at the demand and provides a guide to the median salaries quoted in IT jobs citing Manufacturing within the North West region over the 6 months to 30 May 2025. The 'Rank Change' column provides an indication of the change in demand within each location based on the same 6 month period last year.

Location Rank Change
on Same Period
Last Year
Matching
Permanent
IT Job Ads
Median Salary
Past 6 Months
Median Salary
% Change
on Same Period
Last Year
Live
Jobs
Cumbria +20 421 £58,500 +23.16% 22
Merseyside +49 143 £33,500 -18.76% 75
Cheshire +15 99 £43,750 -7.89% 169
Manchester +21 65 £44,500 -1.11% 263
Lancashire -96 48 £51,238 +7.87% 79
Manufacturing
England

Manufacturing
Co-occurring Skills and Capabilities in the North West by Category

The follow tables expand on the table above by listing co-occurrences grouped by category. The same employment type, locality and period is covered with up to 20 co-occurrences shown in each of the following categories:

Application Platforms
1 58 (7.45%) Confluence
2 33 (4.24%) SharePoint
3 21 (2.70%) IBM Domino
4 17 (2.18%) Microsoft Exchange
5 2 (0.26%) Apache
5 2 (0.26%) Apache Spark
5 2 (0.26%) CMS
5 2 (0.26%) nginx
5 2 (0.26%) Sitecore CMS
6 1 (0.13%) WordPress
Applications
1 85 (10.91%) Mathcad
2 77 (9.88%) Abaqus
3 36 (4.62%) Microsoft Office
4 15 (1.93%) Microsoft Excel
5 10 (1.28%) AutoCAD
6 8 (1.03%) SOLIDWORKS
7 5 (0.64%) Autodesk Inventor
8 1 (0.13%) Adobe Illustrator
8 1 (0.13%) Microsoft Project
8 1 (0.13%) Spreadsheet
Business Applications
1 20 (2.57%) Teamcenter
2 17 (2.18%) SAP ERP
2 17 (2.18%) SAP S/4HANA
3 5 (0.64%) NetSuite
3 5 (0.64%) Sage 200
3 5 (0.64%) Sage CRM
4 3 (0.39%) Sage 50
4 3 (0.39%) Sage X3
5 1 (0.13%) Oracle EBS
5 1 (0.13%) Oracle ERP
5 1 (0.13%) SAP EHS
5 1 (0.13%) SAP EWM
5 1 (0.13%) SAP IBP
5 1 (0.13%) SAP Oil and Gas
5 1 (0.13%) SAP PP
Cloud Services
1 21 (2.70%) Azure
2 19 (2.44%) Microsoft 365
3 16 (2.05%) AWS
4 9 (1.16%) Power Platform
5 8 (1.03%) Microsoft Copilot
6 6 (0.77%) Entra ID
7 5 (0.64%) AWS IoT
8 3 (0.39%) SaaS
9 2 (0.26%) AWS Fargate
9 2 (0.26%) AWS Lambda
9 2 (0.26%) Cloud Computing
9 2 (0.26%) Dynamics 365
9 2 (0.26%) Serverless
10 1 (0.13%) Azure DevOps
10 1 (0.13%) GitHub
10 1 (0.13%) Google Analytics
10 1 (0.13%) Kong
10 1 (0.13%) OCI
10 1 (0.13%) Power Automate
10 1 (0.13%) Snowflake
Communications & Networking
1 12 (1.54%) Firewall
2 7 (0.90%) Internet
3 5 (0.64%) LAN
3 5 (0.64%) Remote Desktop
3 5 (0.64%) WAN
4 4 (0.51%) LoRaWAN
5 3 (0.39%) DHCP
5 3 (0.39%) DNS
5 3 (0.39%) VoIP
6 2 (0.26%) Modbus
6 2 (0.26%) Reverse Proxy
6 2 (0.26%) VPN
7 1 (0.13%) MQTT
7 1 (0.13%) Network Security
Database & Business Intelligence
1 8 (1.03%) Power BI
2 4 (0.51%) TimescaleDB
3 3 (0.39%) Big Data
3 3 (0.39%) MySQL
3 3 (0.39%) PostgreSQL
3 3 (0.39%) SQL Server
3 3 (0.39%) Tableau
4 2 (0.26%) Hadoop
4 2 (0.26%) MongoDB
4 2 (0.26%) SQL Server Reporting Services
5 1 (0.13%) Data Warehouse
5 1 (0.13%) Oracle Database
5 1 (0.13%) Oracle Exadata
5 1 (0.13%) Power Query
5 1 (0.13%) Relational Database
5 1 (0.13%) SAP BW
5 1 (0.13%) SQL Server Analysis Services
5 1 (0.13%) SQL Server Integration Services
Development Applications
1 58 (7.45%) JIRA
2 3 (0.39%) Git
3 2 (0.26%) Jenkins
3 2 (0.26%) Visual Studio
4 1 (0.13%) GitLab
4 1 (0.13%) LabVIEW
General
1 133 (17.07%) Analytical Skills
2 106 (13.61%) Finance
3 85 (10.91%) Social Skills
4 80 (10.27%) Retail
5 18 (2.31%) Dutch Language
6 16 (2.05%) Finnish Language
6 16 (2.05%) Inclusion and Diversity
6 16 (2.05%) Norwegian Language
7 15 (1.93%) Organisational Skills
8 14 (1.80%) Automotive
8 14 (1.80%) Pharmaceutical
9 10 (1.28%) Electronics
9 10 (1.28%) Marketing
10 6 (0.77%) Aerospace
11 5 (0.64%) Telecoms
12 4 (0.51%) Catalan Language
12 4 (0.51%) Public Sector
13 3 (0.39%) Presentation Skills
14 2 (0.26%) Advertising
14 2 (0.26%) Wearables
Job Titles
1 146 (18.74%) Lead
2 136 (17.46%) Senior
3 116 (14.89%) Architect
4 114 (14.63%) Solutions Architect
5 105 (13.48%) Project Manager
6 77 (9.88%) Engineering Specialist
6 77 (9.88%) Senior Data Warehouse Specialist
7 61 (7.83%) Trainer
8 58 (7.45%) Lead Architect
8 58 (7.45%) Lead Solutions Architect
9 45 (5.78%) Delivery Project Manager
10 43 (5.52%) Infrastructure Manager
11 30 (3.85%) Analyst
11 30 (3.85%) Infrastructure Project Manager
12 27 (3.47%) Support Engineer
13 21 (2.70%) Configuration Manager
13 21 (2.70%) QA Manager
13 21 (2.70%) Quality Manager
14 20 (2.57%) Products Support Engineer
14 20 (2.57%) Support Analyst
Libraries, Frameworks & Software Standards
1 16 (2.05%) SAP Fiori
2 8 (1.03%) RESTful
3 7 (0.90%) NestJS
3 7 (0.90%) React
4 6 (0.77%) Node.js
5 4 (0.51%) .NET
5 4 (0.51%) CSS
6 2 (0.26%) Apache NiFi
6 2 (0.26%) FastAPI
6 2 (0.26%) HTML
6 2 (0.26%) React Native
6 2 (0.26%) Spring
6 2 (0.26%) Spring Boot
6 2 (0.26%) WinForms
7 1 (0.13%) Azure Blueprints
7 1 (0.13%) Laravel
7 1 (0.13%) Middleware
7 1 (0.13%) Node-RED
7 1 (0.13%) Tailwind CSS
7 1 (0.13%) XML
Miscellaneous
1 60 (7.70%) Robotics
2 44 (5.65%) Management Information System
3 14 (1.80%) Self-Motivation
4 12 (1.54%) IoT
4 12 (1.54%) Renewable Energy
5 8 (1.03%) FMCG
6 7 (0.90%) Manufacturing Execution System
7 4 (0.51%) Biopharmaceutical
7 4 (0.51%) Digital Signage
7 4 (0.51%) Driving Licence
7 4 (0.51%) Legacy Systems
7 4 (0.51%) Life Science
8 3 (0.39%) Cloud Native
8 3 (0.39%) Hybrid Cloud
8 3 (0.39%) Industry 4.0
8 3 (0.39%) Product Ownership
9 2 (0.26%) Client/Server
9 2 (0.26%) Operational Technology
9 2 (0.26%) PMI
9 2 (0.26%) SCADA
Operating Systems
1 22 (2.82%) Windows
2 18 (2.31%) Windows Server
3 12 (1.54%) Linux
4 8 (1.03%) Windows Server 2019
5 1 (0.13%) Android
Processes & Methodologies
1 202 (25.93%) CAD
2 185 (23.75%) ERP
3 140 (17.97%) PLM
4 132 (16.94%) Problem-Solving
5 111 (14.25%) Project Management
6 104 (13.35%) Service Delivery
7 89 (11.42%) Customer Requirements
8 88 (11.30%) Business Strategy
9 83 (10.65%) Coaching
10 82 (10.53%) Business Case
10 82 (10.53%) Lean Manufacturing
10 82 (10.53%) Six Sigma
11 81 (10.40%) Finite Element Analysis
12 80 (10.27%) CMMI
12 80 (10.27%) Zero Defects
13 77 (9.88%) Roadmaps
14 73 (9.37%) Stakeholder Management
15 69 (8.86%) Machine Learning
16 66 (8.47%) Agile
17 63 (8.09%) Artificial Intelligence
Programming Languages
1 24 (3.08%) SQL
2 16 (2.05%) ABAP
3 14 (1.80%) Python
4 9 (1.16%) TypeScript
5 8 (1.03%) MATLAB
6 7 (0.90%) C-shell
6 7 (0.90%) JavaScript
6 7 (0.90%) Korn
6 7 (0.90%) PL/SQL
6 7 (0.90%) Shell Script
7 6 (0.77%) PHP
8 5 (0.64%) C#
8 5 (0.64%) Java
9 4 (0.51%) PowerShell
10 2 (0.26%) T-SQL
11 1 (0.13%) Bicep
11 1 (0.13%) C
11 1 (0.13%) C++
11 1 (0.13%) VBA
Qualifications
1 408 (52.37%) BPSS Clearance
2 237 (30.42%) Degree
3 165 (21.18%) HND
4 99 (12.71%) NVQ Level 3
5 84 (10.78%) Master's Degree
6 78 (10.01%) Chartered Engineer
7 38 (4.88%) HNC
8 10 (1.28%) Computer Science Degree
9 7 (0.90%) PhD
10 5 (0.64%) Microsoft Certification
10 5 (0.64%) Security Cleared
11 3 (0.39%) ACCA
11 3 (0.39%) CCNA
11 3 (0.39%) CIMA
11 3 (0.39%) Cisco Certification
11 3 (0.39%) DV Cleared
11 3 (0.39%) MCSE
11 3 (0.39%) Network+ Certification
12 2 (0.26%) PMI Certification
12 2 (0.26%) PMP
Quality Assurance & Compliance
1 81 (10.40%) ISO 9001
2 80 (10.27%) AQAP
3 30 (3.85%) NEBOSH
4 29 (3.72%) QA
5 7 (0.90%) Accessibility
6 5 (0.64%) GMP
7 2 (0.26%) Data Quality
System Software
1 13 (1.67%) Active Directory
2 7 (0.90%) Docker
3 5 (0.64%) Terminal Services
4 3 (0.39%) Hyper-V
5 1 (0.13%) Embedded Firmware
5 1 (0.13%) Firmware
Systems Management
1 3 (0.39%) Terraform
2 2 (0.26%) Functional Safety
2 2 (0.26%) Kubernetes
3 1 (0.13%) Ansible
3 1 (0.13%) Microsoft Intune
Vendors
1 131 (16.82%) SAP
2 79 (10.14%) Siemens
3 67 (8.60%) Google
4 61 (7.83%) Adobe
5 60 (7.70%) Databricks
6 59 (7.57%) Microsoft
7 12 (1.54%) Oracle
7 12 (1.54%) Sage
8 9 (1.16%) Salesforce
9 8 (1.03%) Cisco
9 8 (1.03%) NEC
10 5 (0.64%) VMware
11 3 (0.39%) Acronis
11 3 (0.39%) Fortinet
11 3 (0.39%) Hitachi
11 3 (0.39%) Kaseya
11 3 (0.39%) Meraki
11 3 (0.39%) SonicWALL
11 3 (0.39%) WatchGuard
12 2 (0.26%) Talend