Retail Jobs in the North West

Retailing
England > North West

The table below looks at the prevalence of the term Retail in permanent job vacancies advertised in the North West. Included is a benchmarking guide to the salaries offered in vacancies that have cited Retail over the 6 months to 2 December 2023 with a comparison to the same period over the previous 2 years.

6 months to
2 Dec 2023
Same period 2022 Same period 2021
Rank 51 39 21
Rank change year-on-year -12 -18 +47
Permanent jobs citing Retail 226 662 796
As % of all permanent jobs advertised in the North West 5.51% 7.33% 9.23%
As % of the General category 8.77% 11.02% 16.77%
Number of salaries quoted 177 379 352
10th Percentile £25,900 £33,000 £29,163
25th Percentile £36,250 £42,250 £35,688
Median annual salary (50th Percentile) £55,000 £52,500 £45,000
Median % change year-on-year +4.76% +16.67% -10.00%
75th Percentile £72,500 £68,552 £60,000
90th Percentile £84,056 £89,000 £75,000
England median annual salary £57,500 £60,000 £57,500
% change year-on-year -4.17% +4.35% -

All General Skills
North West

Retail is in the General Skills category. The following table is for comparison with the above and provides summary statistics for all permanent job vacancies advertised in the North West with a requirement for common skills.

Permanent vacancies with a requirement for common skills 2,578 6,007 4,747
As % of all permanent jobs advertised in the North West 62.85% 66.48% 55.06%
Number of salaries quoted 1,691 3,264 3,097
10th Percentile £27,000 £28,814 £28,000
25th Percentile £40,000 £38,500 £36,250
Median annual salary (50th Percentile) £55,000 £52,500 £50,000
Median % change year-on-year +4.76% +5.00% -
75th Percentile £70,000 £66,250 £63,750
90th Percentile £84,056 £84,056 £77,500
England median annual salary £60,000 £60,000 £60,000
% change year-on-year - - +4.35%

Retail
Job Vacancy Trend in the North West

Job postings citing Retail as a proportion of all IT jobs advertised in the North West.
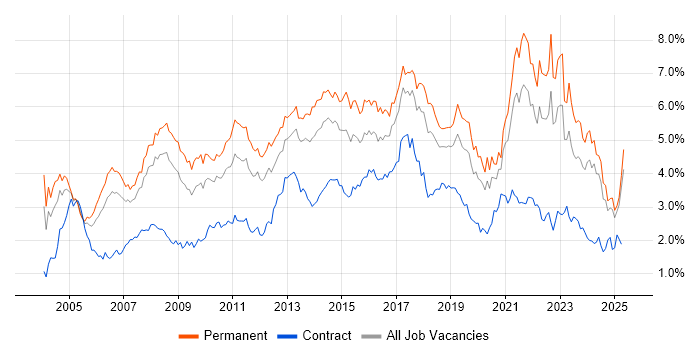
Job vacancy trend for Retail in the North West

Retail
Salary Trend in the North West

3-month moving average salary quoted in jobs citing Retail in the North West.

Salary trend for Retail in the North West

Retail
Salary Histogram in the North West

Salary distribution for jobs citing Retail in the North West over the 6 months to 2 December 2023.

Salary histogram for Retail in the North West

Retail
Job Locations in the North West

The table below looks at the demand and provides a guide to the median salaries quoted in IT jobs citing Retail within the North West region over the 6 months to 2 December 2023. The 'Rank Change' column provides an indication of the change in demand within each location based on the same 6 month period last year.

Location Rank Change
on Same Period
Last Year
Matching
Permanent
IT Job Ads
Median Salary
Past 6 Months
Median Salary
% Change
on Same Period
Last Year
Live
Jobs
Manchester -15 125 £69,447 +23.12% 149
Cheshire +29 46 £37,500 -16.67% 48
Merseyside -6 27 £55,000 +15.79% 31
Lancashire +1 18 £24,000 -52.00% 17
Cumbria +4 1 £52,500 - 10
Retail
England

Retail
Co-occurring Skills and Capabilities in the North West by Category

The follow tables expand on the table above by listing co-occurrences grouped by category. The same employment type, locality and period is covered with up to 20 co-occurrences shown in each of the following categories:

Application Platforms
1 8 (3.54%) SAS
2 6 (2.65%) Apache Spark
3 5 (2.21%) Confluence
3 5 (2.21%) Jetty
3 5 (2.21%) Tomcat
4 1 (0.44%) Moodle
4 1 (0.44%) NetWeaver
Applications
1 17 (7.52%) Microsoft Excel
2 8 (3.54%) Microsoft Office
3 3 (1.33%) Microsoft PowerPoint
4 2 (0.88%) Spreadsheet
5 1 (0.44%) Microsoft Project
Business Applications
1 5 (2.21%) Epicor Tropos
2 4 (1.77%) Dynamics NAV
2 4 (1.77%) SAP CO
2 4 (1.77%) SAP FI
2 4 (1.77%) SAP FI/CO
3 3 (1.33%) SAP S/4HANA
4 2 (0.88%) Magento
4 2 (0.88%) NetSuite
5 1 (0.44%) Dynamics AX
5 1 (0.44%) Dynamics CRM
5 1 (0.44%) SAP BPC
5 1 (0.44%) SAP ERP
Cloud Services
1 46 (20.35%) Azure
2 31 (13.72%) AWS
3 21 (9.29%) GCP
4 19 (8.41%) Power Platform
5 15 (6.64%) Serverless
6 12 (5.31%) SaaS
7 9 (3.98%) GitHub
7 9 (3.98%) IaaS
7 9 (3.98%) PaaS
8 8 (3.54%) Azure Cosmos DB
8 8 (3.54%) Azure DevOps
8 8 (3.54%) Azure Service Bus
8 8 (3.54%) Microsoft 365
9 6 (2.65%) Azure API Management
9 6 (2.65%) Azure App Service
9 6 (2.65%) Google Kubernetes Engine
10 5 (2.21%) Azure Functions
11 4 (1.77%) Azure Data Factory
12 3 (1.33%) Azure Logic Apps
13 2 (0.88%) npm
Communications & Networking
1 13 (5.75%) Firewall
2 8 (3.54%) DNS
3 7 (3.10%) DHCP
4 6 (2.65%) Internet
5 5 (2.21%) F5 BIG-IP GTM
5 5 (2.21%) F5 BIG-IP LTM
5 5 (2.21%) Remote Desktop
6 3 (1.33%) WAN
7 2 (0.88%) LAN
7 2 (0.88%) Network Security
7 2 (0.88%) NGFW
7 2 (0.88%) Wi-Fi
8 1 (0.44%) 2G
8 1 (0.44%) 3G
8 1 (0.44%) 3GPP
8 1 (0.44%) 4G
8 1 (0.44%) IPv6
8 1 (0.44%) SNMP
8 1 (0.44%) TCP/IP
8 1 (0.44%) ZigBee
Database & Business Intelligence
1 19 (8.41%) Power BI
2 16 (7.08%) MySQL
3 15 (6.64%) SQL Server
4 13 (5.75%) Data Warehouse
5 10 (4.42%) Data Lake
6 9 (3.98%) Big Data
6 9 (3.98%) NoSQL
7 6 (2.65%) PostgreSQL
8 5 (2.21%) Data Hub
8 5 (2.21%) Hadoop
8 5 (2.21%) SQL Server Reporting Services
9 4 (1.77%) RDBMS
9 4 (1.77%) Relational Database
10 3 (1.33%) Azure SQL Database
10 3 (1.33%) MS Access
10 3 (1.33%) SQL Server Integration Services
11 1 (0.44%) DynamoDB
11 1 (0.44%) Geospatial Data
11 1 (0.44%) Metadata
11 1 (0.44%) SQL Server Analysis Services
Development Applications
1 28 (12.39%) Git
2 11 (4.87%) Jenkins
3 6 (2.65%) Spinnaker
4 5 (2.21%) JIRA
5 3 (1.33%) git-flow
6 2 (0.88%) Gitleaks
6 2 (0.88%) SonarQube
6 2 (0.88%) SpecFlow
7 1 (0.44%) Appium
7 1 (0.44%) CMake
7 1 (0.44%) GitLab
7 1 (0.44%) GoogleTest
7 1 (0.44%) Postman
7 1 (0.44%) Selenium
7 1 (0.44%) SoapUI
General
1 69 (30.53%) Social Skills
2 66 (29.20%) Finance
3 52 (23.01%) Banking
4 45 (19.91%) Analytical Skills
5 25 (11.06%) Inclusion and Diversity
6 15 (6.64%) Marketing
7 10 (4.42%) Retail Banking
8 7 (3.10%) Manufacturing
9 5 (2.21%) Pharmaceutical
9 5 (2.21%) Presentation Skills
10 4 (1.77%) Legal
10 4 (1.77%) Telecoms
11 3 (1.33%) Back Office
11 3 (1.33%) Local Government
11 3 (1.33%) Public Sector
12 2 (0.88%) Automotive
12 2 (0.88%) Law
12 2 (0.88%) Organisational Skills
12 2 (0.88%) Retail Finance
13 1 (0.44%) Influencing Skills
Job Titles
1 46 (20.35%) Senior
2 42 (18.58%) Analyst
3 39 (17.26%) Developer
4 30 (13.27%) Lead
5 28 (12.39%) Architect
6 21 (9.29%) Software Engineer
7 16 (7.08%) Solutions Architect
8 11 (4.87%) DevOps Engineer
9 10 (4.42%) Data Analyst
9 10 (4.42%) Senior Architect
9 10 (4.42%) Senior Solutions Architect
10 9 (3.98%) Analyst Developer
10 9 (3.98%) Cloud Engineer
10 9 (3.98%) Report Analyst
10 9 (3.98%) Report Developer
10 9 (3.98%) Service Analyst
11 8 (3.54%) Enterprise Architect
11 8 (3.54%) Full Stack Developer
11 8 (3.54%) GCP Engineer
11 8 (3.54%) Senior Developer
Libraries, Frameworks & Software Standards
1 27 (11.95%) .NET
2 22 (9.73%) React
3 17 (7.52%) Node.js
4 16 (7.08%) CSS
5 15 (6.64%) HTML
6 12 (5.31%) Next.js
7 10 (4.42%) .NET Core
7 10 (4.42%) RESTful
8 9 (3.98%) jQuery
8 9 (3.98%) Laravel
9 8 (3.54%) Jest
9 8 (3.54%) OpenID
10 6 (2.65%) AngularJS
10 6 (2.65%) JSON
10 6 (2.65%) Kafka
11 5 (2.21%) Spine.js
11 5 (2.21%) Spring
11 5 (2.21%) Web Services
11 5 (2.21%) XML
12 4 (1.77%) Symfony
Miscellaneous
1 22 (9.73%) Product Ownership
2 13 (5.75%) Cloud Native
3 10 (4.42%) Analytical Mindset
3 10 (4.42%) Public Cloud
4 8 (3.54%) Blockchain
4 8 (3.54%) Mainframe
5 6 (2.65%) Data Centre
5 6 (2.65%) Management Information System
6 5 (2.21%) Credit Risk
6 5 (2.21%) Fat Client
6 5 (2.21%) Onboarding
6 5 (2.21%) Online Banking
6 5 (2.21%) Thin Client
7 4 (1.77%) Cyberattack
7 4 (1.77%) Hybrid Cloud
7 4 (1.77%) Self-Motivation
8 3 (1.33%) Driving Licence
9 2 (0.88%) Data Protection Act
9 2 (0.88%) Enterprise Cloud
9 2 (0.88%) FMCG
Operating Systems
1 11 (4.87%) Linux
1 11 (4.87%) Windows
2 8 (3.54%) Unix
2 8 (3.54%) Windows Server
3 1 (0.44%) Android
3 1 (0.44%) Mac OS
Processes & Methodologies
1 96 (42.48%) Agile
2 54 (23.89%) Problem-Solving
3 53 (23.45%) CI/CD
4 49 (21.68%) DevOps
5 41 (18.14%) Microservices
6 40 (17.70%) Analytics
7 38 (16.81%) Mentoring
8 36 (15.93%) Software Engineering
9 26 (11.50%) Customer Service
9 26 (11.50%) TDD
10 25 (11.06%) Roadmaps
11 24 (10.62%) E-Commerce
12 22 (9.73%) Data Strategy
13 19 (8.41%) Coaching
14 18 (7.96%) ERP
15 17 (7.52%) Business Intelligence
15 17 (7.52%) Data Analytics
15 17 (7.52%) ITSM
15 17 (7.52%) Scrum
15 17 (7.52%) Thought Leadership
Programming Languages
1 40 (17.70%) SQL
2 26 (11.50%) Python
3 25 (11.06%) C#
4 21 (9.29%) Java
4 21 (9.29%) JavaScript
5 15 (6.64%) TypeScript
6 12 (5.31%) PHP
7 11 (4.87%) PowerShell
8 5 (2.21%) Bash
8 5 (2.21%) Scala
9 4 (1.77%) T-SQL
10 3 (1.33%) ABAP
11 2 (0.88%) Bicep
11 2 (0.88%) Kusto Query Language
12 1 (0.44%) C
12 1 (0.44%) C++
12 1 (0.44%) Go
12 1 (0.44%) Lua
12 1 (0.44%) R
12 1 (0.44%) Shell Script
Qualifications
1 14 (6.19%) SC Cleared
1 14 (6.19%) Security Cleared
2 11 (4.87%) Degree
3 4 (1.77%) PMI Certification
4 2 (0.88%) AWS Certification
4 2 (0.88%) PMP
5 1 (0.44%) APMP
5 1 (0.44%) AWS Certified Solutions Architect
5 1 (0.44%) Azure Certification
5 1 (0.44%) CCNA
5 1 (0.44%) Cisco Certification
5 1 (0.44%) CISM
5 1 (0.44%) Computer Science Degree
5 1 (0.44%) DV Cleared
5 1 (0.44%) ISO 27001 Lead Implementer
5 1 (0.44%) ISTQB
5 1 (0.44%) PCI QSA
5 1 (0.44%) SANS
Quality Assurance & Compliance
1 9 (3.98%) QA
2 3 (1.33%) GDPR
3 2 (0.88%) Accessibility
3 2 (0.88%) IFRS
3 2 (0.88%) ISO/IEC 27001
3 2 (0.88%) PCI DSS
3 2 (0.88%) SLA
4 1 (0.44%) Data Quality
4 1 (0.44%) ISO 22301
4 1 (0.44%) NIST
4 1 (0.44%) WCAG
System Software
1 28 (12.39%) Docker
2 18 (7.96%) Active Directory
3 2 (0.88%) Firmware
3 2 (0.88%) Hyper-V
3 2 (0.88%) Virtual Machines
3 2 (0.88%) VMware Infrastructure
Systems Management
1 44 (19.47%) Kubernetes
2 30 (13.27%) Terraform
3 12 (5.31%) Ansible
4 2 (0.88%) CSIRT
4 2 (0.88%) Istio
5 1 (0.44%) HP Fortify
5 1 (0.44%) Packer
5 1 (0.44%) SCCM
5 1 (0.44%) Systems Management Server (SMS)
5 1 (0.44%) WSUS
Vendors
1 46 (20.35%) Microsoft
2 7 (3.10%) SAP
3 6 (2.65%) Cisco
3 6 (2.65%) Confluent
4 5 (2.21%) CheckPoint
4 5 (2.21%) Epicor
4 5 (2.21%) F5
4 5 (2.21%) Fortinet
4 5 (2.21%) ServiceNow
5 4 (1.77%) Oracle
6 3 (1.33%) Salesforce
7 2 (0.88%) Google
7 2 (0.88%) Intel
7 2 (0.88%) Jitterbit
7 2 (0.88%) MuleSoft
7 2 (0.88%) VMware
8 1 (0.44%) Cadence
8 1 (0.44%) HubSpot
8 1 (0.44%) Splunk
8 1 (0.44%) Workday