Docker Jobs in the North West

Docker
England > North West

The following table provides summary statistics for permanent job vacancies advertised in the North West with a requirement for Docker skills. Included is a benchmarking guide to the salaries offered in vacancies that have cited Docker over the 6 months to 1 December 2023 with a comparison to the same period in the previous 2 years.

6 months to
1 Dec 2023
Same period 2022 Same period 2021
Rank 34 38 25
Rank change year-on-year +4 -13 +5
Permanent jobs citing Docker 292 661 711
As % of all permanent jobs advertised in the North West 7.07% 7.35% 8.26%
As % of the System Software category 42.38% 48.00% 46.11%
Number of salaries quoted 221 293 552
10th Percentile £43,750 £41,250 £37,750
25th Percentile £50,000 £50,000 £48,750
Median annual salary (50th Percentile) £67,500 £70,000 £60,000
Median % change year-on-year -3.57% +16.67% +9.09%
75th Percentile £80,000 £85,000 £80,969
90th Percentile £90,000 £95,000 £95,000
England median annual salary £72,000 £75,000 £70,000
% change year-on-year -4.00% +7.14% +7.69%

All System Software Skills
North West

Docker is in the System Software category. The following table is for comparison with the above and provides summary statistics for all permanent job vacancies advertised in the North West with a requirement for system software skills.

Permanent vacancies with a requirement for system software skills 689 1,377 1,542
As % of all permanent jobs advertised in the North West 16.68% 15.31% 17.91%
Number of salaries quoted 542 913 1,227
10th Percentile £27,000 £25,000 £25,000
25th Percentile £36,250 £32,500 £31,880
Median annual salary (50th Percentile) £52,500 £46,000 £50,000
Median % change year-on-year +14.13% -8.00% +5.26%
75th Percentile £70,000 £67,500 £67,500
90th Percentile £82,250 £85,000 £85,000
England median annual salary £55,000 £55,000 £57,500
% change year-on-year - -4.35% +4.55%

Docker
Job Vacancy Trend in the North West

Job postings citing Docker as a proportion of all IT jobs advertised in the North West.
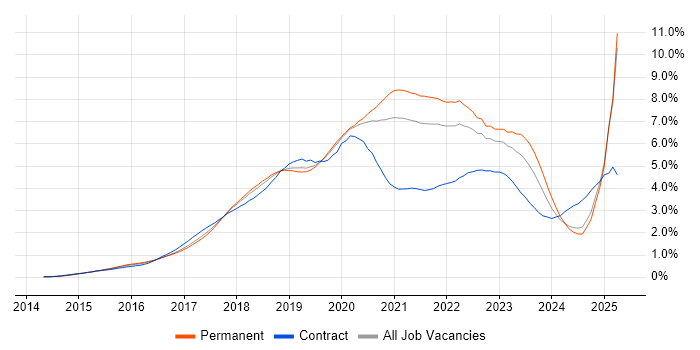
Job vacancy trend for Docker in the North West

Docker
Salary Trend in the North West

3-month moving average salary quoted in jobs citing Docker in the North West.

Salary trend for Docker in the North West

Docker
Salary Histogram in the North West

Salary distribution for jobs citing Docker in the North West over the 6 months to 1 December 2023.

Salary histogram for Docker in the North West

Docker
Job Locations in the North West

The table below looks at the demand and provides a guide to the median salaries quoted in IT jobs citing Docker within the North West region over the 6 months to 1 December 2023. The 'Rank Change' column provides an indication of the change in demand within each location based on the same 6 month period last year.

Location Rank Change
on Same Period
Last Year
Matching
Permanent
IT Job Ads
Median Salary
Past 6 Months
Median Salary
% Change
on Same Period
Last Year
Live
Jobs
Manchester +4 236 £65,000 - 59
Merseyside -19 25 £65,000 -18.75% 12
Cheshire +25 17 £80,000 +45.45% 13
Lancashire +32 5 £63,750 - 7
Docker
England

Docker
Co-occurring Skills and Capabilities in the North West by Category

The follow tables expand on the table above by listing co-occurrences grouped by category. The same employment type, locality and period is covered with up to 20 co-occurrences shown in each of the following categories:

Application Platforms
1 7 (2.40%) Apache Spark
2 4 (1.37%) nginx
3 3 (1.03%) NServiceBus
3 3 (1.03%) Tomcat
4 2 (0.68%) Confluence
5 1 (0.34%) Apache
Cloud Services
1 154 (52.74%) AWS
2 140 (47.95%) Azure
3 65 (22.26%) Azure DevOps
4 56 (19.18%) PaaS
5 53 (18.15%) GitHub
6 49 (16.78%) Serverless
7 48 (16.44%) GCP
8 45 (15.41%) IaaS
9 44 (15.07%) OpenShift
10 21 (7.19%) SaaS
11 16 (5.48%) AWS Lambda
12 13 (4.45%) AWS CloudFormation
13 12 (4.11%) Amazon S3
14 11 (3.77%) Amazon EC2
15 7 (2.40%) Amazon Kinesis
15 7 (2.40%) Azure Monitor
15 7 (2.40%) Azure Service Bus
16 5 (1.71%) Azure Cosmos DB
16 5 (1.71%) Entra ID
16 5 (1.71%) npm
Communications & Networking
1 16 (5.48%) HTTP
2 14 (4.79%) DNS
3 10 (3.42%) TCP/IP
4 9 (3.08%) VPN
5 7 (2.40%) DHCP
6 5 (1.71%) Internet
6 5 (1.71%) IPv4
6 5 (1.71%) OSPF
6 5 (1.71%) VLAN
7 4 (1.37%) Firewall
8 3 (1.03%) VoIP
9 2 (0.68%) Asterisk PBX
9 2 (0.68%) PBX
9 2 (0.68%) SSH
9 2 (0.68%) Wireless
10 1 (0.34%) DVB
10 1 (0.34%) IPv6
10 1 (0.34%) Network Security
10 1 (0.34%) Unified Communications
Database & Business Intelligence
1 36 (12.33%) MongoDB
2 24 (8.22%) Elasticsearch
3 18 (6.16%) MySQL
4 14 (4.79%) PostgreSQL
5 7 (2.40%) Amazon RDS
5 7 (2.40%) NoSQL
5 7 (2.40%) SQL Server
6 5 (1.71%) Azure SQL Database
6 5 (1.71%) DynamoDB
6 5 (1.71%) Redis
7 4 (1.37%) DTS
7 4 (1.37%) Relational Database
8 3 (1.03%) Amazon Aurora
8 3 (1.03%) Data Lake
9 2 (0.68%) Big Data
9 2 (0.68%) Data Warehouse
9 2 (0.68%) InfluxDB
10 1 (0.34%) Amazon Redshift
10 1 (0.34%) Neo4j
Development Applications
1 93 (31.85%) Jenkins
2 72 (24.66%) Git
3 29 (9.93%) Cucumber
4 28 (9.59%) Selenium
5 27 (9.25%) Cypress.io
6 13 (4.45%) GitLab
7 11 (3.77%) JUnit
8 10 (3.42%) SonarQube
8 10 (3.42%) TeamCity
9 9 (3.08%) Gradle
10 8 (2.74%) Bitbucket
10 8 (2.74%) Spinnaker
11 7 (2.40%) IBM UrbanCode
11 7 (2.40%) IntelliJ
11 7 (2.40%) Mockito
12 6 (2.05%) JIRA
13 3 (1.03%) git-flow
13 3 (1.03%) gulp
13 3 (1.03%) JSUnit
13 3 (1.03%) Mocha
General
1 45 (15.41%) Finance
2 39 (13.36%) Banking
3 32 (10.96%) Social Skills
4 28 (9.59%) Retail
5 27 (9.25%) Aerospace
6 24 (8.22%) Inclusion and Diversity
7 14 (4.79%) Analytical Skills
8 5 (1.71%) Retail Banking
8 5 (1.71%) Telecoms
9 4 (1.37%) Organisational Skills
10 3 (1.03%) Public Sector
11 2 (0.68%) Electronics
11 2 (0.68%) Russian Language
12 1 (0.34%) Advertising
12 1 (0.34%) Automotive
12 1 (0.34%) Avionics
12 1 (0.34%) Games
12 1 (0.34%) Multimedia
12 1 (0.34%) Pharmaceutical
Job Titles
1 75 (25.68%) Software Engineer
2 68 (23.29%) Developer
3 64 (21.92%) Senior
4 57 (19.52%) DevOps Engineer
5 31 (10.62%) Lead
6 27 (9.25%) Senior Software Engineer
7 24 (8.22%) Azure Consultant
7 24 (8.22%) Cloud Consultant
7 24 (8.22%) Consultant
8 21 (7.19%) Full Stack Developer
8 21 (7.19%) Java Developer
9 19 (6.51%) Cloud Engineer
10 17 (5.82%) Senior Developer
11 16 (5.48%) AWS Engineer
12 15 (5.14%) AWS DevOps
12 15 (5.14%) AWS DevOps Engineer
13 14 (4.79%) Software Developer
14 12 (4.11%) Azure Engineer
15 11 (3.77%) Infrastructure Engineer
15 11 (3.77%) Security Engineer
Libraries, Frameworks & Software Standards
1 55 (18.84%) React
2 37 (12.67%) Node.js
3 30 (10.27%) .NET
4 29 (9.93%) Spring
5 27 (9.25%) AngularJS
6 25 (8.56%) HTML
6 25 (8.56%) Kafka
6 25 (8.56%) Spring Boot
7 21 (7.19%) Next.js
7 21 (7.19%) REST
8 16 (5.48%) Jest
9 13 (4.45%) CSS
9 13 (4.45%) RESTful
10 12 (4.11%) .NET Core
11 9 (3.08%) Vue
12 8 (2.74%) ASP.NET Web API
12 8 (2.74%) HTML5
12 8 (2.74%) JSON
13 7 (2.40%) jQuery
13 7 (2.40%) Web Services
Miscellaneous
1 29 (9.93%) Product Ownership
2 18 (6.16%) Public Cloud
3 14 (4.79%) Cloud Native
4 12 (4.11%) Enterprise Software
4 12 (4.11%) Private Cloud
5 9 (3.08%) Onboarding
6 8 (2.74%) Hybrid Cloud
7 7 (2.40%) Virtual Team
8 5 (1.71%) Data Protection Act
9 4 (1.37%) Data Centre
9 4 (1.37%) Greenfield Project
9 4 (1.37%) Online Banking
9 4 (1.37%) Robotics
9 4 (1.37%) Sports Betting
10 3 (1.03%) Distributed Systems
10 3 (1.03%) Mobile App
11 2 (0.68%) Cyber Threat
11 2 (0.68%) FPGA
11 2 (0.68%) Management Information System
11 2 (0.68%) Replication
Operating Systems
1 48 (16.44%) Linux
2 17 (5.82%) Windows
3 12 (4.11%) Unix
4 7 (2.40%) Red Hat Enterprise Linux
5 5 (1.71%) CentOS
6 3 (1.03%) Windows Server
7 1 (0.34%) CoreOS
7 1 (0.34%) zOS
Processes & Methodologies
1 163 (55.82%) DevOps
2 159 (54.45%) Agile
3 132 (45.21%) CI/CD
4 104 (35.62%) Software Engineering
5 76 (26.03%) Microservices
6 64 (21.92%) Containerisation
7 52 (17.81%) Infrastructure as Code
8 42 (14.38%) TDD
9 40 (13.70%) Customer Experience
10 37 (12.67%) Customer Requirements
10 37 (12.67%) Deployment Automation
11 35 (11.99%) Roadmaps
12 33 (11.30%) Mentoring
12 33 (11.30%) SDLC
13 32 (10.96%) Problem-Solving
14 31 (10.62%) Full Stack Development
15 29 (9.93%) Continuous Integration
15 29 (9.93%) Project Delivery
16 27 (9.25%) Actionable Insight
17 24 (8.22%) Unit Testing
Programming Languages
1 115 (39.38%) Python
2 111 (38.01%) Java
3 78 (26.71%) JavaScript
4 56 (19.18%) SQL
5 52 (17.81%) TypeScript
6 38 (13.01%) Bash
7 30 (10.27%) C++
8 28 (9.59%) PowerShell
9 20 (6.85%) C#
10 13 (4.45%) PHP
11 9 (3.08%) Go
12 6 (2.05%) Perl
13 5 (1.71%) Shell Script
14 3 (1.03%) Ruby
15 2 (0.68%) C
16 1 (0.34%) Groovy
16 1 (0.34%) XAML
Qualifications
1 58 (19.86%) Security Cleared
2 9 (3.08%) Degree
2 9 (3.08%) DV Cleared
3 8 (2.74%) AWS Certification
3 8 (2.74%) SC Cleared
4 6 (2.05%) Computer Science Degree
5 5 (1.71%) GIAC
5 5 (1.71%) RHCE
6 1 (0.34%) AWS Certified Cloud Practitioner
6 1 (0.34%) Azure Certification
6 1 (0.34%) BPSS Clearance
6 1 (0.34%) Chartered Engineer
Quality Assurance & Compliance
1 7 (2.40%) QA
2 2 (0.68%) ISO/IEC 27001
3 1 (0.34%) GDPR
3 1 (0.34%) ISO 22301
3 1 (0.34%) PCI DSS
System Software
1 10 (3.42%) VMware Infrastructure
2 7 (2.40%) Active Directory
2 7 (2.40%) Hyper-V
3 3 (1.03%) Citrix Hypervisor
3 3 (1.03%) LXC
4 2 (0.68%) Kamailio
4 2 (0.68%) OpenSIPS
5 1 (0.34%) Virtual Machines
Systems Management
1 207 (70.89%) Kubernetes
2 98 (33.56%) Terraform
3 39 (13.36%) Ansible
4 14 (4.79%) Puppet
5 8 (2.74%) Grafana
5 8 (2.74%) Prometheus
6 7 (2.40%) SCCM
7 5 (1.71%) Nagios
8 4 (1.37%) Istio
9 3 (1.03%) Cacti
9 3 (1.03%) MIIS
9 3 (1.03%) Progress Chef
9 3 (1.03%) ZABBIX
10 2 (0.68%) linkerd
10 2 (0.68%) Podman
11 1 (0.34%) FortiGate
11 1 (0.34%) HP Fortify
11 1 (0.34%) Kibana
11 1 (0.34%) logstash
11 1 (0.34%) Packer
Vendors
1 35 (11.99%) Microsoft
2 15 (5.14%) Red Hat
3 12 (4.11%) Google
4 10 (3.42%) VMware
5 8 (2.74%) Oracle
6 7 (2.40%) Confluent
7 6 (2.05%) IBM
8 4 (1.37%) Splunk
8 4 (1.37%) Veracode
9 3 (1.03%) Adobe
10 2 (0.68%) Atlassian
10 2 (0.68%) New Relic
11 1 (0.34%) AppDynamics
11 1 (0.34%) Cadence
11 1 (0.34%) Dynatrace
11 1 (0.34%) Hitachi
11 1 (0.34%) Salesforce