Linux Jobs in the North West

Linux
England > North West

The following table provides summary statistics for permanent job vacancies advertised in the North West with a requirement for Linux skills. Included is a benchmarking guide to the salaries offered in vacancies that have cited Linux over the 6 months to 30 November 2023 with a comparison to the same period in the previous 2 years.

6 months to
30 Nov 2023
Same period 2022 Same period 2021
Rank 38 67 36
Rank change year-on-year +29 -31 -10
Permanent jobs citing Linux 274 415 600
As % of all permanent jobs advertised in the North West 6.60% 4.61% 6.98%
As % of the Operating Systems category 44.19% 26.00% 37.90%
Number of salaries quoted 166 262 450
10th Percentile £38,084 £30,800 £32,500
25th Percentile £46,250 £41,750 £40,000
Median annual salary (50th Percentile) £60,000 £55,000 £50,000
Median % change year-on-year +9.09% +10.00% -
75th Percentile £69,800 £71,000 £65,000
90th Percentile £81,274 £87,375 £70,000
England median annual salary £60,000 £62,500 £60,000
% change year-on-year -4.00% +4.17% +9.09%

All Operating Systems
North West

Linux is in the Operating Systems category. The following table is for comparison with the above and provides summary statistics for all permanent job vacancies advertised in the North West with a requirement for operating system skills.

Permanent vacancies with a requirement for operating system skills 620 1,596 1,583
As % of all permanent jobs advertised in the North West 14.94% 17.73% 18.40%
Number of salaries quoted 448 901 1,248
10th Percentile £26,250 £23,500 £24,000
25th Percentile £31,250 £29,250 £31,000
Median annual salary (50th Percentile) £47,500 £42,500 £45,000
Median % change year-on-year +11.76% -5.56% -
75th Percentile £66,250 £60,000 £57,500
90th Percentile £74,300 £74,589 £70,000
England median annual salary £50,000 £52,500 £50,000
% change year-on-year -4.76% +5.00% -

Linux
Job Vacancy Trend in the North West

Job postings citing Linux as a proportion of all IT jobs advertised in the North West.
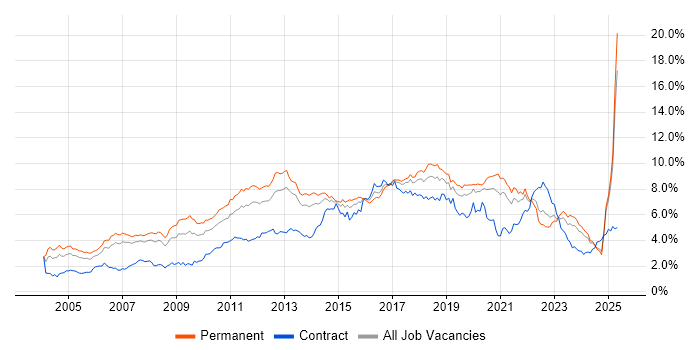
Job vacancy trend for Linux in the North West

Linux
Salary Trend in the North West

3-month moving average salary quoted in jobs citing Linux in the North West.

Salary trend for Linux in the North West

Linux
Salary Histogram in the North West

Salary distribution for jobs citing Linux in the North West over the 6 months to 30 November 2023.

Salary histogram for Linux in the North West

Linux
Job Locations in the North West

The table below looks at the demand and provides a guide to the median salaries quoted in IT jobs citing Linux within the North West region over the 6 months to 30 November 2023. The 'Rank Change' column provides an indication of the change in demand within each location based on the same 6 month period last year.

Location Rank Change
on Same Period
Last Year
Matching
Permanent
IT Job Ads
Median Salary
Past 6 Months
Median Salary
% Change
on Same Period
Last Year
Live
Jobs
Manchester +60 227 £60,375 +7.31% 73
Merseyside -1 30 £46,250 -21.28% 6
Lancashire +11 10 £57,500 -22.91% 14
Cheshire +11 3 £33,500 -33.00% 20
Cumbria -2 1 £32,760 -6.40% 5
Linux
England

Linux
Co-occurring Skills and Capabilities in the North West by Category

The follow tables expand on the table above by listing co-occurrences grouped by category. The same employment type, locality and period is covered with up to 20 co-occurrences shown in each of the following categories:

Application Platforms
1 9 (3.28%) Confluence
2 8 (2.92%) Apache
3 4 (1.46%) Captiva
3 4 (1.46%) FileNet
3 4 (1.46%) nginx
3 4 (1.46%) WebSphere
4 2 (0.73%) MS Exchange
5 1 (0.36%) IIS
5 1 (0.36%) Moodle
5 1 (0.36%) OpenStack
5 1 (0.36%) SharePoint
5 1 (0.36%) WebLogic
Applications
1 2 (0.73%) Microsoft Office
Business Applications
1 6 (2.19%) Exstream
Cloud Services
1 124 (45.26%) AWS
2 82 (29.93%) Azure
3 60 (21.90%) GCP
4 28 (10.22%) OpenShift
5 27 (9.85%) SaaS
5 27 (9.85%) Serverless
6 17 (6.20%) IaaS
6 17 (6.20%) Microsoft 365
6 17 (6.20%) PaaS
7 16 (5.84%) AWS CloudFormation
8 14 (5.11%) Amazon EC2
8 14 (5.11%) Amazon S3
9 13 (4.74%) GitHub
10 7 (2.55%) AWS Lambda
10 7 (2.55%) Cloud Computing
11 5 (1.82%) Entra ID
12 4 (1.46%) Azure DevOps
13 3 (1.09%) AWS CodePipeline
13 3 (1.09%) IBM Cloud
13 3 (1.09%) Power Platform
Communications & Networking
1 24 (8.76%) Firewall
2 16 (5.84%) DNS
3 15 (5.47%) Wireless
4 13 (4.74%) TCP/IP
5 12 (4.38%) SAN
6 10 (3.65%) DHCP
6 10 (3.65%) HTTP
6 10 (3.65%) Internet
7 9 (3.28%) VPN
8 8 (2.92%) VoIP
9 7 (2.55%) IPv4
9 7 (2.55%) Software-Defined Radio
9 7 (2.55%) VLAN
10 6 (2.19%) LAN
10 6 (2.19%) OSPF
11 5 (1.82%) F5 BIG-IP GTM
11 5 (1.82%) F5 BIG-IP LTM
12 4 (1.46%) FTP
12 4 (1.46%) Kerberos
12 4 (1.46%) WAN
Database & Business Intelligence
1 29 (10.58%) MySQL
2 25 (9.12%) PostgreSQL
3 20 (7.30%) Relational Database
4 13 (4.74%) Amazon RDS
4 13 (4.74%) Redis
5 11 (4.01%) RDBMS
6 7 (2.55%) MariaDB
6 7 (2.55%) OLTP
7 5 (1.82%) NoSQL
7 5 (1.82%) SQL Server
8 4 (1.46%) MongoDB
9 3 (1.09%) Firebird
9 3 (1.09%) InfluxDB
9 3 (1.09%) Oracle Database
10 2 (0.73%) Big Data
10 2 (0.73%) BigQuery
10 2 (0.73%) Data Lake
10 2 (0.73%) Elasticsearch
10 2 (0.73%) Geospatial Data
10 2 (0.73%) Power BI
Development Applications
1 21 (7.66%) Git
2 19 (6.93%) Jenkins
3 15 (5.47%) JIRA
4 11 (4.01%) GitLab
5 4 (1.46%) GDB
5 4 (1.46%) Maven
5 4 (1.46%) Oracle Forms
6 3 (1.09%) SonarQube
6 3 (1.09%) Vagrant
7 2 (0.73%) Bitbucket
7 2 (0.73%) CMake
7 2 (0.73%) IBM UrbanCode
7 2 (0.73%) Selenium
8 1 (0.36%) Eclipse
8 1 (0.36%) GCC
8 1 (0.36%) GoogleTest
8 1 (0.36%) Octopus Deploy
8 1 (0.36%) Oracle APEX
8 1 (0.36%) SoapUI
8 1 (0.36%) TeamCity
General
1 89 (32.48%) Social Skills
2 43 (15.69%) Finance
3 28 (10.22%) Analytical Skills
4 25 (9.12%) Inclusion and Diversity
5 21 (7.66%) Banking
6 15 (5.47%) Presentation Skills
7 13 (4.74%) Aerospace
8 11 (4.01%) Games
8 11 (4.01%) Retail
9 10 (3.65%) Organisational Skills
10 8 (2.92%) Law
10 8 (2.92%) Public Sector
11 5 (1.82%) Electronics
11 5 (1.82%) Manufacturing
11 5 (1.82%) Marketing
11 5 (1.82%) Telecoms
12 3 (1.09%) Automotive
13 2 (0.73%) Documentation Skills
13 2 (0.73%) Russian Language
14 1 (0.36%) Public Speaking
Job Titles
1 52 (18.98%) Developer
2 50 (18.25%) Senior
3 43 (15.69%) Software Engineer
4 29 (10.58%) Architect
5 27 (9.85%) DevOps Engineer
6 24 (8.76%) Lead
7 21 (7.66%) Software Developer
8 19 (6.93%) Infrastructure Architect
8 19 (6.93%) Infrastructure Engineer
9 17 (6.20%) Administrator
9 17 (6.20%) Senior Software Engineer
10 13 (4.74%) Systems Administrator
11 12 (4.38%) Cloud Engineer
11 12 (4.38%) DBA
12 11 (4.01%) DV Cleared Software Engineer
12 11 (4.01%) MySQL DBA
13 9 (3.28%) AWS Engineer
14 8 (2.92%) Ruby on Rails Developer
14 8 (2.92%) Senior DevOps
14 8 (2.92%) Senior DevOps Engineer
Libraries, Frameworks & Software Standards
1 43 (15.69%) Node.js
2 28 (10.22%) .NET
3 17 (6.20%) XML
4 16 (5.84%) React
5 14 (5.11%) HTML
6 13 (4.74%) Spring
7 12 (4.38%) JSON
8 11 (4.01%) CSS
9 10 (3.65%) REST
9 10 (3.65%) Spring Boot
10 8 (2.92%) AngularJS
10 8 (2.92%) EDI
10 8 (2.92%) Memcached
10 8 (2.92%) Ruby on Rails
10 8 (2.92%) Sidekiq
11 6 (2.19%) Django
11 6 (2.19%) LAMP
11 6 (2.19%) OpenGL
11 6 (2.19%) Vulkan
12 5 (1.82%) WebAssembly
Miscellaneous
1 27 (9.85%) Self-Motivation
2 26 (9.49%) Linux Command Line
3 25 (9.12%) Cyberattack
4 24 (8.76%) Data Centre
5 19 (6.93%) Public Cloud
6 18 (6.57%) Private Cloud
7 12 (4.38%) Cloud Native
7 12 (4.38%) Replication
8 11 (4.01%) Embedded Systems
9 9 (3.28%) Distributed Systems
9 9 (3.28%) FPGA
9 9 (3.28%) Hybrid Cloud
9 9 (3.28%) Mainframe
10 8 (2.92%) Algorithms
10 8 (2.92%) Management Information System
10 8 (2.92%) Virtual Team
11 7 (2.55%) VHDL
12 6 (2.19%) Mali
12 6 (2.19%) Smartphone
13 5 (1.82%) Ray Tracing
Operating Systems
1 88 (32.12%) Windows
2 49 (17.88%) Unix
3 17 (6.20%) Red Hat Enterprise Linux
4 14 (5.11%) Android
4 14 (5.11%) CentOS
5 11 (4.01%) Mac OS
5 11 (4.01%) Solaris
6 10 (3.65%) Ubuntu
6 10 (3.65%) Windows Server
7 6 (2.19%) HPUX
8 4 (1.46%) Debian
9 2 (0.73%) Apple iOS
9 2 (0.73%) VMS
9 2 (0.73%) Windows Server 2016
9 2 (0.73%) Windows Server 2019
10 1 (0.36%) CoreOS
10 1 (0.36%) Mac OS X
10 1 (0.36%) SUSE
10 1 (0.36%) Windows Server 2012
10 1 (0.36%) zOS
Processes & Methodologies
1 107 (39.05%) Agile
2 83 (30.29%) Software Engineering
3 60 (21.90%) DevOps
4 54 (19.71%) CI/CD
5 49 (17.88%) Mentoring
6 48 (17.52%) Microservices
7 41 (14.96%) Scrum
8 40 (14.60%) Containerisation
9 39 (14.23%) Actionable Insight
9 39 (14.23%) Infrastructure as Code
10 31 (11.31%) Problem-Solving
11 29 (10.58%) Configuration Management
11 29 (10.58%) Machine Learning
12 28 (10.22%) User Experience
13 27 (9.85%) Site Reliability Engineering
14 25 (9.12%) Software Delivery
15 23 (8.39%) Data Engineering
16 22 (8.03%) Design Patterns
17 20 (7.30%) Cybersecurity
17 20 (7.30%) Project Management
Programming Languages
1 132 (48.18%) Python
2 92 (33.58%) Java
3 60 (21.90%) JavaScript
4 44 (16.06%) C++
5 39 (14.23%) Bash
6 35 (12.77%) Go
7 32 (11.68%) Rust
8 26 (9.49%) PowerShell
9 25 (9.12%) C
10 22 (8.03%) SQL
11 15 (5.47%) C#
11 15 (5.47%) PHP
11 15 (5.47%) Ruby
12 13 (4.74%) TypeScript
13 10 (3.65%) Perl
14 7 (2.55%) MATLAB
15 6 (2.19%) Shell Script
16 3 (1.09%) F#
16 3 (1.09%) Haskell
16 3 (1.09%) Scala
Qualifications
1 82 (29.93%) Security Cleared
2 46 (16.79%) DV Cleared
3 28 (10.22%) AWS Certification
3 28 (10.22%) SC Cleared
4 27 (9.85%) Degree
5 24 (8.76%) AWS Certified Cloud Practitioner
6 23 (8.39%) AWS Certified Developer
6 23 (8.39%) AWS Certified Solutions Architect
7 7 (2.55%) GIAC
7 7 (2.55%) PhD
7 7 (2.55%) RHCE
8 6 (2.19%) Computer Science Degree
9 2 (0.73%) Azure Certification
9 2 (0.73%) CEH
9 2 (0.73%) Cisco Certification
9 2 (0.73%) CISM
9 2 (0.73%) CISSP
9 2 (0.73%) ISACA
9 2 (0.73%) Microsoft Certification
10 1 (0.36%) CCNP
Quality Assurance & Compliance
1 21 (7.66%) QA
2 6 (2.19%) ISO/IEC 27001
3 4 (1.46%) GDPR
4 3 (1.09%) NIST
5 2 (0.73%) Cyber Essentials
5 2 (0.73%) PCI DSS
6 1 (0.36%) GRC
6 1 (0.36%) NCSC
6 1 (0.36%) SLA
System Software
1 52 (18.98%) Docker
2 21 (7.66%) VMware Infrastructure
3 20 (7.30%) Active Directory
4 8 (2.92%) Hyper-V
5 6 (2.19%) Firmware
6 5 (1.82%) LXC
7 4 (1.46%) Kamailio
8 3 (1.09%) Citrix Hypervisor
8 3 (1.09%) NFS
8 3 (1.09%) Slurm Workload Manager
9 2 (0.73%) GPFS
9 2 (0.73%) Lustre
9 2 (0.73%) Microsoft Virtual Server
9 2 (0.73%) OpenSIPS
9 2 (0.73%) Virtual Servers
9 2 (0.73%) XenApp
9 2 (0.73%) XenDesktop
10 1 (0.36%) Embedded Firmware
10 1 (0.36%) KVM
10 1 (0.36%) vSphere
Systems Management
1 63 (22.99%) Ansible
2 55 (20.07%) Terraform
3 42 (15.33%) Kubernetes
4 26 (9.49%) Puppet
5 9 (3.28%) Nagios
6 7 (2.55%) Progress Chef
7 5 (1.82%) Grafana
8 4 (1.46%) EMC NetWorker
8 4 (1.46%) Prometheus
8 4 (1.46%) SCCM
8 4 (1.46%) SCOM
8 4 (1.46%) ZABBIX
9 3 (1.09%) Cacti
9 3 (1.09%) Ganglia
9 3 (1.09%) Microsoft Intune
10 2 (0.73%) CASB
10 2 (0.73%) Docker Swarm
10 2 (0.73%) systemd
11 1 (0.36%) Active Directory Federation Services
11 1 (0.36%) Packer
Vendors
1 28 (10.22%) Oracle
2 27 (9.85%) Red Hat
3 26 (9.49%) VMware
4 23 (8.39%) Microsoft
5 14 (5.11%) IBM
6 11 (4.01%) Google
7 10 (3.65%) Cisco
8 9 (3.28%) ServiceNow
9 7 (2.55%) Splunk
10 6 (2.19%) HP
10 6 (2.19%) OpenText
10 6 (2.19%) Sun
10 6 (2.19%) Unisys
11 5 (1.82%) CheckPoint
11 5 (1.82%) EMC
11 5 (1.82%) F5
11 5 (1.82%) Fortinet
11 5 (1.82%) Juniper
12 4 (1.46%) Isilon
12 4 (1.46%) Kofax