Confluence
UK

The following table provides summary statistics for permanent job vacancies with a requirement for Confluence skills. Included is a benchmarking guide to the salaries offered in vacancies that have cited Confluence over the 6 months to 10 December 2023 with a comparison to the same period in the previous 2 years.

6 months to
10 Dec 2023
Same period 2022 Same period 2021
Rank 240 206 233
Rank change year-on-year -34 +27 -13
Permanent jobs citing Confluence 745 2,333 2,015
As % of all permanent jobs advertised in the UK 1.43% 1.91% 1.59%
As % of the Application Platforms category 14.29% 16.36% 12.73%
Number of salaries quoted 589 1,331 1,343
10th Percentile £38,750 £41,227 £37,500
25th Percentile £51,000 £50,000 £45,000
Median annual salary (50th Percentile) £67,500 £62,500 £60,000
Median % change year-on-year +8.00% +4.17% -
75th Percentile £87,500 £80,625 £73,750
90th Percentile £97,500 £100,000 £88,750
UK excluding London median annual salary £65,000 £57,500 £55,000
% change year-on-year +13.04% +4.55% -

All Application Platform Skills
UK

Confluence is in the Application Platforms category. The following table is for comparison with the above and provides summary statistics for all permanent job vacancies with a requirement for application platform skills.

Permanent vacancies with a requirement for application platform skills 5,213 14,258 15,833
As % of all permanent jobs advertised in the UK 9.97% 11.67% 12.46%
Number of salaries quoted 3,883 8,496 10,303
10th Percentile £31,500 £31,250 £30,000
25th Percentile £40,500 £41,250 £37,750
Median annual salary (50th Percentile) £55,000 £57,500 £55,000
Median % change year-on-year -4.35% +4.55% +4.76%
75th Percentile £77,500 £78,750 £72,500
90th Percentile £95,000 £97,270 £90,000
UK excluding London median annual salary £49,944 £50,000 £45,369
% change year-on-year -0.11% +10.21% +0.82%

Confluence
Job Vacancy Trend

Job postings citing Confluence as a proportion of all IT jobs advertised.
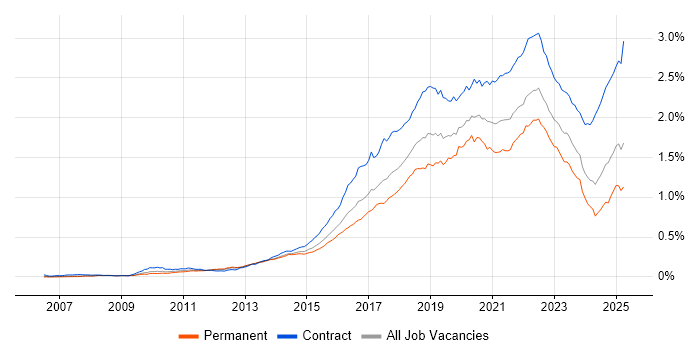
Job vacancy trend for Confluence in the UK

Confluence
Salary Trend

3-month moving average salary quoted in jobs citing Confluence.

Salary trend for Confluence in the UK

Confluence
Salary Histogram

Salary distribution for jobs citing Confluence over the 6 months to 10 December 2023.

Salary histogram for Confluence in the UK

Confluence
Top 17 Job Locations

The table below looks at the demand and provides a guide to the median salaries quoted in IT jobs citing Confluence within the UK over the 6 months to 10 December 2023. The 'Rank Change' column provides an indication of the change in demand within each location based on the same 6 month period last year.

Location Rank Change
on Same Period
Last Year
Matching
Permanent
IT Job Ads
Median Salary
Past 6 Months
Median Salary
% Change
on Same Period
Last Year
Live
Jobs
England -44 610 £69,447 +11.12% 265
UK excluding London -33 383 £65,000 +13.04% 185
Work from Home -45 317 £70,000 +7.69% 124
London -59 265 £75,000 +7.14% 102
South West +58 88 £44,033 -11.94% 32
North of England -14 77 £70,011 +16.69% 40
Scotland -28 71 £65,000 +8.33% 15
South East +35 66 £67,500 +8.00% 66
Midlands -25 64 £65,000 +18.18% 17
West Midlands -16 42 £80,000 +45.45% 14
Yorkshire +7 39 £70,576 +10.22% 14
North West +21 38 £68,000 +23.64% 20
East of England +96 29 £65,000 +19.27% 12
East Midlands +39 19 £65,000 +23.81% 3
Wales +5 9 £70,576 +17.63% 4
North East +40 7 £85,000 +6.25% 6
Northern Ireland +20 2 £85,000 +54.55% 2

Confluence
Co-occurring Skills and Capabilities by Category

The follow tables expand on the table above by listing co-occurrences grouped by category. The same employment type, locality and period is covered with up to 20 co-occurrences shown in each of the following categories:

Application Platforms
1 45 (6.04%) SharePoint
2 15 (2.01%) Tomcat
3 10 (1.34%) WordPress
4 7 (0.94%) Adobe Experience Manager
4 7 (0.94%) OpenStack
5 6 (0.81%) IIS
6 5 (0.67%) SAS
6 5 (0.67%) WebSphere
6 5 (0.67%) WebSphere Application Server
7 4 (0.54%) Cloud Foundry
7 4 (0.54%) CMS
7 4 (0.54%) Headless CMS
7 4 (0.54%) nginx
7 4 (0.54%) Red Hat Fuse
8 3 (0.40%) Apache Spark
9 2 (0.27%) Apache Airflow
9 2 (0.27%) JBoss
10 1 (0.13%) Apache
10 1 (0.13%) MS Exchange
10 1 (0.13%) WebLogic
Applications
1 45 (6.04%) Microsoft Excel
2 27 (3.62%) Microsoft Office
2 27 (3.62%) Microsoft PowerPoint
3 22 (2.95%) MS Visio
4 13 (1.74%) Trello
5 9 (1.21%) Microsoft Project
6 3 (0.40%) FileZilla
7 2 (0.27%) InVision
7 2 (0.27%) Simulink
7 2 (0.27%) Sketch
8 1 (0.13%) SOLIDWORKS
8 1 (0.13%) Stateflow
Business Applications
1 4 (0.54%) Magento
2 2 (0.27%) Remedy ITSM
2 2 (0.27%) SAP CRM
2 2 (0.27%) Shopify
3 1 (0.13%) Aladdin
3 1 (0.13%) Endur
3 1 (0.13%) FIS Private Capital Suite
3 1 (0.13%) Infor SunSystems
3 1 (0.13%) Oracle EBS
3 1 (0.13%) Oracle Payables
3 1 (0.13%) Oracle Receivables
3 1 (0.13%) Primavera
3 1 (0.13%) Salerio
3 1 (0.13%) Salesforce CRM
3 1 (0.13%) SAP Business One
3 1 (0.13%) SAP Hybris
3 1 (0.13%) Softmar
3 1 (0.13%) Teamcenter
Cloud Services
1 141 (18.93%) Azure
2 125 (16.78%) AWS
3 55 (7.38%) GitHub
4 53 (7.11%) Azure DevOps
5 45 (6.04%) GCP
6 42 (5.64%) Power Platform
6 42 (5.64%) Serverless
7 33 (4.43%) AWS Lambda
8 29 (3.89%) Amazon SQS
8 29 (3.89%) FinancialForce
9 27 (3.62%) OpenShift
10 20 (2.68%) BlazeMeter
11 17 (2.28%) Microsoft 365
12 15 (2.01%) Amazon CloudWatch
12 15 (2.01%) SaaS
13 13 (1.74%) AWS CodeCommit
13 13 (1.74%) CloudFront
13 13 (1.74%) Slack
14 12 (1.61%) Amazon Cognito
14 12 (1.61%) Amazon EC2
Communications & Networking
1 62 (8.32%) Firewall
2 29 (3.89%) DNS
3 28 (3.76%) F5 BIG-IP GTM
3 28 (3.76%) F5 BIG-IP LTM
4 23 (3.09%) TCP/IP
5 17 (2.28%) MPLS
6 13 (1.74%) SSL
7 12 (1.61%) AMQP
7 12 (1.61%) Ethernet VPN
7 12 (1.61%) VXLAN
8 11 (1.48%) Cisco Nexus
9 10 (1.34%) PBX
10 9 (1.21%) BGP
10 9 (1.21%) HTTP
10 9 (1.21%) OSPF
11 8 (1.07%) Internet
11 8 (1.07%) Network Security
12 7 (0.94%) FabricPath
12 7 (0.94%) WAN
13 6 (0.81%) Intrusion Detection
Database & Business Intelligence
1 76 (10.20%) SQL Server
2 53 (7.11%) MySQL
3 43 (5.77%) Data Warehouse
4 41 (5.50%) Power BI
5 35 (4.70%) PostgreSQL
6 26 (3.49%) MongoDB
7 23 (3.09%) Oracle Database
8 21 (2.82%) Relational Database
9 20 (2.68%) Oracle Database 10g
9 20 (2.68%) Oracle Database 11g
10 17 (2.28%) NoSQL
11 16 (2.15%) DynamoDB
12 11 (1.48%) Data Lake
13 7 (0.94%) SQL Server Integration Services
14 6 (0.81%) Azure SQL Database
14 6 (0.81%) Metadata
14 6 (0.81%) SQL Server Analysis Services
15 5 (0.67%) Amazon RDS
15 5 (0.67%) Elasticsearch
16 4 (0.54%) Tableau
Development Applications
1 691 (92.75%) JIRA
2 179 (24.03%) Git
3 108 (14.50%) Jenkins
4 105 (14.09%) Bitbucket
5 45 (6.04%) Visual Studio
6 41 (5.50%) GitLab
6 41 (5.50%) Postman
7 38 (5.10%) Atlassian Bamboo
7 38 (5.10%) Cucumber
8 32 (4.30%) Selenium
9 25 (3.36%) Artifactory
9 25 (3.36%) SoapUI
10 24 (3.22%) LoadRunner
11 23 (3.09%) Sonatype Nexus
12 21 (2.82%) JMeter
12 21 (2.82%) Maven
12 21 (2.82%) REST Assured
13 20 (2.68%) eggPlant
13 20 (2.68%) Liquibase
13 20 (2.68%) The Grinder
General
1 293 (39.33%) Finance
2 193 (25.91%) Social Skills
3 121 (16.24%) Analytical Skills
3 121 (16.24%) Banking
4 63 (8.46%) Retail
5 43 (5.77%) Inclusion and Diversity
6 40 (5.37%) Games
7 39 (5.23%) Presentation Skills
8 32 (4.30%) Manufacturing
8 32 (4.30%) Public Sector
9 20 (2.68%) Marketing
10 17 (2.28%) Influencing Skills
11 13 (1.74%) Law
12 12 (1.61%) Police
13 11 (1.48%) Legal
14 10 (1.34%) Telecoms
15 5 (0.67%) Advertising
15 5 (0.67%) Electronics
15 5 (0.67%) Investment Banking
15 5 (0.67%) Pharmaceutical
Job Titles
1 159 (21.34%) Senior
2 140 (18.79%) Developer
3 96 (12.89%) Analyst
4 92 (12.35%) Lead
5 80 (10.74%) DevOps Engineer
6 54 (7.25%) Senior Developer
7 50 (6.71%) Business Analyst
8 42 (5.64%) Software Engineer
9 31 (4.16%) Senior DevOps
9 31 (4.16%) Senior DevOps Engineer
10 30 (4.03%) Support Engineer
11 29 (3.89%) 3D Developer
11 29 (3.89%) Games Developer
11 29 (3.89%) Project Manager
11 29 (3.89%) Systems Engineer
11 29 (3.89%) Unity 3D Developer
12 28 (3.76%) Cisco Engineer
12 28 (3.76%) Senior Cisco Engineer
13 25 (3.36%) .NET Developer
13 25 (3.36%) Test Engineer
Libraries, Frameworks & Software Standards
1 70 (9.40%) .NET
2 60 (8.05%) RESTful
3 46 (6.17%) HTML
4 43 (5.77%) CSS
5 40 (5.37%) React
6 37 (4.97%) REST
7 35 (4.70%) Gherkin
8 33 (4.43%) Kafka
9 31 (4.16%) JSON
10 29 (3.89%) Unity (Game Engine)
10 29 (3.89%) XML
11 28 (3.76%) Spine.js
12 26 (3.49%) AngularJS
12 26 (3.49%) Middleware
13 25 (3.36%) .NET Framework
14 24 (3.22%) Node.js
14 24 (3.22%) Spring
14 24 (3.22%) Web Services
15 22 (2.95%) Swagger
16 20 (2.68%) GraphQL
Miscellaneous
1 70 (9.40%) Product Ownership
2 63 (8.46%) Cloud Native
3 51 (6.85%) Enterprise Software
4 45 (6.04%) Data Centre
5 38 (5.10%) Self-Motivation
6 29 (3.89%) Public Cloud
6 29 (3.89%) Virtual Reality
7 19 (2.55%) Mobile App
7 19 (2.55%) Onboarding
8 13 (1.74%) Greenfield Project
9 10 (1.34%) Derivative
10 9 (1.21%) IoT
11 8 (1.07%) Distributed Systems
12 7 (0.94%) Management Information System
12 7 (0.94%) Market Risk
12 7 (0.94%) Virtual Team
13 6 (0.81%) Legacy Systems
14 5 (0.67%) Hedge funds
14 5 (0.67%) Online Banking
14 5 (0.67%) Online Games
Operating Systems
1 131 (17.58%) Linux
2 72 (9.66%) Unix
3 51 (6.85%) Windows
4 18 (2.42%) Solaris
5 14 (1.88%) Android
5 14 (1.88%) Mac OS
6 12 (1.61%) Red Hat Enterprise Linux
7 11 (1.48%) AIX
7 11 (1.48%) Fedora
7 11 (1.48%) HPUX
8 10 (1.34%) Apple iOS
9 5 (0.67%) Ubuntu
10 4 (0.54%) Mac OS X
10 4 (0.54%) Windows Server
11 3 (0.40%) Windows 10
12 2 (0.27%) Debian
13 1 (0.13%) CentOS
13 1 (0.13%) Embedded Linux
13 1 (0.13%) Windows Server 2012
13 1 (0.13%) Windows Server 2016
Processes & Methodologies
1 459 (61.61%) Agile
2 241 (32.35%) DevOps
3 170 (22.82%) CI/CD
4 167 (22.42%) Scrum
5 140 (18.79%) Problem-Solving
6 129 (17.32%) Software Engineering
7 122 (16.38%) Mentoring
8 103 (13.83%) Test Automation
9 89 (11.95%) Project Management
10 86 (11.54%) SDLC
11 77 (10.34%) Infrastructure as Code
12 73 (9.80%) ITIL
12 73 (9.80%) Project Delivery
13 69 (9.26%) Microservices
14 68 (9.13%) Migration
15 64 (8.59%) DevSecOps
16 61 (8.19%) Kanban
17 58 (7.79%) Design Patterns
18 57 (7.65%) Business Analysis
19 56 (7.52%) Stakeholder Management
Programming Languages
1 174 (23.36%) Python
2 121 (16.24%) C#
2 121 (16.24%) SQL
3 120 (16.11%) Java
4 77 (10.34%) JavaScript
5 62 (8.32%) PowerShell
6 56 (7.52%) Bash
7 35 (4.70%) C++
8 28 (3.76%) C
9 25 (3.36%) TypeScript
10 18 (2.42%) PHP
11 17 (2.28%) Groovy
12 16 (2.15%) T-SQL
13 13 (1.74%) Perl
14 12 (1.61%) Tcl
15 9 (1.21%) VBA
16 8 (1.07%) VBScript
17 6 (0.81%) Swift
18 5 (0.67%) Go
19 4 (0.54%) Scala
Qualifications
1 124 (16.64%) Degree
2 77 (10.34%) Security Cleared
3 60 (8.05%) SC Cleared
4 41 (5.50%) BPSS Clearance
5 36 (4.83%) Computer Science Degree
6 20 (2.68%) Cisco Certification
7 15 (2.01%) CCNA
8 11 (1.48%) ISTQB
9 10 (1.34%) ITIL Certification
9 10 (1.34%) Master's Degree
10 9 (1.21%) ISTQB Foundation Certification
11 7 (0.94%) ISEB
12 6 (0.81%) CCNP
12 6 (0.81%) DV Cleared
12 6 (0.81%) PMI Certification
12 6 (0.81%) SAFe Agilist
13 5 (0.67%) CCIE
13 5 (0.67%) CSPO
14 4 (0.54%) DBS Check
14 4 (0.54%) PMP
Quality Assurance & Compliance
1 71 (9.53%) QA
2 34 (4.56%) NIST
3 29 (3.89%) ISO/IEC 15288
4 20 (2.68%) Data Quality
5 14 (1.88%) Accessibility
6 9 (1.21%) GDPR
6 9 (1.21%) ISO/IEC 27001
7 8 (1.07%) COBIT
7 8 (1.07%) PMO
7 8 (1.07%) SLA
8 6 (0.81%) ISO/IEC 20000
9 4 (0.54%) Cyber Essentials
9 4 (0.54%) WCAG
10 2 (0.27%) Government Security Classifications
10 2 (0.27%) NCSC
10 2 (0.27%) PSD2
10 2 (0.27%) Software Quality Assurance
11 1 (0.13%) ISO 13485
11 1 (0.13%) ISO 26262
11 1 (0.13%) MISRA
System Software
1 50 (6.71%) Docker
2 14 (1.88%) Active Directory
3 11 (1.48%) VMware ESXi
4 9 (1.21%) VMware Infrastructure
5 2 (0.27%) IAG
5 2 (0.27%) vSphere
6 1 (0.13%) Apache ZooKeeper
6 1 (0.13%) Ceph
6 1 (0.13%) Gluster
6 1 (0.13%) iptables
6 1 (0.13%) Virtual Machines
Systems Management
1 84 (11.28%) Ansible
2 65 (8.72%) Terraform
3 50 (6.71%) Kubernetes
4 18 (2.42%) HP Quality Center
5 12 (1.61%) Puppet
6 7 (0.94%) FortiGate
7 6 (0.81%) Progress Chef
8 5 (0.67%) Grafana
8 5 (0.67%) Packer
9 4 (0.54%) Jamf Pro
9 4 (0.54%) Salt
9 4 (0.54%) Single Sign-On
9 4 (0.54%) vRealize
9 4 (0.54%) vRealize Orchestrator
9 4 (0.54%) ZABBIX
10 3 (0.40%) Iperf
10 3 (0.40%) Kibana
11 2 (0.27%) Check_MK
11 2 (0.27%) HAProxy
11 2 (0.27%) Rancher
Vendors
1 155 (20.81%) Atlassian
2 127 (17.05%) Microsoft
3 63 (8.46%) ServiceNow
4 49 (6.58%) Salesforce
5 44 (5.91%) Cisco
6 41 (5.50%) Oracle
7 38 (5.10%) Google
8 30 (4.03%) CyberArk
8 30 (4.03%) F5
9 29 (3.89%) HubSpot
9 29 (3.89%) Pardot
9 29 (3.89%) Sage
10 28 (3.76%) CheckPoint
10 28 (3.76%) Fortinet
11 27 (3.62%) Splunk
12 25 (3.36%) HP
12 25 (3.36%) Red Hat
12 25 (3.36%) VMware
13 20 (2.68%) TOWER Software
14 17 (2.28%) Palo Alto