Azure Jobs in Yorkshire

Microsoft Azure
England > Yorkshire

The table below provides summary statistics for permanent job vacancies advertised in Yorkshire requiring Azure skills. It includes a benchmarking guide to the annual salaries offered in vacancies that cited Azure over the 6 months leading up to 1 April 2025, comparing them to the same period in the previous two years.

6 months to
1 Apr 2025
Same period 2024 Same period 2023
Rank 13 3 3
Rank change year-on-year -10 0 +1
Permanent jobs citing Azure 320 1,032 2,144
As % of all permanent jobs advertised in Yorkshire 12.91% 18.67% 25.32%
As % of the Cloud Services category 39.31% 50.54% 56.84%
Number of salaries quoted 278 869 1,157
10th Percentile £31,250 £31,125 £35,000
25th Percentile £38,563 £41,250 £42,500
Median annual salary (50th Percentile) £51,473 £55,000 £57,810
Median % change year-on-year -6.41% -4.86% +7.06%
75th Percentile £70,000 £69,500 £77,500
90th Percentile £80,750 £81,357 £90,000
England median annual salary £63,000 £60,000 £65,000
% change year-on-year +5.00% -7.69% +4.00%

All Cloud Skills
Yorkshire

Azure falls under the Cloud Services category. For comparison with the information above, the following table provides summary statistics for all permanent job vacancies requiring cloud computing skills in Yorkshire.

Permanent vacancies with a requirement for cloud computing skills 814 2,042 3,772
As % of all permanent jobs advertised in Yorkshire 32.85% 36.93% 44.55%
Number of salaries quoted 619 1,679 1,897
10th Percentile £29,000 £27,500 £31,250
25th Percentile £37,500 £36,250 £41,250
Median annual salary (50th Percentile) £52,500 £52,500 £55,000
Median % change year-on-year - -4.55% +1.85%
75th Percentile £73,886 £69,125 £72,500
90th Percentile £90,822 £82,548 £87,500
England median annual salary £62,500 £57,500 £65,000
% change year-on-year +8.70% -11.54% +4.00%

Azure
Job Vacancy Trend in Yorkshire

Job postings citing Azure as a proportion of all IT jobs advertised in Yorkshire.
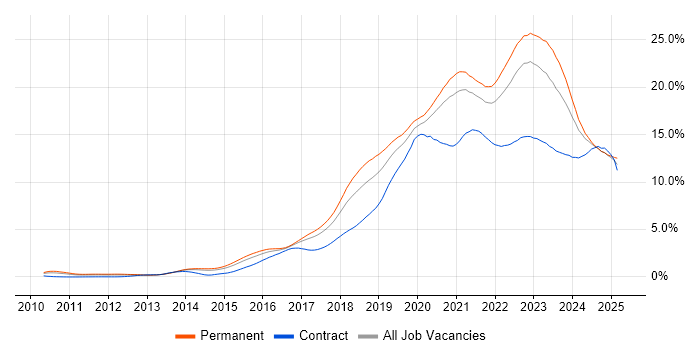
Job vacancy trend for Azure in Yorkshire

Azure
Salary Trend in Yorkshire

3-month moving average salary quoted in jobs citing Azure in Yorkshire.

Salary trend for Azure in Yorkshire

Azure
Salary Histogram in Yorkshire

Salary distribution for jobs citing Azure in Yorkshire over the 6 months to 1 April 2025.

Salary histogram for Azure in Yorkshire

Azure
Job Locations in Yorkshire

The table below looks at the demand and provides a guide to the median salaries quoted in IT jobs citing Azure within the Yorkshire region over the 6 months to 1 April 2025. The 'Rank Change' column provides an indication of the change in demand within each location based on the same 6 month period last year.

Location Rank Change
on Same Period
Last Year
Matching
Permanent
IT Job Ads
Median Salary
Past 6 Months
Median Salary
% Change
on Same Period
Last Year
Live
Jobs
West Yorkshire -6 177 £52,750 -6.64% 126
South Yorkshire 0 62 £61,500 +29.47% 51
North Yorkshire -13 58 £45,000 -14.29% 38
East Yorkshire +1 8 £45,000 +12.50% 6
Azure
England

Azure
Co-occurring Skills and Capabilities in Yorkshire by Category

The follow tables expand on the table above by listing co-occurrences grouped by category. The same employment type, locality and period is covered with up to 20 co-occurrences shown in each of the following categories:

Application Platforms
1 15 (4.69%) Microsoft Exchange
2 13 (4.06%) Confluence
3 9 (2.81%) SharePoint
4 5 (1.56%) IIS
5 2 (0.63%) Apache
5 2 (0.63%) Apache Spark
5 2 (0.63%) Tomcat
5 2 (0.63%) WebSphere
5 2 (0.63%) WebSphere Application Server
6 1 (0.31%) CICS
6 1 (0.31%) Cloud Foundry
6 1 (0.31%) OpenStack
Applications
1 11 (3.44%) Microsoft Excel
1 11 (3.44%) Microsoft PowerPoint
2 8 (2.50%) Microsoft Office
3 3 (0.94%) Chatbot
4 2 (0.63%) Microsoft Project
4 2 (0.63%) MS Visio
Business Applications
1 1 (0.31%) Dynamics CRM
1 1 (0.31%) GoldMine
1 1 (0.31%) Sparx Enterprise Architect
Cloud Services
1 82 (25.63%) AWS
2 62 (19.38%) GCP
3 58 (18.13%) Microsoft 365
4 43 (13.44%) Azure DevOps
5 38 (11.88%) Entra ID
6 34 (10.63%) GitHub
7 32 (10.00%) Power Platform
8 21 (6.56%) SaaS
9 20 (6.25%) Azure Data Factory
10 19 (5.94%) Power Automate
11 17 (5.31%) Serverless
12 14 (4.38%) PowerApps
13 13 (4.06%) Dynamics 365
14 12 (3.75%) Azure Logic Apps
15 10 (3.13%) Azure AKS
15 10 (3.13%) Azure Functions
16 9 (2.81%) Azure Synapse Analytics
16 9 (2.81%) PaaS
17 7 (2.19%) Azure Cosmos DB
17 7 (2.19%) Snowflake
Communications & Networking
1 48 (15.00%) Firewall
2 29 (9.06%) LAN
3 24 (7.50%) WAN
4 19 (5.94%) VPN
5 18 (5.63%) DNS
5 18 (5.63%) TCP/IP
6 15 (4.69%) SD-WAN
7 13 (4.06%) DHCP
8 12 (3.75%) SAN
9 9 (2.81%) BGP
9 9 (2.81%) Network Security
9 9 (2.81%) OSPF
10 8 (2.50%) Multicast
10 8 (2.50%) Wi-Fi
10 8 (2.50%) Wireless
11 7 (2.19%) MPLS
12 5 (1.56%) DAB
12 5 (1.56%) NAS
12 5 (1.56%) WebEx
13 4 (1.25%) Intrusion Detection
Database & Business Intelligence
1 65 (20.31%) SQL Server
2 24 (7.50%) MySQL
3 23 (7.19%) Power BI
4 16 (5.00%) Relational Database
5 15 (4.69%) Data Warehouse
6 14 (4.38%) NoSQL
7 13 (4.06%) MongoDB
8 10 (3.13%) PostgreSQL
9 8 (2.50%) Amazon Redshift
9 8 (2.50%) RDBMS
10 7 (2.19%) BigQuery
10 7 (2.19%) DB2
10 7 (2.19%) SQL Server Reporting Services
11 6 (1.88%) Azure SQL Database
12 5 (1.56%) SQL Server Integration Services
13 4 (1.25%) Microsoft Analysis Services
13 4 (1.25%) Oracle Database
13 4 (1.25%) SQL Server Analysis Services
13 4 (1.25%) Tableau
14 3 (0.94%) Amazon RDS
Development Applications
1 25 (7.81%) Git
2 19 (5.94%) JIRA
3 15 (4.69%) Jenkins
4 8 (2.50%) Octopus Deploy
4 8 (2.50%) TeamCity
5 7 (2.19%) CircleCI
6 6 (1.88%) Sonatype Nexus
7 5 (1.56%) GitLab
7 5 (1.56%) Selenium
7 5 (1.56%) Spinnaker
8 4 (1.25%) IBM UrbanCode
9 3 (0.94%) SonarQube
10 2 (0.63%) Gradle
10 2 (0.63%) JUnit
10 2 (0.63%) Maven
10 2 (0.63%) Team Foundation Server
10 2 (0.63%) Visual Studio
11 1 (0.31%) Eclipse
11 1 (0.31%) IntelliJ
11 1 (0.31%) Mockito
General
1 113 (35.31%) Social Skills
2 39 (12.19%) Finance
3 33 (10.31%) Public Sector
4 26 (8.13%) Law
5 21 (6.56%) Analytical Skills
5 21 (6.56%) Banking
6 15 (4.69%) Retail
7 13 (4.06%) Manufacturing
8 8 (2.50%) Organisational Skills
9 6 (1.88%) Local Government
10 5 (1.56%) Inclusion and Diversity
10 5 (1.56%) Influencing Skills
11 4 (1.25%) Billing
11 4 (1.25%) Tech for Good
12 3 (0.94%) Legal
13 2 (0.63%) Marketing
13 2 (0.63%) Police
14 1 (0.31%) Documentation Skills
14 1 (0.31%) Games
14 1 (0.31%) Health Technology
Job Titles
1 80 (25.00%) Senior
2 58 (18.13%) Developer
3 32 (10.00%) Lead
4 26 (8.13%) Data Engineer
5 24 (7.50%) Analyst
6 23 (7.19%) Support Engineer
7 21 (6.56%) Senior Developer
8 19 (5.94%) IT Engineer
8 19 (5.94%) Software Engineer
9 18 (5.63%) Architect
10 17 (5.31%) Cloud Engineer
11 14 (4.38%) DevOps Engineer
12 13 (4.06%) .NET Developer
12 13 (4.06%) Infrastructure Engineer
13 11 (3.44%) Service Desk Engineer
14 10 (3.13%) IT Support
14 10 (3.13%) Senior DevOps
14 10 (3.13%) Senior Manager
15 9 (2.81%) Applications Support
15 9 (2.81%) Support Analyst
Libraries, Frameworks & Software Standards
1 62 (19.38%) .NET
2 53 (16.56%) React
3 24 (7.50%) AngularJS
4 22 (6.88%) ASP.NET
5 21 (6.56%) .NET Core
5 21 (6.56%) REST
6 20 (6.25%) Node.js
7 19 (5.94%) .NET Framework
8 18 (5.63%) Vue
9 16 (5.00%) HTML
10 15 (4.69%) Bootstrap
11 14 (4.38%) CSS
12 12 (3.75%) Spring Boot
13 11 (3.44%) Laravel
13 11 (3.44%) Spring
14 10 (3.13%) Entity Framework
14 10 (3.13%) Kafka
14 10 (3.13%) WPF
15 8 (2.50%) ASP.NET MVC
16 7 (2.19%) OAuth
Miscellaneous
1 20 (6.25%) Public Cloud
2 13 (4.06%) Self-Motivation
3 10 (3.13%) Distributed Systems
4 9 (2.81%) Cloud Native
4 9 (2.81%) Virtual Team
5 8 (2.50%) Data Centre
5 8 (2.50%) Product Ownership
5 8 (2.50%) Replication
5 8 (2.50%) Security Posture
6 7 (2.19%) Management Information System
7 6 (1.88%) Enterprise Storage
7 6 (1.88%) Hybrid Cloud
8 5 (1.56%) Cloud Security Posture
9 4 (1.25%) CCTV
9 4 (1.25%) Legacy Systems
9 4 (1.25%) Life Science
9 4 (1.25%) Mainframe
9 4 (1.25%) Mobile App
9 4 (1.25%) Onboarding
9 4 (1.25%) Team-Oriented Environment
Operating Systems
1 73 (22.81%) Windows
2 27 (8.44%) Windows Server
3 24 (7.50%) Linux
4 16 (5.00%) Windows 10
5 9 (2.81%) Windows Server 2012
6 6 (1.88%) Windows Server 2016
6 6 (1.88%) Windows Server 2019
7 5 (1.56%) Red Hat Enterprise Linux
7 5 (1.56%) Unix
8 3 (0.94%) Data ONTAP
8 3 (0.94%) Windows Server 2008
9 2 (0.63%) Solaris
9 2 (0.63%) VMS
10 1 (0.31%) Android
10 1 (0.31%) zOS
Processes & Methodologies
1 103 (32.19%) DevOps
2 91 (28.44%) Agile
3 69 (21.56%) Problem-Solving
4 68 (21.25%) CI/CD
5 50 (15.63%) Software Engineering
6 38 (11.88%) Microservices
7 37 (11.56%) Continuous Improvement
7 37 (11.56%) Customer Service
8 35 (10.94%) Containerisation
9 34 (10.63%) Mentoring
10 30 (9.38%) Business Intelligence
11 29 (9.06%) Infrastructure as Code
11 29 (9.06%) ITIL
12 28 (8.75%) Continuous Integration
12 28 (8.75%) Test Automation
13 23 (7.19%) Roadmaps
13 23 (7.19%) Stakeholder Management
14 22 (6.88%) Data Engineering
14 22 (6.88%) Line Management
15 21 (6.56%) Coaching
Programming Languages
1 110 (34.38%) SQL
2 59 (18.44%) JavaScript
3 53 (16.56%) C#
4 46 (14.38%) Python
5 25 (7.81%) TypeScript
6 24 (7.50%) PowerShell
7 23 (7.19%) Java
8 14 (4.38%) PHP
9 11 (3.44%) T-SQL
10 7 (2.19%) Bicep
10 7 (2.19%) Data Analysis Expressions
11 6 (1.88%) Bash
12 5 (1.56%) Groovy
12 5 (1.56%) Scala
13 4 (1.25%) C
13 4 (1.25%) Jython
13 4 (1.25%) Perl
13 4 (1.25%) VB.NET
14 3 (0.94%) C++
14 3 (0.94%) R
Qualifications
1 30 (9.38%) Degree
2 26 (8.13%) Security Cleared
3 25 (7.81%) SC Cleared
4 23 (7.19%) Microsoft Certification
5 20 (6.25%) Azure Certification
6 10 (3.13%) Cisco Certification
7 9 (2.81%) AWS Certification
8 5 (1.56%) AWS Certified Cloud Practitioner
8 5 (1.56%) DBS Check
9 4 (1.25%) CCNA
9 4 (1.25%) Computer Science Degree
9 4 (1.25%) VMware Certified Professional (VCP)
10 3 (0.94%) CCNP
10 3 (0.94%) ITIL Certification
10 3 (0.94%) Master's Degree
10 3 (0.94%) OCP
10 3 (0.94%) Oracle Certification
10 3 (0.94%) PMI Certification
11 2 (0.63%) MBA
11 2 (0.63%) MCITP
Quality Assurance & Compliance
1 11 (3.44%) ISO/IEC 27001
2 10 (3.13%) Data Quality
3 9 (2.81%) Cyber Essentials
4 8 (2.50%) QA
5 6 (1.88%) GDPR
6 4 (1.25%) Sarbanes-Oxley
7 3 (0.94%) ISO 14001
7 3 (0.94%) ISO 9001
7 3 (0.94%) NIST
8 2 (0.63%) Actionable Recommendations
8 2 (0.63%) PCI DSS
9 1 (0.31%) Basel III
9 1 (0.31%) IFRS
9 1 (0.31%) IFRS 9
9 1 (0.31%) ISO 22301
9 1 (0.31%) ISO/IEC 20000
9 1 (0.31%) NIST 800
System Software
1 65 (20.31%) Active Directory
2 28 (8.75%) Docker
3 24 (7.50%) Hyper-V
4 20 (6.25%) VMware Infrastructure
5 9 (2.81%) Virtual Machines
6 5 (1.56%) vSphere
7 4 (1.25%) VMware ESXi
8 3 (0.94%) Veritas Cluster Server
9 2 (0.63%) KVM
9 2 (0.63%) NFS
9 2 (0.63%) SRDF
9 2 (0.63%) Virtual Desktop
9 2 (0.63%) Xen
10 1 (0.31%) Terminal Services
10 1 (0.31%) XenApp
10 1 (0.31%) XenDesktop
Systems Management
1 43 (13.44%) Kubernetes
2 40 (12.50%) Terraform
3 16 (5.00%) Ansible
4 13 (4.06%) Microsoft Intune
5 11 (3.44%) FortiGate
6 8 (2.50%) WSUS
7 5 (1.56%) Active Directory Federation Services
8 4 (1.25%) Progress Chef
8 4 (1.25%) Puppet
8 4 (1.25%) vCenter Server
9 3 (0.94%) Argo
9 3 (0.94%) Grafana
9 3 (0.94%) Istio
9 3 (0.94%) Prometheus
10 2 (0.63%) NetBackup
10 2 (0.63%) SCCM
11 1 (0.31%) Failover Clustering
11 1 (0.31%) Nessus
11 1 (0.31%) NetApp OnCommand
11 1 (0.31%) Oracle RMAN
Vendors
1 119 (37.19%) Microsoft
2 41 (12.81%) VMware
3 20 (6.25%) Databricks
4 17 (5.31%) Cisco
5 12 (3.75%) IBM
6 9 (2.81%) Google
7 8 (2.50%) Dynatrace
7 8 (2.50%) Oracle
7 8 (2.50%) ServiceNow
8 7 (2.19%) NetApp
9 6 (1.88%) EMC
10 5 (1.56%) Draytek
10 5 (1.56%) Meraki
10 5 (1.56%) Ubiquiti
11 4 (1.25%) Datto
11 4 (1.25%) F5
12 3 (0.94%) Atlassian
12 3 (0.94%) Commvault
12 3 (0.94%) SolarWinds
12 3 (0.94%) Zscaler