Azure Jobs in England

Microsoft Azure
UK > England

The table below provides summary statistics for permanent job vacancies advertised in England requiring Azure skills. It includes a benchmarking guide to the annual salaries offered in vacancies that cited Azure over the 6 months leading up to 20 August 2025, comparing them to the same period in the previous two years.

6 months to
20 Aug 2025
Same period 2024 Same period 2023
Rank 8 8 4
Rank change year-on-year 0 -4 +1
DemandTrendPermanent jobs citing Azure 7,082 11,135 13,915
As % of all permanent jobs advertised in England 13.30% 14.79% 21.51%
As % of the Cloud Services category 46.97% 46.53% 51.31%
Number of salaries quoted 4,839 8,148 10,706
10th Percentile £31,250 £36,250 £36,250
25th Percentile £41,875 £46,250 £47,500
Median annual salary (50th Percentile) £60,000 £60,000 £63,000
Median % change year-on-year - -4.76% -2.51%
75th Percentile £80,000 £78,750 £82,500
90th Percentile £95,200 £97,500 £100,000
UK median annual salary £60,000 £60,000 £62,500
% change year-on-year - -4.00% -

All Cloud Skills
England

Azure falls under the Cloud Services category. For comparison with the information above, the following table provides summary statistics for all permanent job vacancies requiring cloud computing skills in England.

DemandTrendPermanent vacancies with a requirement for cloud computing skills 15,079 23,933 27,120
As % of all permanent jobs advertised in England 28.31% 31.80% 41.92%
Number of salaries quoted 10,187 16,801 21,305
10th Percentile £29,809 £32,500 £33,750
25th Percentile £40,000 £43,750 £46,250
Median annual salary (50th Percentile) £60,000 £60,000 £65,000
Median % change year-on-year - -7.69% +4.00%
75th Percentile £80,000 £82,500 £85,000
90th Percentile £101,250 £100,000 £105,000
UK median annual salary £60,000 £60,000 £64,000
% change year-on-year - -6.25% +2.40%

Azure
Job Vacancy Trend in England

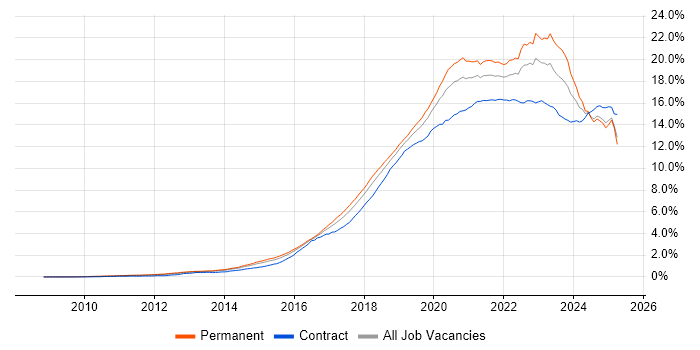
Job postings citing Azure as a proportion of all IT jobs advertised in England.

Job vacancy trend for Azure in England

Azure
Salary Trend in England

Salary distribution trend for jobs in England citing Azure.

Salary distribution trend for jobs in England citing Azure

Azure
Salary Histogram in England

Salary distribution for jobs citing Azure in England over the 6 months to 20 August 2025.

Salary histogram for Azure in England

Azure
Job Locations in England

The table below looks at the demand and provides a guide to the median salaries quoted in IT jobs citing Azure within the England region over the 6 months to 20 August 2025. The 'Rank Change' column provides an indication of the change in demand within each location based on the same 6 month period last year.

Location Rank Change
on Same Period
Last Year
Matching
DemandTrendPermanent
IT Job Ads
Median Salary
Past 6 Months
Median Salary
% Change
on Same Period
Last Year
Live
Jobs
London 0 2,568 £75,000 -2.60% 2,085
North of England -8 1,311 £55,000 - 916
South East -4 1,179 £55,000 - 1,238
Midlands -2 841 £52,500 -4.55% 470
North West -15 764 £56,250 +2.27% 539
West Midlands +2 558 £56,400 -1.91% 293
East of England +2 541 £45,000 -10.00% 315
South West -1 427 £50,000 -9.09% 321
Yorkshire -12 397 £57,500 +4.55% 277
East Midlands -14 282 £43,000 -9.47% 172
North East -7 152 £50,000 -9.09% 112
South Coast - 1 £59,000 -
Azure
UK

Azure
Co-occurring Skills and Capabilities in England by Category

The follow tables expand on the table above by listing co-occurrences grouped by category. The same employment type, locality and period is covered with up to 20 co-occurrences shown in each of the following categories:

Application Platforms
1 515 (7.27%) Microsoft Exchange
2 504 (7.12%) SharePoint
3 202 (2.85%) Confluence
4 132 (1.86%) Apache Spark
5 88 (1.24%) CMS
6 70 (0.99%) IIS
7 62 (0.88%) Apache Airflow
8 51 (0.72%) Apache
9 20 (0.28%) IBM Domino
10 19 (0.27%) nginx
11 16 (0.23%) Exchange Server 2013
12 12 (0.17%) Apache Solr
12 12 (0.17%) Headless CMS
13 11 (0.16%) Umbraco
14 10 (0.14%) Moodle
15 9 (0.13%) Tomcat
16 8 (0.11%) Appian
17 6 (0.085%) BizTalk Server
17 6 (0.085%) WordPress
18 5 (0.071%) Oracle Workflow
Applications
1 199 (2.81%) Microsoft Excel
2 162 (2.29%) Microsoft Office
3 48 (0.68%) Microsoft PowerPoint
4 36 (0.51%) Chatbot
5 20 (0.28%) MS Visio
6 15 (0.21%) Microsoft Project
7 13 (0.18%) Maya
8 11 (0.16%) Trello
9 8 (0.11%) Mozilla Thunderbird
10 7 (0.099%) MadCap Flare
11 5 (0.071%) PlantUML
12 3 (0.042%) S-PLUS
13 1 (0.014%) Adobe Creative Suite
13 1 (0.014%) AutoCAD
13 1 (0.014%) Autodesk Inventor
13 1 (0.014%) SOLIDWORKS
13 1 (0.014%) Spreadsheet
Business Applications
1 139 (1.96%) Dynamics CRM
2 37 (0.52%) SAP S/4HANA
3 14 (0.20%) SAP IBP
4 13 (0.18%) Oracle EBS
5 10 (0.14%) Shopify
6 9 (0.13%) Dynamics NAV
6 9 (0.13%) Payment Gateway
7 8 (0.11%) Dynamics AX
8 7 (0.099%) Dynamics GP
8 7 (0.099%) Elite 3E
8 7 (0.099%) Fidessa
8 7 (0.099%) Remedy ITSM
9 6 (0.085%) Carpe Diem
9 6 (0.085%) NetSuite
10 5 (0.071%) Visualfiles
11 4 (0.056%) Magento
11 4 (0.056%) Sage 1000
11 4 (0.056%) Sage 200
12 3 (0.042%) Raiser’s Edge
12 3 (0.042%) Sage 50
Cloud Services
1 2,546 (35.95%) AWS
2 1,480 (20.90%) GCP
3 1,456 (20.56%) Microsoft 365
4 1,024 (14.46%) Power Platform
5 834 (11.78%) Azure DevOps
6 815 (11.51%) Entra ID
7 491 (6.93%) Serverless
8 418 (5.90%) SaaS
9 335 (4.73%) Azure Data Factory
10 314 (4.43%) Dynamics 365
11 298 (4.21%) PaaS
12 288 (4.07%) Power Automate
13 271 (3.83%) AWS Lambda
14 255 (3.60%) PowerApps
15 248 (3.50%) GitHub
16 216 (3.05%) Azure Logic Apps
17 208 (2.94%) Azure Synapse Analytics
18 201 (2.84%) IaaS
19 163 (2.30%) Azure Monitor
20 136 (1.92%) Azure Sentinel
Communications & Networking
1 827 (11.68%) Firewall
2 469 (6.62%) DNS
3 423 (5.97%) WAN
4 385 (5.44%) VPN
5 340 (4.80%) LAN
6 327 (4.62%) DHCP
7 250 (3.53%) TCP/IP
7 250 (3.53%) VLAN
8 223 (3.15%) Broadband
9 189 (2.67%) Network Security
10 166 (2.34%) Wi-Fi
11 140 (1.98%) SD-WAN
12 134 (1.89%) VoIP
13 130 (1.84%) SAN
14 127 (1.79%) Wireless
15 61 (0.86%) BGP
16 54 (0.76%) Internet
17 51 (0.72%) OSPF
18 44 (0.62%) Remote Desktop
19 39 (0.55%) NAS
Database & Business Intelligence
1 948 (13.39%) SQL Server
2 708 (10.00%) Power BI
3 397 (5.61%) Data Warehouse
4 360 (5.08%) Data Lake
5 263 (3.71%) NoSQL
6 199 (2.81%) Azure SQL Database
7 191 (2.70%) PostgreSQL
8 188 (2.65%) MongoDB
9 164 (2.32%) MySQL
10 155 (2.19%) Relational Database
11 148 (2.09%) SQL Server Integration Services
12 136 (1.92%) Big Data
13 135 (1.91%) Metadata
14 124 (1.75%) Elasticsearch
15 117 (1.65%) SQL Server Reporting Services
16 101 (1.43%) Amazon RDS
17 90 (1.27%) Tableau
18 67 (0.95%) BigQuery
19 60 (0.85%) Hadoop
19 60 (0.85%) SAP BW
Development Applications
1 451 (6.37%) JIRA
2 404 (5.70%) Git
3 298 (4.21%) GitLab
4 265 (3.74%) Selenium
5 230 (3.25%) SonarQube
6 215 (3.04%) Sonatype Nexus
7 213 (3.01%) Bitbucket
7 213 (3.01%) Maven
8 208 (2.94%) Cucumber
9 155 (2.19%) Jenkins
10 66 (0.93%) Visual Studio
11 63 (0.89%) Octopus Deploy
12 42 (0.59%) Postman
13 33 (0.47%) JMeter
14 32 (0.45%) Team Foundation Server
15 31 (0.44%) Cypress.io
16 30 (0.42%) TeamCity
17 29 (0.41%) JUnit
17 29 (0.41%) SQL Server Management Studio (SSMS)
18 23 (0.32%) NUnit
General
1 2,042 (28.83%) Social Skills
2 1,540 (21.75%) Finance
3 945 (13.34%) Analytical Skills
4 791 (11.17%) Inclusion and Diversity
5 592 (8.36%) Law
6 495 (6.99%) Banking
7 427 (6.03%) Retail
8 235 (3.32%) Marketing
9 234 (3.30%) Legal
10 222 (3.13%) Public Sector
11 164 (2.32%) Manufacturing
12 114 (1.61%) Presentation Skills
13 111 (1.57%) Documentation Skills
13 111 (1.57%) Organisational Skills
14 104 (1.47%) Investment Banking
15 92 (1.30%) Telecoms
16 90 (1.27%) Corporate Banking
17 88 (1.24%) Influencing Skills
18 84 (1.19%) Back Office
19 71 (1.00%) Automotive
Job Titles
1 1,475 (20.83%) Senior
2 1,042 (14.71%) Developer
3 747 (10.55%) Lead
4 642 (9.07%) Software Engineer
5 622 (8.78%) Architect
6 609 (8.60%) Analyst
7 431 (6.09%) IT Support
8 408 (5.76%) Support Engineer
9 379 (5.35%) Azure Engineer
10 347 (4.90%) Data Engineer
11 338 (4.77%) Infrastructure Engineer
12 264 (3.73%) Senior Software Engineer
13 249 (3.52%) Support Analyst
14 239 (3.37%) Cloud Engineer
15 225 (3.18%) Machine Learning Engineer
16 218 (3.08%) Solutions Architect
17 217 (3.06%) Senior Developer
18 215 (3.04%) 2nd Line Support
19 203 (2.87%) IT Engineer
20 202 (2.85%) DevOps Engineer
Libraries, Frameworks & Software Standards
1 1,107 (15.63%) .NET
2 625 (8.83%) React
3 453 (6.40%) CSS
4 439 (6.20%) HTML
5 424 (5.99%) Node.js
6 366 (5.17%) Kafka
7 348 (4.91%) REST
8 291 (4.11%) RESTful
9 268 (3.78%) Spring
10 260 (3.67%) Spring Boot
11 236 (3.33%) Redux
12 232 (3.28%) AngularJS
13 230 (3.25%) .NET Core
14 220 (3.11%) ASP.NET
15 204 (2.88%) JPA
16 201 (2.84%) .NET Framework
17 152 (2.15%) HTML5
18 132 (1.86%) JSON
19 126 (1.78%) Vue
20 125 (1.77%) CSS3
Miscellaneous
1 509 (7.19%) Self-Motivation
2 456 (6.44%) Product Ownership
3 397 (5.61%) Cloud Native
4 292 (4.12%) Enterprise Software
5 231 (3.26%) Cyberattack
6 204 (2.88%) Linux Command Line
7 191 (2.70%) Management Information System
8 181 (2.56%) Hybrid Cloud
9 172 (2.43%) Data Centre
10 167 (2.36%) Onboarding
11 138 (1.95%) Security Posture
12 137 (1.93%) Driving Licence
13 136 (1.92%) Public Cloud
14 123 (1.74%) Legacy Systems
15 111 (1.57%) Data Structures
16 98 (1.38%) Greenfield Project
16 98 (1.38%) NHS
17 93 (1.31%) Algorithms
18 91 (1.28%) Analytical Mindset
19 89 (1.26%) Distributed Systems
Operating Systems
1 1,479 (20.88%) Windows
2 845 (11.93%) Windows Server
3 708 (10.00%) Linux
4 206 (2.91%) Windows 10
5 146 (2.06%) Mac OS
6 134 (1.89%) Windows Server 2019
7 126 (1.78%) Android
8 106 (1.50%) Windows Server 2016
9 90 (1.27%) Apple iOS
10 59 (0.83%) Unix
11 50 (0.71%) VMS
12 45 (0.64%) Red Hat Enterprise Linux
13 43 (0.61%) Windows Server 2012
14 31 (0.44%) Ubuntu
15 19 (0.27%) CentOS
16 15 (0.21%) Amazon Linux
16 15 (0.21%) Rocky
17 13 (0.18%) Debian
17 13 (0.18%) Windows Server 2008
18 7 (0.099%) Mac OS X
Processes & Methodologies
1 2,370 (33.47%) Agile
2 1,926 (27.20%) DevOps
3 1,830 (25.84%) Problem-Solving
4 1,789 (25.26%) CI/CD
5 1,350 (19.06%) Mentoring
6 1,002 (14.15%) Software Engineering
7 897 (12.67%) Analytics
8 881 (12.44%) Microservices
9 828 (11.69%) Continuous Improvement
10 824 (11.64%) Machine Learning
11 751 (10.60%) Business Intelligence
12 709 (10.01%) Containerisation
13 689 (9.73%) Roadmaps
14 685 (9.67%) Artificial Intelligence
15 682 (9.63%) ITIL
16 658 (9.29%) Migration
17 624 (8.81%) Data Science
18 621 (8.77%) Data Engineering
19 610 (8.61%) Test Automation
20 597 (8.43%) Data Modelling
Programming Languages
1 1,954 (27.59%) SQL
2 1,796 (25.36%) Python
3 1,031 (14.56%) JavaScript
4 928 (13.10%) C#
5 891 (12.58%) Java
6 780 (11.01%) PowerShell
7 614 (8.67%) TypeScript
8 296 (4.18%) C++
9 283 (4.00%) Go
10 261 (3.69%) Rust
11 199 (2.81%) T-SQL
12 192 (2.71%) Bash
13 105 (1.48%) Bicep
14 82 (1.16%) Data Analysis Expressions
15 77 (1.09%) PHP
16 71 (1.00%) Scala
17 65 (0.92%) R
18 47 (0.66%) VBA
19 42 (0.59%) Kusto Query Language
20 32 (0.45%) Groovy
Qualifications
1 1,247 (17.61%) Degree
2 702 (9.91%) Security Cleared
3 478 (6.75%) Azure Certification
4 405 (5.72%) Microsoft Certification
5 365 (5.15%) AWS Certification
6 346 (4.89%) SC Cleared
7 343 (4.84%) Computer Science Degree
8 323 (4.56%) DV Cleared
9 264 (3.73%) DBS Check
10 247 (3.49%) PhD
11 225 (3.18%) AWS Certified Solutions Architect
12 182 (2.57%) AWS Certified Developer
13 170 (2.40%) Cisco Certification
14 157 (2.22%) Master's Degree
15 105 (1.48%) CCNA
16 88 (1.24%) CISSP
17 86 (1.21%) CCNP
18 73 (1.03%) TOGAF Certification
19 72 (1.02%) MCP
20 70 (0.99%) MCSE
Quality Assurance & Compliance
1 514 (7.26%) QA
2 316 (4.46%) GDPR
3 298 (4.21%) Data Quality
4 277 (3.91%) ISO/IEC 27001
5 178 (2.51%) NIST
6 173 (2.44%) Accessibility
7 107 (1.51%) Cyber Essentials
8 97 (1.37%) SLA
9 48 (0.68%) HIPAA
10 46 (0.65%) NCSC
11 45 (0.64%) PCI DSS
12 33 (0.47%) Cyber Essentials PLUS
13 30 (0.42%) SOC 2
14 26 (0.37%) Sarbanes-Oxley
15 22 (0.31%) California Consumer Privacy Act
16 21 (0.30%) PMO
17 18 (0.25%) GRC
18 16 (0.23%) Software Quality Assurance
19 9 (0.13%) COBIT
19 9 (0.13%) ISO 9001
System Software
1 1,287 (18.17%) Active Directory
2 804 (11.35%) Docker
3 440 (6.21%) VMware Infrastructure
4 372 (5.25%) Hyper-V
5 128 (1.81%) Virtual Machines
6 89 (1.26%) VMware ESXi
7 80 (1.13%) Virtual Desktop
8 52 (0.73%) vSphere
9 31 (0.44%) Firmware
10 22 (0.31%) BitLocker
10 22 (0.31%) Terminal Services
10 22 (0.31%) VMware NSX
11 18 (0.25%) XenApp
12 14 (0.20%) DFS Replication
13 13 (0.18%) Virtual Servers
14 12 (0.17%) Dovecot
14 12 (0.17%) Postfix
15 8 (0.11%) NFS
15 8 (0.11%) Squid
16 7 (0.099%) Microsoft App-V
Systems Management
1 908 (12.82%) Kubernetes
2 723 (10.21%) Microsoft Intune
3 681 (9.62%) Terraform
4 322 (4.55%) Ansible
5 142 (2.01%) SCCM
6 120 (1.69%) Grafana
7 111 (1.57%) Prometheus
8 94 (1.33%) Single Sign-On
9 55 (0.78%) FortiGate
10 43 (0.61%) Puppet
11 41 (0.58%) Jamf Pro
12 34 (0.48%) vCenter Server
13 30 (0.42%) Active Directory Federation Services
14 25 (0.35%) Nagios
15 24 (0.34%) Autotask
16 22 (0.31%) Progress Chef
17 20 (0.28%) Failover Clustering
18 16 (0.23%) Backup Exec
18 16 (0.23%) NetBackup
18 16 (0.23%) SCOM
Vendors
1 2,950 (41.65%) Microsoft
2 615 (8.68%) VMware
3 444 (6.27%) Databricks
4 404 (5.70%) Cisco
5 352 (4.97%) Google
6 198 (2.80%) Solace
7 193 (2.73%) Oracle
8 163 (2.30%) SAP
9 159 (2.25%) Meraki
10 147 (2.08%) Citrix
11 146 (2.06%) ServiceNow
12 106 (1.50%) Salesforce
12 106 (1.50%) Veeam
13 90 (1.27%) HP
14 88 (1.24%) Palo Alto
15 87 (1.23%) SolarWinds
16 86 (1.21%) Apple
17 82 (1.16%) Fortinet
18 76 (1.07%) Red Hat
19 72 (1.02%) IBM