Roadmaps Jobs in England

Roadmaps
UK > England

The table below provides summary statistics for permanent job vacancies advertised in England requiring Roadmaps skills. It includes a benchmarking guide to the annual salaries offered in vacancies that cited Roadmaps over the 6 months leading up to 23 October 2024, comparing them to the same period in the previous two years.

6 months to
23 Oct 2024
Same period 2023 Same period 2022
Rank 42 27 23
Rank change year-on-year -15 -4 +12
Permanent jobs citing Roadmaps 3,206 4,002 11,198
As % of all permanent jobs advertised in England 4.80% 7.68% 9.33%
As % of the Processes & Methodologies category 5.71% 8.15% 9.70%
Number of salaries quoted 1,566 2,679 6,122
10th Percentile £46,713 £49,189 £45,000
25th Percentile £55,000 £60,000 £55,000
Median annual salary (50th Percentile) £72,500 £75,000 £72,000
Median % change year-on-year -3.33% +4.17% +2.86%
75th Percentile £92,500 £95,000 £90,000
90th Percentile £118,750 £115,000 £110,000
UK median annual salary £74,323 £75,000 £70,000
% change year-on-year -0.90% +7.14% -

All Process and Methodology Skills
England

Roadmaps falls under the Processes and Methodologies category. For comparison with the information above, the following table provides summary statistics for all permanent job vacancies requiring process or methodology skills in England.

Permanent vacancies with a requirement for process or methodology skills 56,152 49,103 115,444
As % of all permanent jobs advertised in England 84.04% 94.20% 96.15%
Number of salaries quoted 27,978 35,811 67,940
10th Percentile £34,000 £32,625 £33,950
25th Percentile £45,000 £45,000 £45,000
Median annual salary (50th Percentile) £60,000 £60,000 £60,000
Median % change year-on-year - - +4.35%
75th Percentile £78,750 £80,475 £81,250
90th Percentile £97,500 £100,000 £100,000
UK median annual salary £60,000 £60,000 £60,000
% change year-on-year - - +4.35%

Roadmaps
Job Vacancy Trend in England

Job postings citing Roadmaps as a proportion of all IT jobs advertised in England.
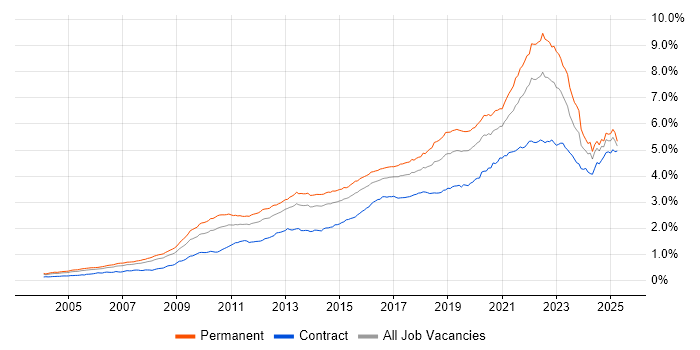
Job vacancy trend for Roadmaps in England

Roadmaps
Salary Trend in England

3-month moving average salary quoted in jobs citing Roadmaps in England.

Salary trend for Roadmaps in England

Roadmaps
Salary Histogram in England

Salary distribution for jobs citing Roadmaps in England over the 6 months to 23 October 2024.

Salary histogram for Roadmaps in England

Roadmaps
Job Locations in England

The table below looks at the demand and provides a guide to the median salaries quoted in IT jobs citing Roadmaps within the England region over the 6 months to 23 October 2024. The 'Rank Change' column provides an indication of the change in demand within each location based on the same 6 month period last year.

Location Rank Change
on Same Period
Last Year
Matching
Permanent
IT Job Ads
Median Salary
Past 6 Months
Median Salary
% Change
on Same Period
Last Year
Live
Jobs
London -3 1,400 £85,000 - 410
North of England -6 686 £63,277 -6.26% 185
North West 0 443 £62,690 -4.07% 126
South East -40 361 £60,000 -10.27% 149
Midlands -23 328 £66,000 +1.54% 128
South West -15 252 £62,500 -3.85% 88
West Midlands -20 220 £70,000 +7.69% 103
Yorkshire -12 181 £64,500 -8.61% 50
East of England -46 129 £70,000 -2.10% 109
East Midlands -31 107 £60,000 - 25
North East -17 62 £65,000 +8.33% 11
Roadmaps
UK

Roadmaps
Co-occurring Skills and Capabilities in England by Category

The follow tables expand on the table above by listing co-occurrences grouped by category. The same employment type, locality and period is covered with up to 20 co-occurrences shown in each of the following categories:

Application Platforms
1 81 (2.53%) SharePoint
2 67 (2.09%) Microsoft Exchange
3 47 (1.47%) Confluence
4 37 (1.15%) SAS
5 31 (0.97%) CMS
6 20 (0.62%) nginx
7 16 (0.50%) ArcGIS
8 14 (0.44%) Apache Spark
9 12 (0.37%) Sitecore CMS
10 11 (0.34%) Apache
10 11 (0.34%) Umbraco
11 8 (0.25%) Kentico
11 8 (0.25%) OpenStack
12 7 (0.22%) Sitefinity
13 6 (0.19%) Apache Airflow
14 5 (0.16%) Adobe Experience Manager
14 5 (0.16%) TPMS
15 4 (0.12%) Blackberry Enterprise Server
15 4 (0.12%) Cloud Foundry
15 4 (0.12%) WordPress
Applications
1 83 (2.59%) Microsoft Office
2 64 (2.00%) Microsoft Excel
3 19 (0.59%) Simulink
4 17 (0.53%) Microsoft PowerPoint
5 14 (0.44%) Microsoft Project
6 10 (0.31%) MS Visio
7 5 (0.16%) Chatbot
8 4 (0.12%) Sketch
8 4 (0.12%) Trello
9 3 (0.094%) Adobe XD
9 3 (0.094%) Photoshop
10 2 (0.062%) InVision
10 2 (0.062%) SPSS
10 2 (0.062%) Windchill
11 1 (0.031%) Adobe Creative Suite
11 1 (0.031%) InDesign
11 1 (0.031%) OrCAD
11 1 (0.031%) Spreadsheet
Business Applications
1 47 (1.47%) Aladdin
2 44 (1.37%) SAP ERP
3 42 (1.31%) SAP S/4HANA
4 32 (1.00%) Unit4 Business World
5 30 (0.94%) NEC Housing
6 24 (0.75%) Dynamics CRM
7 23 (0.72%) Endur
8 17 (0.53%) Maximo
9 11 (0.34%) SAP SD
10 10 (0.31%) Salesforce CRM
11 9 (0.28%) Magento
12 8 (0.25%) Oracle ERP
12 8 (0.25%) Sage 200
13 6 (0.19%) Dynamics AX
13 6 (0.19%) NetSuite
13 6 (0.19%) Oracle EBS
14 4 (0.12%) CA PPM
14 4 (0.12%) PeopleSoft HCM
14 4 (0.12%) SAP HCM
14 4 (0.12%) Shopify
Cloud Services
1 679 (21.18%) Azure
2 546 (17.03%) AWS
3 189 (5.90%) SaaS
4 168 (5.24%) GCP
5 159 (4.96%) Microsoft 365
6 110 (3.43%) Entra ID
7 98 (3.06%) Power Platform
8 81 (2.53%) Serverless
9 66 (2.06%) Azure DevOps
10 64 (2.00%) Cloud Computing
11 55 (1.72%) dbt
12 53 (1.65%) Dynamics 365
13 50 (1.56%) Microsoft Copilot
14 45 (1.40%) Figma
15 37 (1.15%) Azure Synapse Analytics
16 30 (0.94%) GitHub
16 30 (0.94%) PaaS
17 29 (0.90%) OneDrive
18 26 (0.81%) Amazon ECS
19 24 (0.75%) Power Automate
Communications & Networking
1 304 (9.48%) Broadband
2 110 (3.43%) Firewall
3 80 (2.50%) Wireless
4 68 (2.12%) Network Security
5 59 (1.84%) LAN
5 59 (1.84%) WAN
6 58 (1.81%) TCP/IP
7 55 (1.72%) Internet
8 45 (1.40%) VLAN
9 36 (1.12%) VPN
10 32 (1.00%) MPLS
11 25 (0.78%) DNS
12 23 (0.72%) BGP
12 23 (0.72%) Intrusion Detection
13 21 (0.66%) SD-WAN
14 18 (0.56%) OSPF
14 18 (0.56%) Wi-Fi
15 17 (0.53%) Unified Communications
15 17 (0.53%) WLAN
16 16 (0.50%) NAS
Database & Business Intelligence
1 105 (3.28%) Data Warehouse
2 99 (3.09%) Data Hub
3 71 (2.21%) MySQL
3 71 (2.21%) SQL Server
4 64 (2.00%) Power BI
5 62 (1.93%) PostgreSQL
6 61 (1.90%) Data Lake
7 39 (1.22%) Relational Database
8 35 (1.09%) NoSQL
9 33 (1.03%) Tableau
10 31 (0.97%) Metadata
11 27 (0.84%) Big Data
12 22 (0.69%) Amazon RDS
13 21 (0.66%) Azure SQL Data Warehouse
13 21 (0.66%) Azure SQL Database
13 21 (0.66%) RDBMS
14 20 (0.62%) MongoDB
14 20 (0.62%) Redis
15 18 (0.56%) MS Access
16 16 (0.50%) SQL Server Integration Services
Development Applications
1 124 (3.87%) JIRA
2 55 (1.72%) Git
3 33 (1.03%) Jenkins
4 19 (0.59%) Rational Rhapsody
5 15 (0.47%) Bitbucket
5 15 (0.47%) GitLab
6 13 (0.41%) TeamCity
7 12 (0.37%) Selenium
8 10 (0.31%) Cypress.io
9 8 (0.25%) Visual Studio
10 6 (0.19%) Mercurial
10 6 (0.19%) MSTest
10 6 (0.19%) Rational DOORS
10 6 (0.19%) webpack
11 5 (0.16%) Cucumber
11 5 (0.16%) Octopus Deploy
11 5 (0.16%) SQL Server Management Studio (SSMS)
12 4 (0.12%) Axure RP
12 4 (0.12%) Team Foundation Server
12 4 (0.12%) WebDriver
General
1 1,064 (33.19%) Social Skills
2 887 (27.67%) Finance
3 447 (13.94%) Analytical Skills
4 266 (8.30%) Marketing
5 199 (6.21%) Legal
6 183 (5.71%) Inclusion and Diversity
7 152 (4.74%) Banking
8 145 (4.52%) Law
9 141 (4.40%) Retail
10 121 (3.77%) Presentation Skills
11 120 (3.74%) Public Sector
12 116 (3.62%) Games
13 93 (2.90%) Front Office
14 70 (2.18%) Influencing Skills
15 69 (2.15%) Manufacturing
16 68 (2.12%) Telecoms
17 59 (1.84%) Pharmaceutical
18 52 (1.62%) Investment Banking
19 51 (1.59%) Organisational Skills
20 44 (1.37%) Local Government
Job Titles
1 610 (19.03%) Architect
2 553 (17.25%) Lead
3 493 (15.38%) Senior
4 276 (8.61%) Product Manager
5 228 (7.11%) Analyst
6 223 (6.96%) Solutions Architect
7 172 (5.36%) Consultant
8 150 (4.68%) Senior Manager
9 136 (4.24%) Developer
10 130 (4.05%) Team Leader
11 91 (2.84%) Software Engineer
12 85 (2.65%) Enterprise Architect
13 77 (2.40%) Product Owner
14 74 (2.31%) Business Analyst
14 74 (2.31%) Senior Product Manager
15 73 (2.28%) Senior Analyst
16 63 (1.97%) Data Architect
16 63 (1.97%) Full-Stack Engineer
16 63 (1.97%) Project Manager
16 63 (1.97%) Technical Architect
Libraries, Frameworks & Software Standards
1 205 (6.39%) React
2 124 (3.87%) Elastic Stack
3 120 (3.74%) .NET
4 108 (3.37%) AngularJS
5 80 (2.50%) CSS
6 75 (2.34%) HTML
7 68 (2.12%) Node.js
8 55 (1.72%) REST
9 54 (1.68%) React Native
10 44 (1.37%) Django
11 40 (1.25%) RESTful
12 38 (1.19%) Web Services
13 30 (0.94%) jQuery
14 27 (0.84%) Middleware
15 25 (0.78%) Kafka
16 23 (0.72%) Ruby on Rails
16 23 (0.72%) Vue
17 21 (0.66%) ASP.NET
17 21 (0.66%) Spring
18 20 (0.62%) .NET Framework
Miscellaneous
1 329 (10.26%) Product Ownership
2 181 (5.65%) Management Information System
3 134 (4.18%) Cloud Native
4 131 (4.09%) Private Cloud
5 99 (3.09%) Self-Motivation
6 91 (2.84%) Mobile App
7 85 (2.65%) Data Centre
8 84 (2.62%) Hedge funds
9 77 (2.40%) Fixed Income
10 68 (2.12%) Public Cloud
11 62 (1.93%) Onboarding
12 61 (1.90%) Virtual Team
13 53 (1.65%) Derivative
14 51 (1.59%) Equities
14 51 (1.59%) IoT
15 49 (1.53%) Foreign Exchange (FX)
16 48 (1.50%) Security Posture
17 47 (1.47%) Legacy Systems
18 42 (1.31%) Enterprise Software
19 41 (1.28%) Algorithms
Operating Systems
1 287 (8.95%) Linux
2 122 (3.81%) Windows
3 42 (1.31%) Windows Server
4 33 (1.03%) Unix
5 22 (0.69%) Android
6 20 (0.62%) Red Hat Enterprise Linux
7 17 (0.53%) Windows 10
8 15 (0.47%) Apple iOS
9 14 (0.44%) Ubuntu
10 8 (0.25%) Embedded Linux
10 8 (0.25%) VME
11 6 (0.19%) Solaris
11 6 (0.19%) VMS
12 5 (0.16%) Debian
12 5 (0.16%) Mac OS
12 5 (0.16%) Windows Server 2016
13 4 (0.12%) CentOS
13 4 (0.12%) SUSE
13 4 (0.12%) Windows Server 2019
14 3 (0.094%) HPUX
Processes & Methodologies
1 1,048 (32.69%) Agile
2 681 (21.24%) Product Roadmap
3 577 (18.00%) Problem-Solving
4 496 (15.47%) Strategic Roadmap
5 477 (14.88%) Continuous Improvement
6 474 (14.78%) Analytics
7 462 (14.41%) DevOps
8 460 (14.35%) Mentoring
9 440 (13.72%) Technology Roadmap
10 386 (12.04%) Project Management
11 365 (11.38%) Decision-Making
12 339 (10.57%) Computer Science
13 323 (10.07%) CI/CD
14 301 (9.39%) Stakeholder Management
15 299 (9.33%) Coaching
16 277 (8.64%) Cybersecurity
17 273 (8.52%) Software Engineering
18 270 (8.42%) Customer Experience
19 259 (8.08%) Artificial Intelligence
20 250 (7.80%) Migration
Programming Languages
1 439 (13.69%) Python
2 348 (10.85%) SQL
3 152 (4.74%) JavaScript
4 145 (4.52%) Java
5 143 (4.46%) Bash
6 132 (4.12%) Shell Script
7 115 (3.59%) PowerShell
8 108 (3.37%) C#
9 103 (3.21%) TypeScript
10 64 (2.00%) PHP
11 51 (1.59%) C++
12 46 (1.43%) C
13 34 (1.06%) Ruby
14 33 (1.03%) Kotlin
15 25 (0.78%) Go
16 24 (0.75%) Scala
17 23 (0.72%) Rust
18 19 (0.59%) R
19 16 (0.50%) T-SQL
20 15 (0.47%) Kusto Query Language
Qualifications
1 609 (19.00%) Degree
2 230 (7.17%) Computer Science Degree
3 208 (6.49%) Master's Degree
4 205 (6.39%) Security Cleared
5 146 (4.55%) SC Cleared
6 123 (3.84%) LPIC
6 123 (3.84%) RHCSA
7 102 (3.18%) DBS Check
8 81 (2.53%) Azure Certification
9 62 (1.93%) AWS Certification
10 57 (1.78%) CISSP
11 51 (1.59%) Microsoft Certification
12 50 (1.56%) Cisco Certification
13 44 (1.37%) PMI Certification
14 40 (1.25%) BPSS Clearance
15 39 (1.22%) CEH
16 32 (1.00%) PMP
17 26 (0.81%) CompTIA Security+
17 26 (0.81%) TOGAF Certification
18 25 (0.78%) MBA
Quality Assurance & Compliance
1 170 (5.30%) NIST
2 140 (4.37%) Data Quality
3 138 (4.30%) QA
4 127 (3.96%) SOC 2
5 76 (2.37%) Accessibility
6 69 (2.15%) GDPR
7 58 (1.81%) ISO/IEC 27001
8 49 (1.53%) SLA
9 48 (1.50%) PCI DSS
10 37 (1.15%) Cyber Essentials
11 32 (1.00%) Sarbanes-Oxley
12 26 (0.81%) PMO
13 17 (0.53%) NCSC
14 14 (0.44%) COBIT
14 14 (0.44%) Cyber Essentials PLUS
15 10 (0.31%) GRC
16 5 (0.16%) ISO 9001
16 5 (0.16%) ISO/IEC 27002 (supersedes ISO/IEC 17799)
17 4 (0.12%) GxP
17 4 (0.12%) ISO 20022
System Software
1 241 (7.52%) Docker
2 142 (4.43%) Active Directory
3 52 (1.62%) Virtual Machines
4 45 (1.40%) RACF
5 44 (1.37%) Hyper-V
6 39 (1.22%) VMware Infrastructure
7 21 (0.66%) Virtual Desktop
8 9 (0.28%) Ceph
9 5 (0.16%) Firmware
10 4 (0.12%) Veritas Cluster Server
10 4 (0.12%) Virtual Servers
10 4 (0.12%) vSphere
11 3 (0.094%) GPFS
11 3 (0.094%) Lustre
11 3 (0.094%) Slurm Workload Manager
12 2 (0.062%) LXC
13 1 (0.031%) HDFS
13 1 (0.031%) Microsoft App-V
13 1 (0.031%) PowerHA
13 1 (0.031%) XenDesktop
Systems Management
1 152 (4.74%) Ansible
2 138 (4.30%) Kubernetes
3 130 (4.05%) Grafana
4 126 (3.93%) Prometheus
5 104 (3.24%) Terraform
6 19 (0.59%) SCCM
7 16 (0.50%) Puppet
8 13 (0.41%) EMC VPLEX
8 13 (0.41%) Istio
9 12 (0.37%) Single Sign-On
10 10 (0.31%) FortiGate
11 8 (0.25%) Microsoft Intune
12 7 (0.22%) CASB
13 6 (0.19%) Knative
14 4 (0.12%) Progress Chef
14 4 (0.12%) Proxmox
14 4 (0.12%) SCOM
15 3 (0.094%) McAfee ePO
15 3 (0.094%) NetBackup
15 3 (0.094%) Plesk
Vendors
1 522 (16.28%) Microsoft
2 143 (4.46%) SAP
3 124 (3.87%) Google
4 92 (2.87%) Oracle
5 78 (2.43%) Bloomberg
6 73 (2.28%) VMware
7 67 (2.09%) Salesforce
8 65 (2.03%) Cisco
9 51 (1.59%) CyberArk
10 49 (1.53%) TikTok
11 47 (1.47%) BISAM
12 44 (1.37%) Databricks
13 34 (1.06%) Hyperion
14 32 (1.00%) Red Hat
15 31 (0.97%) Anaplan
16 30 (0.94%) NEC
17 28 (0.87%) Juniper
18 25 (0.78%) Palo Alto
18 25 (0.78%) ServiceNow
19 23 (0.72%) IBM