Analytical Skills Jobs

Analytical Skills
UK

The table below looks at the prevalence of the term Analytical Skills in permanent job vacancies. Included is a benchmarking guide to the salaries offered in vacancies that cited Analytical Skills over the 6 months leading up to 31 October 2024, comparing them to the same period in the previous two years.

6 months to
31 Oct 2024
Same period 2023 Same period 2022
Rank 15 22 20
Rank change year-on-year +7 -2 +10
Permanent jobs citing Analytical Skills 6,891 5,186 14,030
As % of all permanent jobs advertised in the UK 9.07% 9.00% 10.11%
As % of the General category 15.36% 13.58% 14.80%
Number of salaries quoted 2,551 3,545 6,495
10th Percentile £31,500 £31,250 £30,625
25th Percentile £41,250 £41,500 £40,000
Median annual salary (50th Percentile) £55,000 £55,000 £55,000
Median % change year-on-year - - +4.76%
75th Percentile £70,250 £72,500 £72,500
90th Percentile £90,000 £90,000 £88,750
UK excluding London median annual salary £50,000 £50,000 £47,900
% change year-on-year - +4.38% +5.64%

All General Skills
UK

Analytical Skills falls under the General Skills category. For comparison with the information above, the following table provides summary statistics for all permanent job vacancies requiring common skills.

Permanent vacancies with a requirement for common skills 44,851 38,190 94,825
As % of all permanent jobs advertised in the UK 59.03% 66.30% 68.33%
Number of salaries quoted 19,760 26,451 50,742
10th Percentile £32,000 £31,250 £32,500
25th Percentile £42,500 £42,500 £44,250
Median annual salary (50th Percentile) £59,000 £60,000 £60,000
Median % change year-on-year -1.67% - +4.35%
75th Percentile £78,750 £80,000 £81,250
90th Percentile £100,000 £100,000 £100,000
UK excluding London median annual salary £51,000 £50,000 £52,500
% change year-on-year +2.00% -4.76% +10.53%

Analytical Skills
Job Vacancy Trend

Job postings citing Analytical Skills as a proportion of all IT jobs advertised.
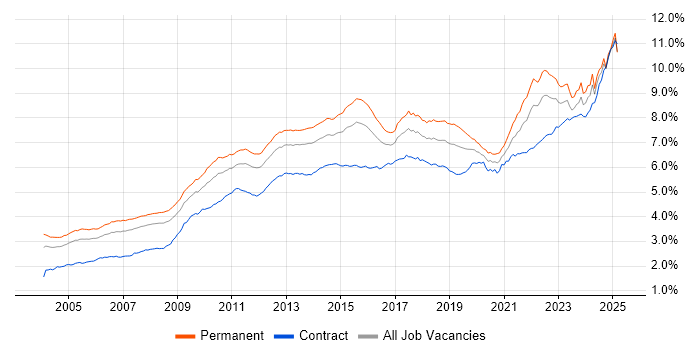
Job vacancy trend for Analytical Skills in the UK

Analytical Skills
Salary Trend

3-month moving average salary quoted in jobs citing Analytical Skills.

Salary trend for Analytical Skills in the UK

Analytical Skills
Salary Histogram

Salary distribution for jobs citing Analytical Skills over the 6 months to 31 October 2024.

Salary histogram for Analytical Skills in the UK

Analytical Skills
Top 19 Job Locations

The table below looks at the demand and provides a guide to the median salaries quoted in IT jobs citing Analytical Skills within the UK over the 6 months to 31 October 2024. The 'Rank Change' column provides an indication of the change in demand within each location based on the same 6 month period last year.

Location Rank Change
on Same Period
Last Year
Matching
Permanent
IT Job Ads
Median Salary
Past 6 Months
Median Salary
% Change
on Same Period
Last Year
Live
Jobs
England +5 6,081 £55,000 -3.93% 1,924
UK excluding London +11 4,371 £50,000 - 1,521
Work from Home +12 2,687 £55,213 -3.98% 954
London +3 2,300 £65,000 -7.14% 528
South East +11 1,047 £50,000 -0.99% 345
North of England +7 1,009 £50,000 - 426
Midlands 0 848 £50,000 - 321
North West +9 663 £50,000 - 264
South West +17 512 £52,750 +11.05% 152
West Midlands -6 496 £50,000 - 196
Scotland +23 492 £51,093 -11.14% 71
East Midlands +15 351 £45,000 -7.85% 124
East of England -3 326 £55,000 +10.00% 177
Yorkshire 0 267 £52,500 +1.94% 117
North East -3 79 £41,887 -1.20% 46
Wales -15 71 £45,000 +6.41% 36
Northern Ireland +27 42 £59,430 +40.54% 33
Channel Islands 0 16 £50,000 +6.38%
Isle of Man +4 14 £25,000 -44.44% 3

Analytical Skills
Co-occurring Skills and Capabilities by Category

The follow tables expand on the table above by listing co-occurrences grouped by category. The same employment type, locality and period is covered with up to 20 co-occurrences shown in each of the following categories:

Application Platforms
1 196 (2.84%) SharePoint
2 152 (2.21%) SAS
3 119 (1.73%) Confluence
4 96 (1.39%) Microsoft Exchange
5 90 (1.31%) Oracle Application Server
6 37 (0.54%) Apache Spark
6 37 (0.54%) IIS
7 30 (0.44%) CMS
8 26 (0.38%) Apache
9 25 (0.36%) Apache Airflow
10 21 (0.30%) Mule
11 15 (0.22%) WordPress
12 14 (0.20%) Oracle Collaboration Suite
13 10 (0.15%) SharePoint 2010
13 10 (0.15%) SharePoint 2013
13 10 (0.15%) Tomcat
14 9 (0.13%) Umbraco
15 8 (0.12%) nginx
15 8 (0.12%) Sitecore CMS
16 7 (0.10%) Kentico
Applications
1 1,026 (14.89%) Microsoft Excel
2 696 (10.10%) Microsoft Office
3 182 (2.64%) Microsoft PowerPoint
4 87 (1.26%) Microsoft Project
5 84 (1.22%) Chatbot
6 53 (0.77%) MS Visio
7 38 (0.55%) Photoshop
8 32 (0.46%) Abaqus
8 32 (0.46%) Mathcad
9 31 (0.45%) Adobe Illustrator
10 20 (0.29%) Simulink
11 18 (0.26%) AutoCAD
12 13 (0.19%) Spreadsheet
13 10 (0.15%) Trello
14 9 (0.13%) Weka
15 6 (0.087%) Adobe XD
16 5 (0.073%) SPSS
17 4 (0.058%) Revit
18 3 (0.044%) Sketch
19 2 (0.029%) Oracle Smart View
Business Applications
1 87 (1.26%) Oracle EBS
2 52 (0.75%) Dynamics CRM
3 49 (0.71%) NetSuite
4 45 (0.65%) SAP S/4HANA
5 36 (0.52%) Shopify
6 27 (0.39%) Oracle Receivables
7 26 (0.38%) OpenText VIM for SAP
8 25 (0.36%) NEC Housing
9 21 (0.30%) Magento
10 20 (0.29%) Dynamics NAV
10 20 (0.29%) Remedy ITSM
11 12 (0.17%) Dynamics AX
11 12 (0.17%) Oracle General Ledger
11 12 (0.17%) Oracle Payables
11 12 (0.17%) SAP Business One
12 11 (0.16%) Oracle Assets
12 11 (0.16%) Oracle Cash Management
13 10 (0.15%) Teamcenter
14 9 (0.13%) Primavera
14 9 (0.13%) SAP WM
Cloud Services
1 924 (13.41%) Azure
2 689 (10.00%) Power Platform
3 558 (8.10%) AWS
4 377 (5.47%) Microsoft 365
5 335 (4.86%) GCP
6 212 (3.08%) SaaS
7 149 (2.16%) Dynamics 365
8 148 (2.15%) Collibra
9 102 (1.48%) Entra ID
10 97 (1.41%) GitHub
11 94 (1.36%) Cloud Computing
12 90 (1.31%) PowerApps
13 89 (1.29%) Azure DevOps
14 86 (1.25%) Power Automate
15 85 (1.23%) Amazon CloudWatch
16 77 (1.12%) Amazon S3
16 77 (1.12%) Snowflake
17 69 (1.00%) IaaS
18 67 (0.97%) Azure Data Factory
19 65 (0.94%) PaaS
Communications & Networking
1 707 (10.26%) Broadband
2 188 (2.73%) Firewall
3 156 (2.26%) Intrusion Detection
4 131 (1.90%) DNS
5 95 (1.38%) WAN
6 87 (1.26%) Network Security
7 79 (1.15%) DHCP
8 77 (1.12%) TCP/IP
9 74 (1.07%) LAN
10 68 (0.99%) VPN
11 59 (0.86%) Internet
12 47 (0.68%) Wi-Fi
13 45 (0.65%) Wireless
14 44 (0.64%) SAN
14 44 (0.64%) Wireshark
15 38 (0.55%) HTTP
16 35 (0.51%) SSL
17 33 (0.48%) VLAN
18 29 (0.42%) SD-WAN
19 28 (0.41%) VoIP
Database & Business Intelligence
1 567 (8.23%) Power BI
2 385 (5.59%) Tableau
3 354 (5.14%) Data Warehouse
4 309 (4.48%) SQL Server
5 193 (2.80%) MySQL
6 189 (2.74%) Relational Database
7 176 (2.55%) Metadata
8 169 (2.45%) BigQuery
9 147 (2.13%) Data Hub
10 104 (1.51%) RDBMS
11 92 (1.34%) Enterprise Data Warehouse
12 83 (1.20%) Big Data
12 83 (1.20%) PostgreSQL
13 78 (1.13%) Data Mining
14 70 (1.02%) SQL Server Integration Services
15 66 (0.96%) NoSQL
16 65 (0.94%) Amazon QuickSight
17 64 (0.93%) Amazon Redshift
18 60 (0.87%) Data Lake
19 54 (0.78%) SQL Server Reporting Services
Development Applications
1 273 (3.96%) Git
2 254 (3.69%) JIRA
3 78 (1.13%) Jenkins
4 50 (0.73%) Selenium
5 34 (0.49%) Fiddler
6 32 (0.46%) Subversion
7 31 (0.45%) Dreamweaver
7 31 (0.45%) Visual Studio
8 26 (0.38%) Burp Suite
9 23 (0.33%) Metasploit
10 21 (0.30%) Cucumber
10 21 (0.30%) Cypress.io
11 20 (0.29%) Bitbucket
11 20 (0.29%) Rational DOORS
12 19 (0.28%) Postman
13 16 (0.23%) GitLab
13 16 (0.23%) PowerBuilder
13 16 (0.23%) SpecFlow
14 14 (0.20%) Oracle APEX
14 14 (0.20%) SonarQube
General
1 3,662 (53.14%) Social Skills
2 2,105 (30.55%) Finance
3 797 (11.57%) Marketing
4 728 (10.56%) Retail
5 566 (8.21%) Inclusion and Diversity
6 373 (5.41%) Organisational Skills
7 362 (5.25%) Influencing Skills
8 361 (5.24%) Presentation Skills
9 354 (5.14%) Legal
10 337 (4.89%) Banking
11 315 (4.57%) Manufacturing
12 301 (4.37%) Law
13 233 (3.38%) Telecoms
14 203 (2.95%) Pharmaceutical
15 194 (2.82%) Public Sector
16 193 (2.80%) Electronics
17 173 (2.51%) Games
18 127 (1.84%) Billing
19 99 (1.44%) Military
20 84 (1.22%) Advertising
Job Titles
1 1,823 (26.45%) Analyst
2 1,324 (19.21%) Senior
3 527 (7.65%) Developer
4 501 (7.27%) Senior Analyst
5 433 (6.28%) Lead
6 425 (6.17%) Architect
7 385 (5.59%) Data Analyst
8 338 (4.90%) Development Manager
9 281 (4.08%) Consultant
10 178 (2.58%) Business Analyst
11 155 (2.25%) Service Analyst
12 153 (2.22%) Team Leader
13 152 (2.21%) Senior Developer
14 148 (2.15%) Project Manager
15 137 (1.99%) Senior Manager
16 135 (1.96%) IT Manager
17 117 (1.70%) Software Engineer
18 115 (1.67%) Administrator
19 112 (1.63%) Financial Analyst
19 112 (1.63%) Security Architect
Libraries, Frameworks & Software Standards
1 382 (5.54%) HTML
2 246 (3.57%) .NET
3 224 (3.25%) CSS
4 132 (1.92%) Elastic Stack
5 129 (1.87%) XML
6 105 (1.52%) REST
7 102 (1.48%) React
8 73 (1.06%) RESTful
8 73 (1.06%) Web Services
9 70 (1.02%) ASP.NET
10 67 (0.97%) Spring
11 62 (0.90%) Vue
12 59 (0.86%) JSON
13 58 (0.84%) AngularJS
14 57 (0.83%) .NET Framework
15 56 (0.81%) Laravel
16 52 (0.75%) Spring Boot
17 46 (0.67%) CSS3
18 44 (0.64%) HTML5
19 42 (0.61%) .NET Core
Miscellaneous
1 469 (6.81%) Management Information System
2 442 (6.41%) Self-Motivation
3 335 (4.86%) Analytical Mindset
4 282 (4.09%) Onboarding
5 271 (3.93%) Social Media
6 147 (2.13%) Over-the-Top Content
7 141 (2.05%) Product Ownership
8 133 (1.93%) Private Cloud
9 130 (1.89%) Credit Risk
10 122 (1.77%) Algorithms
11 119 (1.73%) Cyberattack
12 92 (1.34%) Cyber Threat
13 87 (1.26%) Life Science
14 77 (1.12%) Data Structures
15 70 (1.02%) NHS
16 69 (1.00%) Legacy Systems
17 67 (0.97%) IoT
17 67 (0.97%) Virtual Team
18 64 (0.93%) Mobile App
19 63 (0.91%) Data Centre
Operating Systems
1 528 (7.66%) Windows
2 387 (5.62%) Linux
3 184 (2.67%) Windows Server
4 90 (1.31%) Unix
5 75 (1.09%) Windows 10
6 47 (0.68%) Android
7 31 (0.45%) Apple iOS
8 24 (0.35%) Mac OS
9 22 (0.32%) Ubuntu
10 20 (0.29%) Windows Vista
11 17 (0.25%) Windows Server 2019
12 15 (0.22%) Kali Linux
13 10 (0.15%) Windows Server 2012
13 10 (0.15%) Windows Server 2016
14 6 (0.087%) VMS
14 6 (0.087%) Windows 7
14 6 (0.087%) Windows Server 2008
15 5 (0.073%) Embedded Linux
15 5 (0.073%) FreeRTOS
16 3 (0.044%) AIX
Processes & Methodologies
1 3,655 (53.04%) Problem-Solving
2 1,605 (23.29%) Agile
3 1,214 (17.62%) Analytics
4 889 (12.90%) Continuous Improvement
5 870 (12.63%) Computer Science
6 839 (12.18%) Mentoring
7 829 (12.03%) Data Management
8 810 (11.75%) Project Management
9 781 (11.33%) Decision-Making
10 712 (10.33%) Business Intelligence
11 701 (10.17%) DevOps
12 607 (8.81%) Data Analysis
13 578 (8.39%) Logistics
14 557 (8.08%) Business Development
15 556 (8.07%) ITIL
16 531 (7.71%) Roadmaps
17 509 (7.39%) Customer Experience
18 497 (7.21%) Stakeholder Management
19 485 (7.04%) Customer Requirements
20 470 (6.82%) Risk Management
Programming Languages
1 1,412 (20.49%) SQL
2 984 (14.28%) Python
3 387 (5.62%) JavaScript
4 295 (4.28%) C#
5 247 (3.58%) R
6 233 (3.38%) Java
7 217 (3.15%) Bash
8 178 (2.58%) PowerShell
9 162 (2.35%) Shell Script
10 143 (2.08%) C++
11 103 (1.49%) C
12 100 (1.45%) T-SQL
13 98 (1.42%) VBA
14 84 (1.22%) PHP
15 83 (1.20%) TypeScript
16 71 (1.03%) MATLAB
17 69 (1.00%) PL/SQL
18 54 (0.78%) VB
19 50 (0.73%) Data Analysis Expressions
20 29 (0.42%) Perl
Qualifications
1 2,080 (30.18%) Degree
2 499 (7.24%) Computer Science Degree
2 499 (7.24%) Master's Degree
3 393 (5.70%) Security Cleared
4 191 (2.77%) DBS Check
5 188 (2.73%) SC Cleared
6 154 (2.23%) DV Cleared
7 124 (1.80%) CISSP
8 123 (1.78%) LPIC
8 123 (1.78%) RHCSA
9 120 (1.74%) PMI Certification
10 108 (1.57%) PMP
11 100 (1.45%) ACCA
11 100 (1.45%) Azure Certification
12 99 (1.44%) Microsoft Certification
13 88 (1.28%) CCA
14 79 (1.15%) CIMA
14 79 (1.15%) CISM
14 79 (1.15%) Numerate Degree
15 77 (1.12%) CFA
Quality Assurance & Compliance
1 395 (5.73%) Data Quality
2 365 (5.30%) QA
3 212 (3.08%) NIST
4 182 (2.64%) SLA
5 154 (2.23%) ISO/IEC 27001
6 134 (1.94%) SOC 2
7 128 (1.86%) GDPR
8 89 (1.29%) Accessibility
9 77 (1.12%) PMO
10 55 (0.80%) Cyber Essentials
11 41 (0.59%) PCI DSS
12 37 (0.54%) Sarbanes-Oxley
13 32 (0.46%) Cyber Essentials PLUS
13 32 (0.46%) GRC
14 31 (0.45%) ISO 9001
15 19 (0.28%) ISO 22301
16 17 (0.25%) HIPAA
17 16 (0.23%) Actionable Recommendations
17 16 (0.23%) NIST 800
18 14 (0.20%) NCSC
System Software
1 301 (4.37%) Active Directory
2 233 (3.38%) Docker
3 86 (1.25%) VMware Infrastructure
4 49 (0.71%) Hyper-V
5 37 (0.54%) Virtual Machines
6 35 (0.51%) Firmware
7 30 (0.44%) vSphere
8 28 (0.41%) Virtual Desktop
9 14 (0.20%) Virtual Servers
9 14 (0.20%) XenApp
10 13 (0.19%) XenDesktop
11 11 (0.16%) VMware ESXi
12 10 (0.15%) Embedded Firmware
13 6 (0.087%) RACF
13 6 (0.087%) VMware NSX
14 4 (0.058%) HDFS
14 4 (0.058%) Lustre
14 4 (0.058%) Slurm Workload Manager
15 3 (0.044%) Terminal Services
16 1 (0.015%) BitLocker
Systems Management
1 205 (2.97%) Grafana
2 178 (2.58%) Ansible
3 129 (1.87%) Prometheus
4 117 (1.70%) Terraform
5 105 (1.52%) Kubernetes
6 102 (1.48%) Microsoft Intune
7 47 (0.68%) SCCM
8 20 (0.29%) Nmap
8 20 (0.29%) Single Sign-On
9 19 (0.28%) Jamf Pro
10 17 (0.25%) Nessus
11 15 (0.22%) Puppet
12 14 (0.20%) Amdocs OSS
12 14 (0.20%) Nagios
13 13 (0.19%) vCenter Server
14 11 (0.16%) FortiGate
15 10 (0.15%) Autotask
16 8 (0.12%) Progress Chef
16 8 (0.12%) QRadar
17 7 (0.10%) Microsoft Clustering
Vendors
1 1,587 (23.03%) Microsoft
2 511 (7.42%) Oracle
3 233 (3.38%) SAP
4 232 (3.37%) Google
5 159 (2.31%) Informatica
6 144 (2.09%) Cloudera
7 141 (2.05%) Databricks
8 125 (1.81%) VMware
9 118 (1.71%) Salesforce
10 79 (1.15%) Cisco
11 66 (0.96%) ServiceNow
12 65 (0.94%) Citrix
13 61 (0.89%) IBM
14 48 (0.70%) HP
15 45 (0.65%) Adobe
16 42 (0.61%) NEC
17 37 (0.54%) Apple
18 33 (0.48%) SolarWinds
19 32 (0.46%) Dell
19 32 (0.46%) OpenText