Thought Leadership Job Trends

Thought Leadership
UK

The table below provides summary statistics and salary benchmarking for jobs requiring Thought Leadership skills. It covers permanent job vacancies from the 6 months leading up to 16 November 2025, with comparisons to the same periods in the previous two years.

6 months to
16 Nov 2025
Same period 2024 Same period 2023
Rank 276 456 268
Rank change year-on-year +180 -188 -46
Permanent jobs citing Thought Leadership 494 321 657
As % of all permanent jobs in the UK 0.94% 0.47% 1.23%
As % of the Processes & Methodologies category 1.09% 0.57% 1.32%
Number of salaries quoted 150 144 373
10th Percentile £39,975 £50,250 £63,750
25th Percentile £58,750 £65,000 £75,208
Median annual salary (50th Percentile) £80,000 £80,000 £82,500
Median % change year-on-year - -3.03% -2.94%
75th Percentile £112,500 £100,000 £97,290
90th Percentile £122,500 £110,000 £117,500
UK excluding London median annual salary £62,500 £80,000 £79,632
% change year-on-year -21.88% +0.46% +9.84%

All Process and Methodology Skills
UK

Thought Leadership falls under the Processes and Methodologies category. For comparison with the information above, the following table provides summary statistics for all permanent job vacancies requiring process or methodology skills.

Permanent vacancies with a requirement for process or methodology skills 45,350 56,347 49,907
As % of all permanent jobs advertised in the UK 86.07% 83.11% 93.80%
Number of salaries quoted 27,263 29,385 38,254
10th Percentile £28,250 £34,112 £32,500
25th Percentile £35,750 £45,000 £43,750
Median annual salary (50th Percentile) £55,000 £60,000 £60,000
Median % change year-on-year -8.33% - -
75th Percentile £75,000 £79,600 £80,000
90th Percentile £95,000 £97,500 £98,750
UK excluding London median annual salary £47,500 £54,714 £52,500
% change year-on-year -13.18% +4.22% -

Thought Leadership
Job Vacancy Trend

Historical trend showing the proportion of permanent IT job postings citing Thought Leadership relative to all permanent IT jobs advertised.
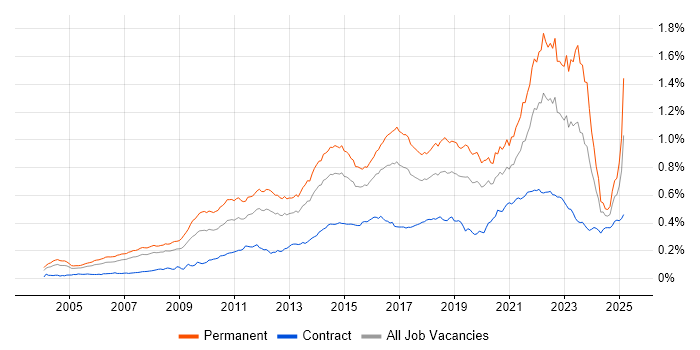
Thought Leadership job vacancy trend in the UK

Thought Leadership
Salary Trend

Salary distribution trend for jobs in the UK citing Thought Leadership.

Salary distribution trend for jobs in the UK citing Thought Leadership

Thought Leadership
Salary Histogram

Salary distribution for jobs citing Thought Leadership over the 6 months to 16 November 2025.

Salary histogram for Thought Leadership in the UK

Thought Leadership
Top 16 Job Locations

The table below looks at the demand and provides a guide to the median salaries quoted in IT jobs citing Thought Leadership within the UK over the 6 months to 16 November 2025. The 'Rank Change' column provides an indication of the change in demand within each location based on the same 6 month period last year.

Location Rank Change
on Same Period
Last Year
Matching
Permanent
IT Job Ads
Median Salary
Past 6 Months
Median Salary
% Change
on Same Period
Last Year
Live
Jobs
England +213 462 £80,000 - 765
London +178 330 £100,000 +18.57% 472
UK excluding London +76 135 £62,500 -21.88% 325
Work from Home +70 81 £56,250 -31.82% 348
South East +65 65 £35,000 -53.33% 157
North of England +43 21 £65,000 -7.14% 75
North West +54 18 £56,250 -40.56% 42
Midlands +54 15 £87,500 +34.62% 35
Scotland -27 12 £68,500 -31.50% 18
West Midlands +49 11 £67,500 +3.85% 23
South West +31 10 £61,920 -22.60% 20
East of England +4 9 £45,500 -49.30% 16
Yorkshire +11 3 £75,000 +20.00% 21
East Midlands +26 2 £100,000 +50.94% 12
Northern Ireland - 2 - - 2
Wales - 1 £47,500 - 4

Thought Leadership
Co-Occurring Skills & Capabilities by Category

The following tables expand on the one above by listing co-occurrences grouped by category. They cover the same employment type, locality and period, with up to 20 co-occurrences shown in each category:

Application Platforms
1 14 (2.83%) Apache Spark
2 5 (1.01%) WordPress
3 4 (0.81%) Apache Airflow
3 4 (0.81%) CMS
3 4 (0.81%) nginx
3 4 (0.81%) Oracle SOA Suite
4 2 (0.40%) SharePoint
5 1 (0.20%) CICS
5 1 (0.20%) Confluence
5 1 (0.20%) Microsoft Exchange
5 1 (0.20%) WebLogic
5 1 (0.20%) WebSphere
Applications
1 12 (2.43%) Microsoft Excel
2 11 (2.23%) Maya
2 11 (2.23%) Microsoft PowerPoint
3 7 (1.42%) Microsoft Office
4 5 (1.01%) Adobe Creative Suite
5 4 (0.81%) Chatbot
5 4 (0.81%) Photoshop
6 3 (0.61%) Adobe Illustrator
6 3 (0.61%) Elementor
7 2 (0.40%) Adobe After Effects
7 2 (0.40%) Adobe Premiere
8 1 (0.20%) Adobe XD
8 1 (0.20%) InVision
8 1 (0.20%) Sketch
Business Applications
1 33 (6.68%) SAP S/4HANA
2 8 (1.62%) Dynamics CRM
3 7 (1.42%) Endur
3 7 (1.42%) SAP SCM
4 4 (0.81%) Payment Gateway
4 4 (0.81%) SAP EWM
5 3 (0.61%) SAP CO
5 3 (0.61%) SAP ERP
5 3 (0.61%) SAP FI
5 3 (0.61%) SAP FI/CO
5 3 (0.61%) SAP IBP
5 3 (0.61%) SAP MDG
5 3 (0.61%) SAP PP
6 2 (0.40%) SAP APO
6 2 (0.40%) SAP FSCM
6 2 (0.40%) SAP MM
6 2 (0.40%) SAP Oil and Gas
6 2 (0.40%) SAP QM
6 2 (0.40%) SAP WM
6 2 (0.40%) Shopify
Cloud Services
1 109 (22.06%) Azure
2 94 (19.03%) AWS
3 36 (7.29%) GCP
4 35 (7.09%) SaaS
5 25 (5.06%) Amazon Bedrock
5 25 (5.06%) Vertex AI
6 22 (4.45%) Power Platform
7 15 (3.04%) GitHub
8 14 (2.83%) Azure Synapse Analytics
8 14 (2.83%) Cloud Computing
8 14 (2.83%) Snowflake
9 13 (2.63%) Azure DevOps
10 10 (2.02%) Serverless
11 9 (1.82%) OCI
12 7 (1.42%) Dynamics 365
13 6 (1.21%) Azure Machine Learning
14 5 (1.01%) GitHub Actions
14 5 (1.01%) Google Ads
14 5 (1.01%) IaaS
14 5 (1.01%) Microsoft 365
Communications & Networking
1 5 (1.01%) DNS
2 4 (0.81%) F5 BIG-IP LTM
2 4 (0.81%) Network Security
3 1 (0.20%) BGP
3 1 (0.20%) Firewall
3 1 (0.20%) LAN
3 1 (0.20%) MPLS
3 1 (0.20%) Software-Defined Networking
3 1 (0.20%) SSH
3 1 (0.20%) TCP/IP
3 1 (0.20%) WAN
3 1 (0.20%) Wireless
Database & Business Intelligence
1 31 (6.28%) Data Lake
1 31 (6.28%) NoSQL
2 29 (5.87%) Data Warehouse
3 23 (4.66%) Metadata
4 21 (4.25%) Power BI
5 17 (3.44%) Big Data
6 14 (2.83%) Hadoop
7 13 (2.63%) Amazon Redshift
8 6 (1.21%) Tableau
9 5 (1.01%) BigQuery
9 5 (1.01%) MongoDB
10 4 (0.81%) DataStage
10 4 (0.81%) QlikView
11 3 (0.61%) DynamoDB
11 3 (0.61%) Looker
11 3 (0.61%) Relational Database
11 3 (0.61%) SQL Server
12 2 (0.40%) Oracle Reports
12 2 (0.40%) PostgreSQL
12 2 (0.40%) SAP HANA
Development Applications
1 15 (3.04%) ERwin
2 10 (2.02%) JIRA
3 6 (1.21%) GitLab
4 4 (0.81%) ER Studio
4 4 (0.81%) PowerDesigner
5 3 (0.61%) eCATT
5 3 (0.61%) MLflow
6 2 (0.40%) Git
6 2 (0.40%) Jenkins
7 1 (0.20%) Axure RP
7 1 (0.20%) SonarQube
7 1 (0.20%) Vite
7 1 (0.20%) WaveMaker
General
1 172 (34.82%) Social Skills
2 166 (33.60%) Analytical Skills
3 162 (32.79%) Finance
4 141 (28.54%) Law
5 106 (21.46%) Marketing
6 49 (9.92%) Retail
7 46 (9.31%) Games
7 46 (9.31%) Presentation Skills
8 45 (9.11%) Influencing Skills
9 37 (7.49%) Banking
10 33 (6.68%) Public Sector
11 24 (4.86%) Legal
11 24 (4.86%) Pharmaceutical
12 20 (4.05%) Advertising
13 15 (3.04%) Inclusion and Diversity
14 14 (2.83%) Manufacturing
15 10 (2.02%) Publishing
16 8 (1.62%) Billing
16 8 (1.62%) Dutch Language
16 8 (1.62%) Financial Institution
Job Titles
1 119 (24.09%) Senior
2 92 (18.62%) Lead
3 80 (16.19%) Architect
4 63 (12.75%) Consultant
5 42 (8.50%) Senior Consultant
6 39 (7.89%) Solutions Architect
7 25 (5.06%) Gen AI Consultant
8 24 (4.86%) Artificial Intelligence Engineer
9 23 (4.66%) Account Executive
10 22 (4.45%) Lead Architect
11 19 (3.85%) Product Lead
12 18 (3.64%) Data Architect
13 16 (3.24%) IT Manager
13 16 (3.24%) Marketing Manager
14 15 (3.04%) Senior Manager
15 14 (2.83%) Data Scientist
15 14 (2.83%) Senior Architect
16 13 (2.63%) SAP Consultant
16 13 (2.63%) ServiceNow Architect
17 12 (2.43%) Senior Solutions Architect
Libraries, Frameworks & Software Standards
1 27 (5.47%) LangChain
2 17 (3.44%) React
3 15 (3.04%) REST
4 13 (2.63%) Kafka
5 10 (2.02%) AngularJS
6 8 (1.62%) .NET
7 7 (1.42%) Vue
8 6 (1.21%) Oracle Fusion
9 5 (1.01%) ASP.NET
9 5 (1.01%) Hugging Face
9 5 (1.01%) JSON
9 5 (1.01%) XML
10 4 (0.81%) Middleware
10 4 (0.81%) SAP Fiori
11 3 (0.61%) .NET Framework
11 3 (0.61%) CSS
11 3 (0.61%) HTML
11 3 (0.61%) SAPUI5
12 2 (0.40%) PyTorch
12 2 (0.40%) TensorFlow
Miscellaneous
1 44 (8.91%) Algorithms
2 38 (7.69%) Analytical Mindset
2 38 (7.69%) Legacy Systems
3 37 (7.49%) Product Ownership
4 31 (6.28%) Self-Motivation
5 25 (5.06%) Enterprise Software
5 25 (5.06%) Virtual Team
6 23 (4.66%) Life Science
7 21 (4.25%) FMCG
8 18 (3.64%) Management Information System
8 18 (3.64%) Onboarding
8 18 (3.64%) Social Media
9 13 (2.63%) Blog
10 12 (2.43%) Cloud Native
11 11 (2.23%) Data Structures
11 11 (2.23%) Digital Media
12 8 (1.62%) Blockchain
12 8 (1.62%) Web Conferencing
13 7 (1.42%) Low-Code
13 7 (1.42%) Public Cloud
Operating Systems
1 1 (0.20%) Android
1 1 (0.20%) Apple iOS
1 1 (0.20%) Linux
1 1 (0.20%) Solaris
1 1 (0.20%) Unix
Processes & Methodologies
1 199 (40.28%) AI
2 185 (37.45%) Roadmaps
3 184 (37.25%) Analytics
4 151 (30.57%) Agile
5 126 (25.51%) Machine Learning
6 107 (21.66%) Problem-Solving
7 93 (18.83%) Business Strategy
7 93 (18.83%) Computer Science
8 92 (18.62%) Decision-Making
9 88 (17.81%) Business Development
10 80 (16.19%) Generative AI
11 78 (15.79%) Data Science
12 75 (15.18%) Stakeholder Management
13 74 (14.98%) Project Management
14 70 (14.17%) DevOps
14 70 (14.17%) IT Strategy
15 69 (13.97%) Mentoring
16 57 (11.54%) Enterprise Architecture
17 55 (11.13%) B2B
18 50 (10.12%) Coaching
Programming Languages
1 57 (11.54%) Python
2 32 (6.48%) SQL
3 18 (3.64%) JavaScript
4 11 (2.23%) Java
5 7 (1.42%) C#
6 4 (0.81%) C++
7 3 (0.61%) PowerShell
8 2 (0.40%) Bash
8 2 (0.40%) Scala
8 2 (0.40%) TypeScript
9 1 (0.20%) Bicep
9 1 (0.20%) Bourne shell
9 1 (0.20%) C-shell
9 1 (0.20%) Kotlin
9 1 (0.20%) Perl
9 1 (0.20%) Ruby
9 1 (0.20%) Shell Script
Qualifications
1 175 (35.43%) Degree
2 69 (13.97%) Master's Degree
3 57 (11.54%) Computer Science Degree
4 52 (10.53%) PhD
5 16 (3.24%) Security Cleared
6 11 (2.23%) SC Cleared
7 9 (1.82%) PMI Certification
7 9 (1.82%) PMP
7 9 (1.82%) TOGAF Certification
8 8 (1.62%) Azure Certification
8 8 (1.62%) DBS Check
9 7 (1.42%) CISSP
10 6 (1.21%) Cisco Certification
10 6 (1.21%) SAP Certification
11 5 (1.01%) CISM
11 5 (1.01%) MBA
12 4 (0.81%) AWS Certification
12 4 (0.81%) CCNA
12 4 (0.81%) CCNP
12 4 (0.81%) CISA
Quality Assurance & Compliance
1 27 (5.47%) QA
2 26 (5.26%) Data Quality
3 22 (4.45%) GDPR
4 20 (4.05%) GxP
5 12 (2.43%) Accessibility
6 10 (2.02%) PMO
7 8 (1.62%) SLA
8 7 (1.42%) EMIR
9 4 (0.81%) ISO/IEC 27001
10 3 (0.61%) Actionable Recommendations
10 3 (0.61%) NIST
11 2 (0.40%) California Consumer Privacy Act
11 2 (0.40%) GRC
11 2 (0.40%) ISO/IEC 27002 (supersedes ISO/IEC 17799)
11 2 (0.40%) NIST 800
11 2 (0.40%) PCI DSS
11 2 (0.40%) WCAG
12 1 (0.20%) GMP
12 1 (0.20%) HIPAA
12 1 (0.20%) NCSC
System Software
1 8 (1.62%) Docker
2 1 (0.20%) RACF
2 1 (0.20%) Virtual Machines
2 1 (0.20%) VMware Infrastructure
Systems Management
1 25 (5.06%) Terraform
2 12 (2.43%) Kubernetes
3 4 (0.81%) Ansible
4 2 (0.40%) Grafana
5 1 (0.20%) Oracle ZFS
5 1 (0.20%) Prometheus
5 1 (0.20%) VxRail
Vendors
1 49 (9.92%) Google
2 40 (8.10%) SAP
3 36 (7.29%) Microsoft
4 27 (5.47%) Databricks
5 22 (4.45%) Oracle
6 18 (3.64%) Adobe
7 16 (3.24%) ServiceNow
8 15 (3.04%) Dell
9 9 (1.82%) OpenAI
9 9 (1.82%) TikTok
10 8 (1.62%) Foundry
11 7 (1.42%) OpenLink
12 6 (1.21%) Palantir
13 5 (1.01%) F5
13 5 (1.01%) HubSpot
13 5 (1.01%) IBM
13 5 (1.01%) Salesforce
14 4 (0.81%) Cognizant
14 4 (0.81%) Facebook
14 4 (0.81%) Informatica