Azure Contracts in Central London

Microsoft Azure
London > Central London

The following table provides summary statistics for contract job vacancies advertised in Central London with a requirement for Azure skills. Included is a benchmarking guide to the contractor rates offered in vacancies that have cited Azure over the 6 months to 15 May 2024 with a comparison to the same period in the previous 2 years.

6 months to
15 May 2024
Same period 2023 Same period 2022
Rank 4 5 6
Rank change year-on-year +1 +1 -2
Contract jobs citing Azure 463 668 770
As % of all contract jobs advertised in Central London 19.31% 17.89% 16.98%
As % of the Cloud Services category 48.38% 46.42% 38.97%
Number of daily rates quoted 315 419 610
10th Percentile £390 £400 £413
25th Percentile £459 £483 £500
Median daily rate (50th Percentile) £550 £575 £575
Median % change year-on-year -4.35% - +4.55%
75th Percentile £675 £725 £655
90th Percentile £775 £803 £750
London median daily rate £550 £600 £600
% change year-on-year -8.33% - +14.29%
Number of hourly rates quoted 1 2 3
10th Percentile - £54.25 £24.12
25th Percentile £22.50 £58.75 £30.64
Median hourly rate £23.00 £67.50 £41.50
Median % change year-on-year -65.93% +62.65% +43.10%
75th Percentile £23.50 £76.25 £92.00
90th Percentile - £80.75 £122.30
London median hourly rate £23.40 £40.00 £44.40
% change year-on-year -41.50% -9.91% -22.11%

All Cloud Skills
Central London

Azure is in the Cloud Services category. The following table is for comparison with the above and provides summary statistics for all contract job vacancies advertised in Central London with a requirement for cloud computing skills.

Contract vacancies with a requirement for cloud computing skills 957 1,439 1,976
As % of all contract IT jobs advertised in Central London 39.91% 38.54% 43.57%
Number of daily rates quoted 683 978 1,590
10th Percentile £350 £300 £374
25th Percentile £425 £454 £475
Median daily rate (50th Percentile) £525 £575 £575
Median % change year-on-year -8.70% - +9.52%
75th Percentile £650 £700 £688
90th Percentile £760 £800 £763
London median daily rate £550 £588 £575
% change year-on-year -6.38% +2.17% +9.52%
Number of hourly rates quoted 7 8 12
10th Percentile £12.75 £32.00 -
25th Percentile £17.00 £47.19 £13.88
Median hourly rate £22.50 £83.30 £22.34
Median % change year-on-year -72.99% +272.81% -0.70%
75th Percentile £25.38 £88.30 £31.19
90th Percentile £36.30 - £49.15
London median hourly rate £26.00 £52.50 £40.25
% change year-on-year -50.48% +30.43% +20.15%

Azure
Job Vacancy Trend in Central London

Job postings citing Azure as a proportion of all IT jobs advertised in Central London.
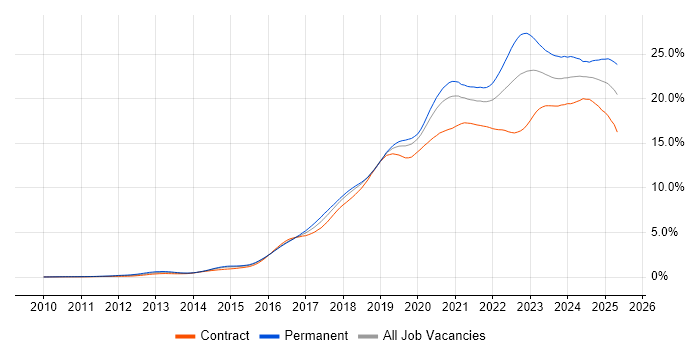
Job vacancy trend for Azure in Central London

Azure
Contractor Daily Rate Trend in Central London

3-month moving average daily rate quoted in jobs citing Azure in Central London.

Daily rate trend for Azure in Central London

Azure
Daily Rate Histogram in Central London

Daily rate distribution for jobs citing Azure in Central London over the 6 months to 15 May 2024.

Daily rate histogram for Azure in Central London

Azure
Contractor Hourly Rate Trend in Central London

3-month moving average hourly rates quoted in jobs citing Azure in Central London.

Hourly rate trend for Azure in Central London

Azure
Contract Job Locations in Central London

The table below looks at the demand and provides a guide to the median contractor rates quoted in IT jobs citing Azure within the Central London region over the 6 months to 15 May 2024. The 'Rank Change' column provides an indication of the change in demand within each location based on the same 6 month period last year.

Location Rank Change
on Same Period
Last Year
Matching
Contract
IT Job Ads
Median
Daily Rate
Past 6 Months
Median Daily Rate
% Change
on Same Period
Last Year
Live
Jobs
City of London +1 425 £550 -4.35% 158
West End of London -4 4 £535 -10.83% 7
Camden 0 3 £650 +100.00% 8
City of Westminster -6 2 £550 +37.50% 6
Azure
London

Azure
Co-occurring Skills and Capabilities in Central London by Category

The follow tables expand on the table above by listing co-occurrences grouped by category. The same employment type, locality and period is covered with up to 20 co-occurrences shown in each of the following categories:

Application Platforms
1 39 (8.42%) Microsoft Exchange
2 33 (7.13%) SharePoint
3 13 (2.81%) Confluence
4 9 (1.94%) Apache
4 9 (1.94%) IIS
5 6 (1.30%) Apache Spark
5 6 (1.30%) BizTalk Server
6 4 (0.86%) Site Server
7 3 (0.65%) CMS
8 2 (0.43%) JBoss
8 2 (0.43%) Luigi
8 2 (0.43%) nginx
8 2 (0.43%) Tomcat
9 1 (0.22%) Apache Airflow
9 1 (0.22%) Jupyter
9 1 (0.22%) NServiceBus
9 1 (0.22%) Oracle Self-Service HR
9 1 (0.22%) Oracle SOA Suite
9 1 (0.22%) Sitecore CMS
9 1 (0.22%) Tornado
Applications
1 6 (1.30%) Microsoft Office
2 4 (0.86%) Chatbot
3 2 (0.43%) MS Visio
4 1 (0.22%) Microsoft Excel
4 1 (0.22%) Microsoft PowerPoint
Business Applications
1 14 (3.02%) Dynamics CRM
2 8 (1.73%) Dynamics AX
3 2 (0.43%) Primavera
3 2 (0.43%) Temenos T24
4 1 (0.22%) BusinessWorks
4 1 (0.22%) Endur
4 1 (0.22%) Infor SunSystems
4 1 (0.22%) NetSuite
4 1 (0.22%) Oracle EBS
Cloud Services
1 112 (24.19%) Azure DevOps
2 98 (21.17%) AWS
3 74 (15.98%) Microsoft 365
4 64 (13.82%) Power Platform
5 60 (12.96%) Entra ID
6 35 (7.56%) Dynamics 365
6 35 (7.56%) GCP
7 29 (6.26%) GitHub
8 28 (6.05%) Power Automate
8 28 (6.05%) PowerApps
9 26 (5.62%) Azure Service Bus
9 26 (5.62%) Serverless
10 21 (4.54%) Azure Functions
11 20 (4.32%) Azure Cosmos DB
12 19 (4.10%) IaaS
13 16 (3.46%) Azure Monitor
14 15 (3.24%) Mimecast
15 14 (3.02%) Azure Data Factory
15 14 (3.02%) OneDrive
16 13 (2.81%) GitHub Actions
Communications & Networking
1 34 (7.34%) Firewall
2 20 (4.32%) DNS
3 10 (2.16%) Network Security
4 7 (1.51%) DHCP
4 7 (1.51%) Internet
5 6 (1.30%) LAN
5 6 (1.30%) MPLS
5 6 (1.30%) VPN
5 6 (1.30%) WAN
6 4 (0.86%) NetScaler
6 4 (0.86%) SD-WAN
7 3 (0.65%) SAN
7 3 (0.65%) TCP/IP
7 3 (0.65%) Wi-Fi
7 3 (0.65%) Wireless
8 2 (0.43%) CTI
8 2 (0.43%) HTTP
8 2 (0.43%) NAS
8 2 (0.43%) SSL
8 2 (0.43%) VoIP
Database & Business Intelligence
1 69 (14.90%) SQL Server
2 42 (9.07%) Power BI
3 30 (6.48%) NoSQL
4 26 (5.62%) Data Lake
5 22 (4.75%) Data Warehouse
6 17 (3.67%) Azure SQL Database
7 14 (3.02%) PostgreSQL
8 10 (2.16%) MongoDB
8 10 (2.16%) MySQL
9 7 (1.51%) Big Data
9 7 (1.51%) Relational Database
10 6 (1.30%) Redis
11 5 (1.08%) Amazon RDS
12 4 (0.86%) Delta Lake
12 4 (0.86%) DynamoDB
12 4 (0.86%) GIS
12 4 (0.86%) Parquet
12 4 (0.86%) Power Query
12 4 (0.86%) RDBMS
13 3 (0.65%) Data Mart
Development Applications
1 27 (5.83%) Git
2 14 (3.02%) GitLab
3 13 (2.81%) JIRA
4 11 (2.38%) Jenkins
4 11 (2.38%) Visual Studio
5 10 (2.16%) SpecFlow
6 8 (1.73%) Selenium
7 7 (1.51%) JMeter
8 6 (1.30%) CircleCI
8 6 (1.30%) Cypress.io
9 5 (1.08%) SonarQube
10 4 (0.86%) Mercurial
10 4 (0.86%) Postman
10 4 (0.86%) TeamCity
11 3 (0.65%) WebDriver
12 2 (0.43%) Deequ
12 2 (0.43%) Subversion
13 1 (0.22%) AppScan
13 1 (0.22%) Jaeger
13 1 (0.22%) Maven
General
1 123 (26.57%) Finance
2 112 (24.19%) Social Skills
3 43 (9.29%) Banking
4 41 (8.86%) Public Sector
5 27 (5.83%) Analytical Skills
6 20 (4.32%) Presentation Skills
7 16 (3.46%) Retail
8 15 (3.24%) Documentation Skills
9 12 (2.59%) Financial Institution
10 11 (2.38%) Investment Banking
11 10 (2.16%) Legal
12 8 (1.73%) Back Office
12 8 (1.73%) General Ledger
13 7 (1.51%) French Language
13 7 (1.51%) Front Office
13 7 (1.51%) Marketing
14 5 (1.08%) Local Government
14 5 (1.08%) Telecoms
15 3 (0.65%) Inclusion and Diversity
15 3 (0.65%) Influencing Skills
Job Titles
1 109 (23.54%) Developer
2 76 (16.41%) Architect
3 56 (12.10%) Senior
4 32 (6.91%) Analyst
5 30 (6.48%) Consultant
6 29 (6.26%) Full Stack Developer
7 28 (6.05%) Lead
8 27 (5.83%) Senior Developer
9 25 (5.40%) Azure Engineer
10 18 (3.89%) Azure Developer
10 18 (3.89%) Data Engineer
10 18 (3.89%) Solutions Architect
11 17 (3.67%) Azure Architect
11 17 (3.67%) Infrastructure Engineer
12 15 (3.24%) Software Developer
13 13 (2.81%) DevOps Engineer
13 13 (2.81%) Product Owner
14 12 (2.59%) Software Engineer
15 11 (2.38%) .NET Developer
15 11 (2.38%) C# Developer
Libraries, Frameworks & Software Standards
1 79 (17.06%) .NET
2 27 (5.83%) XML
3 26 (5.62%) .NET Core
4 25 (5.40%) REST
5 23 (4.97%) .NET Framework
5 23 (4.97%) React
6 22 (4.75%) HTML
7 21 (4.54%) ASP.NET
8 18 (3.89%) Web Services
9 17 (3.67%) CSS
9 17 (3.67%) Kafka
10 14 (3.02%) JSON
11 11 (2.38%) Node.js
12 10 (2.16%) Microsoft Graph
13 9 (1.94%) ASP.NET Core
13 9 (1.94%) Blazor
13 9 (1.94%) PySpark
13 9 (1.94%) RESTful
13 9 (1.94%) Svelte
14 8 (1.73%) SAML
Miscellaneous
1 30 (6.48%) Product Ownership
2 13 (2.81%) Management Information System
2 13 (2.81%) Public Cloud
3 12 (2.59%) Data Centre
4 11 (2.38%) Cloud Native
5 9 (1.94%) Data Structures
6 8 (1.73%) Enterprise Software
6 8 (1.73%) Legacy Systems
7 7 (1.51%) Distributed Systems
7 7 (1.51%) PKI
7 7 (1.51%) Security Posture
8 5 (1.08%) Foreign Exchange (FX)
8 5 (1.08%) Mobile App
9 4 (0.86%) Contactless
9 4 (0.86%) Cyber Threat
9 4 (0.86%) Derivative
9 4 (0.86%) Enterprise Cloud
9 4 (0.86%) Hedge funds
9 4 (0.86%) Linux Command Line
9 4 (0.86%) Wiki
Operating Systems
1 70 (15.12%) Windows
2 28 (6.05%) Linux
3 22 (4.75%) Windows Server
4 8 (1.73%) Windows 10
5 5 (1.08%) Mac OS
5 5 (1.08%) Unix
6 3 (0.65%) Red Hat Enterprise Linux
6 3 (0.65%) Windows Server 2016
7 2 (0.43%) Mac OS X
7 2 (0.43%) Windows Server 2012
7 2 (0.43%) Windows Server 2019
8 1 (0.22%) Ubuntu
8 1 (0.22%) VMS
8 1 (0.22%) Windows 7
Processes & Methodologies
1 156 (33.69%) DevOps
2 154 (33.26%) Agile
3 75 (16.20%) CI/CD
4 60 (12.96%) Migration
5 54 (11.66%) Problem-Solving
6 52 (11.23%) Scrum
7 47 (10.15%) Business Intelligence
8 41 (8.86%) Software Engineering
9 38 (8.21%) Analytics
10 34 (7.34%) Stakeholder Management
11 32 (6.91%) Full Stack Development
12 30 (6.48%) Data Modelling
13 29 (6.26%) Infrastructure Engineering
14 28 (6.05%) Cybersecurity
15 27 (5.83%) Computer Science
16 25 (5.40%) Data Loss Prevention
16 25 (5.40%) SDLC
17 24 (5.18%) Project Management
18 23 (4.97%) Continuous Improvement
18 23 (4.97%) Infrastructure as Code
Programming Languages
1 91 (19.65%) SQL
2 80 (17.28%) PowerShell
3 78 (16.85%) Python
4 74 (15.98%) C#
5 30 (6.48%) JavaScript
6 23 (4.97%) Java
7 20 (4.32%) Bicep
8 12 (2.59%) C++
9 11 (2.38%) T-SQL
10 8 (1.73%) Go
11 7 (1.51%) TypeScript
12 6 (1.30%) PL/SQL
13 5 (1.08%) Data Analysis Expressions
14 4 (0.86%) Bash
14 4 (0.86%) Korn
14 4 (0.86%) R
14 4 (0.86%) Rust
14 4 (0.86%) Scala
14 4 (0.86%) Shell Script
15 1 (0.22%) Ruby
Qualifications
1 52 (11.23%) Degree
2 21 (4.54%) Azure Certification
3 20 (4.32%) Computer Science Degree
4 15 (3.24%) Security Cleared
5 11 (2.38%) SC Cleared
6 9 (1.94%) CISSP
6 9 (1.94%) ITIL Certification
6 9 (1.94%) Microsoft Certification
7 6 (1.30%) Cisco Certification
8 5 (1.08%) CISM
8 5 (1.08%) Master's Degree
8 5 (1.08%) TOGAF Certification
9 4 (0.86%) (ISC)2 CCSP
10 3 (0.65%) AWS Certification
10 3 (0.65%) CCSK
10 3 (0.65%) CRISC
11 2 (0.43%) AWS Certified Solutions Architect
11 2 (0.43%) CIMA
11 2 (0.43%) CompTIA Security+
11 2 (0.43%) SANS
Quality Assurance & Compliance
1 13 (2.81%) QA
2 12 (2.59%) NIST
3 10 (2.16%) Data Quality
4 8 (1.73%) ISO/IEC 27001
4 8 (1.73%) PCI DSS
4 8 (1.73%) SLA
5 7 (1.51%) GDPR
6 5 (1.08%) WCAG
7 4 (0.86%) Accessibility
7 4 (0.86%) NCSC
8 3 (0.65%) HIPAA
8 3 (0.65%) ISO 31000
8 3 (0.65%) NIST 800
8 3 (0.65%) PMO
9 2 (0.43%) Cyber Essentials
9 2 (0.43%) ISO 20022
9 2 (0.43%) ISO 22301
9 2 (0.43%) ISO/IEC 20000
9 2 (0.43%) SOC 2
System Software
1 77 (16.63%) Active Directory
2 32 (6.91%) Docker
3 15 (3.24%) VMware Infrastructure
4 13 (2.81%) Virtual Machines
5 7 (1.51%) Hyper-V
6 3 (0.65%) Virtual Desktop
7 2 (0.43%) XenApp
8 1 (0.22%) Ceph
8 1 (0.22%) KVM
8 1 (0.22%) NFS
8 1 (0.22%) VMware NSX
8 1 (0.22%) vSphere
Systems Management
1 48 (10.37%) Kubernetes
2 35 (7.56%) Terraform
3 32 (6.91%) Microsoft Intune
4 9 (1.94%) Ansible
4 9 (1.94%) PingFederate
4 9 (1.94%) SCCM
5 6 (1.30%) Active Directory Federation Services
5 6 (1.30%) Argo
5 6 (1.30%) Puppet
5 6 (1.30%) Single Sign-On
6 5 (1.08%) Progress Chef
7 4 (0.86%) Grafana
7 4 (0.86%) Jamf Pro
8 3 (0.65%) FortiGate
8 3 (0.65%) Nagios
8 3 (0.65%) Prometheus
9 2 (0.43%) Graylog
10 1 (0.22%) Hadoop YARN
10 1 (0.22%) logstash
10 1 (0.22%) Mesos
Vendors
1 180 (38.88%) Microsoft
2 36 (7.78%) Oracle
3 29 (6.26%) Databricks
4 22 (4.75%) VMware
5 17 (3.67%) Citrix
6 13 (2.81%) Google
7 10 (2.16%) Cisco
8 9 (1.94%) Okta
9 8 (1.73%) ServiceNow
10 7 (1.51%) SAP
11 6 (1.30%) MuleSoft
11 6 (1.30%) Splunk
12 4 (0.86%) ESRI
12 4 (0.86%) Freshdesk
12 4 (0.86%) IBM
12 4 (0.86%) Informatica
12 4 (0.86%) Juniper
12 4 (0.86%) Palo Alto
12 4 (0.86%) Ping Identity
12 4 (0.86%) Symantec