Azure Functions Contracts in the City of London

Azure Functions
Central London > City of London

The following table provides summary statistics for contract job vacancies advertised in the City of London with a requirement for Azure Functions skills. Included is a benchmarking guide to the contractor rates offered in vacancies that have cited Azure Functions over the 6 months to 10 May 2024 with a comparison to the same period in the previous 2 years.

6 months to
10 May 2024
Same period 2023 Same period 2022
Rank 109 120 172
Rank change year-on-year +11 +52 -31
Contract jobs citing Azure Functions 21 45 18
As % of all contract jobs advertised in the City of London 0.96% 1.27% 0.43%
As % of the Cloud Services category 2.44% 3.33% 1.00%
Number of daily rates quoted 8 12 13
10th Percentile £398 £578 £511
25th Percentile £459 £600 £611
Median daily rate (50th Percentile) £531 £788 £650
Median % change year-on-year -32.54% +21.15% +11.83%
75th Percentile £550 £828 £700
90th Percentile £636 £860 £771
Central London median daily rate £531 £788 £650
% change year-on-year -32.54% +21.15% +11.83%

All Cloud Skills
City of London

Azure Functions is in the Cloud Services category. The following table is for comparison with the above and provides summary statistics for all contract job vacancies advertised in the City of London with a requirement for cloud computing skills.

Contract vacancies with a requirement for cloud computing skills 859 1,351 1,802
As % of all contract IT jobs advertised in the City of London 39.39% 38.10% 42.95%
Number of daily rates quoted 603 905 1,436
10th Percentile £363 £319 £403
25th Percentile £434 £463 £487
Median daily rate (50th Percentile) £540 £593 £575
Median % change year-on-year -8.86% +3.04% +9.52%
75th Percentile £666 £700 £688
90th Percentile £760 £800 £775
Central London median daily rate £525 £575 £575
% change year-on-year -8.70% - +9.52%
Number of hourly rates quoted 6 7 12
10th Percentile £12.75 £44.75 -
25th Percentile £14.88 £65.57 £13.88
Median hourly rate £22.50 £84.09 £17.22
Median % change year-on-year -73.24% +388.40% -7.43%
75th Percentile £26.19 £88.30 £25.50
90th Percentile £38.63 - £47.78
Central London median hourly rate £22.50 £83.30 £20.19
% change year-on-year -72.99% +312.66% -13.92%

Azure Functions
Job Vacancy Trend in the City of London

Job postings citing Azure Functions as a proportion of all IT jobs advertised in the City of London.
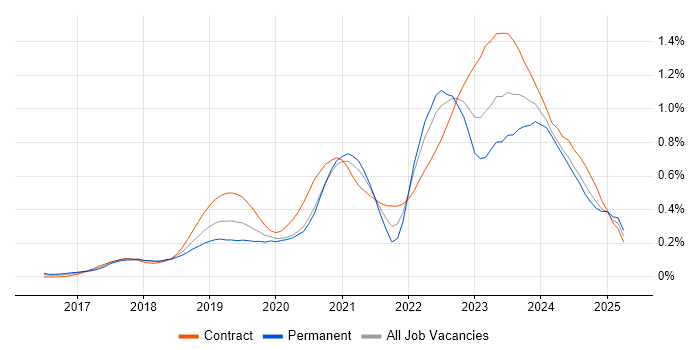
Job vacancy trend for Azure Functions in the City of London

Azure Functions
Contractor Daily Rate Trend in the City of London

3-month moving average daily rate quoted in jobs citing Azure Functions in the City of London.

Daily rate trend for Azure Functions in the City of London

Azure Functions
Daily Rate Histogram in the City of London

Daily rate distribution for jobs citing Azure Functions in the City of London over the 6 months to 10 May 2024.

Daily rate histogram for Azure Functions in the City of London

Azure Functions
Co-occurring Skills and Capabilities in the City of London by Category

The follow tables expand on the table above by listing co-occurrences grouped by category. The same employment type, locality and period is covered with up to 20 co-occurrences shown in each of the following categories:

Application Platforms
1 6 (28.57%) BizTalk Server
2 1 (4.76%) NServiceBus
2 1 (4.76%) SharePoint
Business Applications
1 1 (4.76%) Dynamics CRM
Cloud Services
1 21 (100.00%) Azure
1 21 (100.00%) Serverless
2 10 (47.62%) Azure Service Bus
3 9 (42.86%) Azure Logic Apps
4 7 (33.33%) AWS
4 7 (33.33%) AWS Lambda
4 7 (33.33%) Azure Cosmos DB
4 7 (33.33%) GitHub
5 6 (28.57%) Azure Storage
6 5 (23.81%) Azure AKS
6 5 (23.81%) Azure DevOps
6 5 (23.81%) GitHub Actions
7 4 (19.05%) Azure API Management
7 4 (19.05%) Dynamics 365
8 3 (14.29%) Azure Data Factory
8 3 (14.29%) Azure Monitor
9 1 (4.76%) Entra ID
9 1 (4.76%) GCP
9 1 (4.76%) NuGet
9 1 (4.76%) Power Platform
Database & Business Intelligence
1 6 (28.57%) Azure SQL Database
1 6 (28.57%) MongoDB
2 3 (14.29%) NoSQL
2 3 (14.29%) SQL Server
3 1 (4.76%) Power BI
Development Applications
1 5 (23.81%) Cypress.io
1 5 (23.81%) JMeter
2 3 (14.29%) Git
3 2 (9.52%) Visual Studio
4 1 (4.76%) git-flow
4 1 (4.76%) Gradle
4 1 (4.76%) Jenkins
4 1 (4.76%) JIRA
4 1 (4.76%) Maven
4 1 (4.76%) Mockito
4 1 (4.76%) SonarQube
4 1 (4.76%) Sonatype Nexus
4 1 (4.76%) Visual Studio Team System
General
1 3 (14.29%) Social Skills
2 2 (9.52%) Presentation Skills
3 1 (4.76%) Analytical Skills
3 1 (4.76%) Banking
3 1 (4.76%) Documentation Skills
Job Titles
1 11 (52.38%) Developer
2 7 (33.33%) Full Stack Developer
3 3 (14.29%) Platform Engineer
4 2 (9.52%) Architect
4 2 (9.52%) Azure Architect
4 2 (9.52%) DevOps Engineer
5 1 (4.76%) .NET Developer
5 1 (4.76%) Azure Developer
5 1 (4.76%) Data Migration Lead
5 1 (4.76%) Designer
5 1 (4.76%) Integration Developer
5 1 (4.76%) Java Developer
5 1 (4.76%) Junior
5 1 (4.76%) Junior Developer
5 1 (4.76%) Lead
5 1 (4.76%) Scrum Master
5 1 (4.76%) Solutions Designer
5 1 (4.76%) Technical Architect
5 1 (4.76%) Technical Designer
5 1 (4.76%) Technical Leader
Libraries, Frameworks & Software Standards
1 10 (47.62%) .NET
2 7 (33.33%) .NET Core
3 6 (28.57%) Blazor
3 6 (28.57%) Kafka
3 6 (28.57%) React
4 5 (23.81%) Node.js
5 2 (9.52%) .NET Framework
5 2 (9.52%) OAuth
5 2 (9.52%) OAuth2
5 2 (9.52%) RESTful
6 1 (4.76%) Entity Framework
6 1 (4.76%) JSON
6 1 (4.76%) RabbitMQ
6 1 (4.76%) SAML
6 1 (4.76%) Spring
6 1 (4.76%) Spring Boot
6 1 (4.76%) XML
Miscellaneous
1 7 (33.33%) Cloud Native
1 7 (33.33%) Legacy Systems
2 3 (14.29%) Machine to Machine
3 1 (4.76%) BYOD
3 1 (4.76%) Distributed Systems
Operating Systems
1 6 (28.57%) Windows
2 5 (23.81%) Linux
Processes & Methodologies
1 12 (57.14%) CI/CD
2 11 (52.38%) Agile
3 9 (42.86%) Microservices
3 9 (42.86%) Software Engineering
4 8 (38.10%) Continuous Improvement
4 8 (38.10%) DevOps
4 8 (38.10%) SDLC
5 7 (33.33%) Full Stack Development
6 6 (28.57%) Architectural Design
6 6 (28.57%) Data Development
6 6 (28.57%) Front End Development
6 6 (28.57%) Multithreading
6 6 (28.57%) Technical Leadership
7 5 (23.81%) Platform Engineering
8 3 (14.29%) API Management
8 3 (14.29%) Stakeholder Management
9 2 (9.52%) Migration
9 2 (9.52%) Scrum
9 2 (9.52%) TDD
9 2 (9.52%) Test Automation
Programming Languages
1 12 (57.14%) Python
2 8 (38.10%) SQL
3 7 (33.33%) Go
3 7 (33.33%) JavaScript
4 6 (28.57%) C++
4 6 (28.57%) PL/SQL
4 6 (28.57%) T-SQL
5 5 (23.81%) C#
6 2 (9.52%) PowerShell
7 1 (4.76%) Java
7 1 (4.76%) Scala
Qualifications
1 1 (4.76%) Azure Certification
1 1 (4.76%) Computer Science Degree
1 1 (4.76%) Degree
1 1 (4.76%) Master's Degree
Quality Assurance & Compliance
1 2 (9.52%) QA
System Software
1 6 (28.57%) Docker
Systems Management
1 12 (57.14%) Kubernetes
2 6 (28.57%) Terraform
3 5 (23.81%) Argo
Vendors
1 6 (28.57%) MuleSoft
1 6 (28.57%) Oracle
2 2 (9.52%) Microsoft
3 1 (4.76%) Databricks