Power Platform Contract Job Trends in the City of London

Microsoft Power Platform
Central London > City of London

The table below provides summary statistics and contractor rates for jobs advertised in the City of London requiring Power Platform skills. It covers vacancies from the 6 months leading up to 18 September 2025, with comparisons to the same periods in the previous two years.

6 months to
18 Sep 2025
Same period 2024 Same period 2023
Rank 26 38 59
Rank change year-on-year +12 +21 +12
Contract jobs citing Power Platform 127 104 108
As % of all contract jobs advertised in the City of London 7.20% 4.96% 3.63%
As % of the Cloud Services category 17.94% 12.28% 8.69%
Number of daily rates quoted 78 70 72
10th Percentile £359 £399 £325
25th Percentile £413 £493 £375
Median daily rate (50th Percentile) £550 £575 £500
Median % change year-on-year -4.35% +15.00% -7.19%
75th Percentile £663 £688 £628
90th Percentile £785 £750 £695
Central London median daily rate £550 £575 £500
% change year-on-year -4.35% +15.00% -6.98%
Number of hourly rates quoted 3 0 1
10th Percentile £19.60 - -
25th Percentile £24.25 - -
Median hourly rate £34.00 - £38.00
75th Percentile £35.34 - -
90th Percentile £35.74 - -
Central London median hourly rate £34.00 - £38.00

All Cloud Skills
City of London

Power Platform falls under the Cloud Services category. For comparison with the information above, the following table provides summary statistics for all contract job vacancies requiring cloud computing skills in the City of London.

Contract vacancies with a requirement for cloud computing skills 708 847 1,243
As % of all contract IT jobs advertised in the City of London 40.16% 40.37% 41.73%
Number of daily rates quoted 489 562 846
10th Percentile £339 £388 £325
25th Percentile £435 £475 £463
Median daily rate (50th Percentile) £550 £564 £570
Median % change year-on-year -2.44% -1.10% -0.87%
75th Percentile £669 £675 £688
90th Percentile £751 £775 £788
Central London median daily rate £550 £560 £563
% change year-on-year -1.79% -0.44% -2.17%
Number of hourly rates quoted 12 3 6
10th Percentile £23.84 - £14.63
25th Percentile £26.23 - £17.00
Median hourly rate £34.33 £27.00 £20.75
Median % change year-on-year +27.13% +30.12% -38.97%
75th Percentile £58.96 £59.75 £34.44
90th Percentile £86.43 £79.40 £45.25
Central London median hourly rate £34.00 £35.00 £20.75
% change year-on-year -2.86% +68.67% -37.59%

Power Platform
Job Vacancy Trend in the City of London

Job postings citing Power Platform as a proportion of all IT jobs advertised in the City of London.
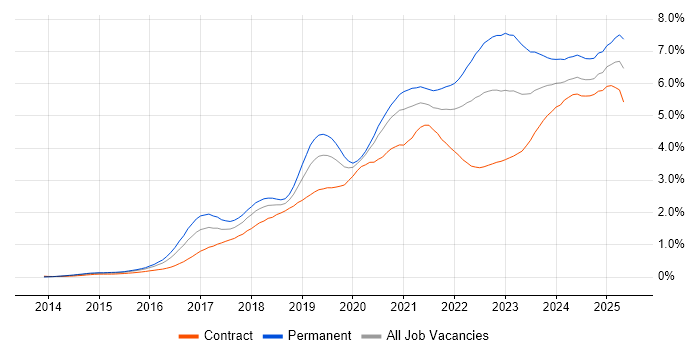
Job vacancy trend for Power Platform in the City of London

Power Platform
Daily Rate Trend in the City of London

Contractor daily rate distribution trend for jobs in the City of London citing Power Platform.

Contractor daily rate distribution trend for jobs in the City of London citing Power Platform

Power Platform
Daily Rate Histogram in the City of London

Daily rate distribution for jobs citing Power Platform in the City of London over the 6 months to 18 September 2025.

Daily rate histogram for Power Platform in the City of London

Power Platform
Hourly Rate Trend in the City of London

Contractor hourly rate distribution trend for jobs in the City of London citing Power Platform.

Contractor hourly rate distribution trend for jobs in the City of London citing Power Platform

Power Platform
Hourly Rate Histogram in the City of London

Hourly rate distribution of jobs citing Power Platform in the City of London over the 6 months to 18 September 2025.

Hourly rate histogram for Power Platform in the City of London

Power Platform
Co-occurring Skills and Capabilities in the City of London by Category

The follow tables expand on the table above by listing co-occurrences grouped by category. The same employment type, locality and period is covered with up to 20 co-occurrences shown in each of the following categories:

Application Platforms
1 21 (16.54%) SharePoint
2 6 (4.72%) Confluence
3 3 (2.36%) Apache Spark
4 2 (1.57%) Apache
4 2 (1.57%) Jupyter
5 1 (0.79%) Apache Airflow
5 1 (0.79%) Microsoft Exchange
5 1 (0.79%) Oracle Workflow
Applications
1 39 (30.71%) Microsoft Excel
2 11 (8.66%) Microsoft PowerPoint
3 9 (7.09%) Microsoft Office
4 4 (3.15%) Microsoft Project
5 2 (1.57%) MS Visio
6 1 (0.79%) Spreadsheet
Business Applications
1 7 (5.51%) Dynamics CRM
2 1 (0.79%) Oracle Financials
2 1 (0.79%) Oracle Payables
2 1 (0.79%) Salesforce CRM
2 1 (0.79%) SAP Hybris
Cloud Services
1 55 (43.31%) Azure
2 28 (22.05%) Power Automate
3 26 (20.47%) PowerApps
4 20 (15.75%) Microsoft 365
5 16 (12.60%) Azure DevOps
6 15 (11.81%) Dynamics 365
7 13 (10.24%) Azure Synapse Analytics
8 11 (8.66%) Azure Data Factory
9 10 (7.87%) Entra ID
9 10 (7.87%) SaaS
9 10 (7.87%) Snowflake
10 8 (6.30%) AWS
11 7 (5.51%) GCP
11 7 (5.51%) Microsoft Copilot
12 6 (4.72%) GitHub
13 5 (3.94%) GitHub Actions
13 5 (3.94%) Microsoft Purview
14 4 (3.15%) Azure AI
14 4 (3.15%) Azure Logic Apps
14 4 (3.15%) Copilot Studio
Communications & Networking
1 2 (1.57%) SSH
2 1 (0.79%) Firewall
2 1 (0.79%) HTTP
2 1 (0.79%) Intranet
Database & Business Intelligence
1 105 (82.68%) Power BI
2 19 (14.96%) Tableau
3 14 (11.02%) Data Lake
4 10 (7.87%) Data Warehouse
4 10 (7.87%) SQL Server
5 8 (6.30%) Data Mining
6 7 (5.51%) Azure SQL Database
6 7 (5.51%) Relational Database
7 5 (3.94%) BigQuery
7 5 (3.94%) Power Query
8 4 (3.15%) SQL Server Integration Services
9 3 (2.36%) Apache Hive
9 3 (2.36%) BusinessObjects
9 3 (2.36%) Delta Lake
9 3 (2.36%) Parquet
9 3 (2.36%) Snowflake Schema
9 3 (2.36%) SQL Server Reporting Services
10 2 (1.57%) Crystal Reports
10 2 (1.57%) Looker
10 2 (1.57%) Metadata
Development Applications
1 12 (9.45%) JIRA
2 5 (3.94%) Git
3 2 (1.57%) RStudio
3 2 (1.57%) SonarQube
4 1 (0.79%) NUnit
4 1 (0.79%) Postman
4 1 (0.79%) ScriptRunner
4 1 (0.79%) Terragrunt
4 1 (0.79%) Zephyr
General
1 52 (40.94%) Social Skills
2 50 (39.37%) Finance
3 28 (22.05%) Analytical Skills
4 21 (16.54%) Banking
5 13 (10.24%) Investment Banking
6 9 (7.09%) Public Sector
7 7 (5.51%) Presentation Skills
8 6 (4.72%) Documentation Skills
8 6 (4.72%) Marketing
8 6 (4.72%) Police
9 5 (3.94%) Organisational Skills
10 4 (3.15%) Back Office
10 4 (3.15%) Front Office
10 4 (3.15%) Legal
11 3 (2.36%) Law
11 3 (2.36%) Retail
12 2 (1.57%) Financial Institution
12 2 (1.57%) Retail Banking
13 1 (0.79%) Advertising
13 1 (0.79%) Electronics
Job Titles
1 28 (22.05%) Analyst
2 21 (16.54%) Developer
3 17 (13.39%) Senior
4 15 (11.81%) Consultant
4 15 (11.81%) Lead
5 14 (11.02%) Data Analyst
6 12 (9.45%) Architect
7 11 (8.66%) Business Analyst
7 11 (8.66%) Data Engineer
8 9 (7.09%) Senior Consultant
9 8 (6.30%) Business Intelligence Developer
10 7 (5.51%) Risk Consultant
11 5 (3.94%) Data Business Analyst
11 5 (3.94%) Data Scientist
11 5 (3.94%) Power Platform Developer
12 4 (3.15%) Analyst Developer
12 4 (3.15%) Azure Engineer
12 4 (3.15%) Power BI Developer
13 3 (2.36%) Senior Analyst
13 3 (2.36%) Solutions Architect
Libraries, Frameworks & Software Standards
1 7 (5.51%) .NET
2 6 (4.72%) Microsoft Graph
3 5 (3.94%) HTML
3 5 (3.94%) PySpark
4 4 (3.15%) CSS
4 4 (3.15%) JSON
4 4 (3.15%) Pandas
4 4 (3.15%) scikit-learn
4 4 (3.15%) TensorFlow
5 3 (2.36%) ADO
5 3 (2.36%) REST
6 2 (1.57%) Apache Avro
6 2 (1.57%) HTML5
6 2 (1.57%) HTML5 Canvas
6 2 (1.57%) pydantic
6 2 (1.57%) XML
6 2 (1.57%) YAML
7 1 (0.79%) ARM Templates
7 1 (0.79%) LangChain
7 1 (0.79%) Semantic Kernel
Miscellaneous
1 8 (6.30%) Market Risk
2 6 (4.72%) Data Structures
3 5 (3.94%) Self-Motivation
4 4 (3.15%) Algorithms
4 4 (3.15%) Low-Code
4 4 (3.15%) Management Information System
5 3 (2.36%) Analytical Mindset
5 3 (2.36%) Derivative
5 3 (2.36%) Enterprise Software
5 3 (2.36%) Greenfield Project
5 3 (2.36%) Onboarding
5 3 (2.36%) Reference Data
6 2 (1.57%) AI Agents
6 2 (1.57%) Data Fabric
6 2 (1.57%) Freedom of Information
6 2 (1.57%) Interest Rate Derivative
6 2 (1.57%) Linux Command Line
6 2 (1.57%) Product Ownership
6 2 (1.57%) Swaptions
7 1 (0.79%) Legacy Systems
Operating Systems
1 2 (1.57%) Linux
1 2 (1.57%) Windows
2 1 (0.79%) Windows 10
Processes & Methodologies
1 94 (74.02%) Business Intelligence
2 44 (34.65%) Agile
3 43 (33.86%) Analytics
4 33 (25.98%) Problem-Solving
5 30 (23.62%) Visualisation
6 28 (22.05%) Decision-Making
7 23 (18.11%) Data Modelling
8 21 (16.54%) Data Governance
8 21 (16.54%) DevOps
9 19 (14.96%) Actionable Insight
9 19 (14.96%) Stakeholder Engagement
10 18 (14.17%) Data Analysis
10 18 (14.17%) Stakeholder Management
11 17 (13.39%) Continuous Improvement
11 17 (13.39%) Data Visualisation
12 15 (11.81%) Migration
13 14 (11.02%) Artificial Intelligence
13 14 (11.02%) CI/CD
13 14 (11.02%) CRM
14 13 (10.24%) Scrum
Programming Languages
1 62 (48.82%) SQL
2 37 (29.13%) Python
3 11 (8.66%) Data Analysis Expressions
3 11 (8.66%) PowerShell
4 6 (4.72%) JavaScript
5 5 (3.94%) C#
5 5 (3.94%) R
6 4 (3.15%) Java
6 4 (3.15%) Scala
7 3 (2.36%) Bash
7 3 (2.36%) VBA
8 2 (1.57%) Bicep
8 2 (1.57%) Korn
9 1 (0.79%) Groovy
9 1 (0.79%) LookML
9 1 (0.79%) PL/SQL
9 1 (0.79%) T-SQL
Qualifications
1 17 (13.39%) Security Cleared
2 11 (8.66%) SC Cleared
3 10 (7.87%) Degree
4 8 (6.30%) Microsoft Certification
5 5 (3.94%) Azure Certification
6 2 (1.57%) ACCA
6 2 (1.57%) AWS Certification
6 2 (1.57%) Computer Science Degree
6 2 (1.57%) DV Cleared
7 1 (0.79%) AWS Certified Solutions Architect
7 1 (0.79%) CFA
7 1 (0.79%) CIMA
7 1 (0.79%) CISA
7 1 (0.79%) CISSP
7 1 (0.79%) CRISC
7 1 (0.79%) CSSLP
7 1 (0.79%) PMI Certification
7 1 (0.79%) PMP
7 1 (0.79%) SANS
Quality Assurance & Compliance
1 13 (10.24%) GDPR
2 11 (8.66%) Data Quality
3 8 (6.30%) Basel II
4 5 (3.94%) PMO
5 4 (3.15%) NIST
6 3 (2.36%) Accessibility
6 3 (2.36%) QA
7 2 (1.57%) EU AI Act
7 2 (1.57%) ISO/IEC 42001
8 1 (0.79%) ISO/IEC 27001
System Software
1 9 (7.09%) Active Directory
Systems Management
1 6 (4.72%) Terraform
2 2 (1.57%) Kubernetes
2 2 (1.57%) Microsoft Intune
3 1 (0.79%) Grafana
3 1 (0.79%) HP ALM
3 1 (0.79%) Istio
3 1 (0.79%) Opsgenie
3 1 (0.79%) Prometheus
3 1 (0.79%) SCCM
3 1 (0.79%) Single Sign-On
3 1 (0.79%) WSUS
Vendors
1 54 (42.52%) Microsoft
2 12 (9.45%) Databricks
3 6 (4.72%) Oracle
4 5 (3.94%) Google
4 5 (3.94%) SAP
5 4 (3.15%) Salesforce
6 3 (2.36%) Dataiku
7 2 (1.57%) Adobe
7 2 (1.57%) BiZZdesign
7 2 (1.57%) DocuSign
7 2 (1.57%) OpenAI
7 2 (1.57%) Progress
7 2 (1.57%) ServiceNow
7 2 (1.57%) UiPath
8 1 (0.79%) dotdigital
8 1 (0.79%) HP
8 1 (0.79%) MicroStrategy
8 1 (0.79%) PeopleSoft
8 1 (0.79%) Planview
8 1 (0.79%) Tenable