Baseline Personnel Security Standard (BPSS) Clearance
Central London > City of London
The table below provides summary statistics for contract job vacancies advertised in the City of London with a requirement for BPSS Clearance qualifications. It includes a benchmarking guide to the contractor rates offered over the 6 months leading up to 15 February 2026, comparing them to the same period in the previous two years.
| 6 months to 15 Feb 2026 |
Same period 2025 | Same period 2024 | |
|---|---|---|---|
| Rank | 103 | 98 | 113 |
| Rank change year-on-year | -5 | +15 | +45 |
| Contract jobs citing BPSS Clearance | 22 | 20 | 21 |
| As % of all contract jobs in the City of London | 1.15% | 1.10% | 0.87% |
| As % of the Qualifications category | 4.10% | 4.18% | 4.50% |
| Number of daily rates quoted | 16 | 6 | 11 |
| 10th Percentile | £361 | £472 | £250 |
| 25th Percentile | £453 | £532 | £421 |
| Median daily rate (50th Percentile) | £550 | £563 | £475 |
| Median % change year-on-year | -2.22% | +18.42% | -20.83% |
| 75th Percentile | £638 | £575 | £619 |
| 90th Percentile | £681 | £683 | £650 |
| Central London median daily rate | £550 | £550 | £475 |
| % change year-on-year | - | +15.79% | -20.83% |
All Academic and Professional Certifications
City of London
BPSS Clearance falls under the Academic Qualifications and Professional Certifications category. For comparison with the information above, the following table provides summary statistics for all contract job vacancies requiring academic qualifications or professional certifications in the City of London.
| Contract vacancies requiring academic qualifications or professional certifications | 536 | 479 | 467 |
| As % of all contract IT jobs advertised in the City of London | 27.96% | 26.28% | 19.44% |
| Number of daily rates quoted | 394 | 277 | 312 |
| 10th Percentile | £382 | £357 | £351 |
| 25th Percentile | £431 | £456 | £438 |
| Median daily rate (50th Percentile) | £525 | £535 | £550 |
| Median % change year-on-year | -1.87% | -2.73% | -8.33% |
| 75th Percentile | £638 | £638 | £679 |
| 90th Percentile | £738 | £750 | £775 |
| Central London median daily rate | £525 | £525 | £532 |
| % change year-on-year | - | -1.22% | -9.53% |
| Number of hourly rates quoted | 5 | 4 | 4 |
| 10th Percentile | £20.65 | £24.78 | £19.32 |
| 25th Percentile | £25.77 | £28.94 | £19.90 |
| Median hourly rate | £28.00 | £72.25 | £46.66 |
| Median % change year-on-year | -61.25% | +54.85% | +11.09% |
| 75th Percentile | £52.16 | £112.00 | £74.69 |
| 90th Percentile | £59.86 | - | £76.38 |
| Central London median hourly rate | £25.62 | £72.25 | £42.49 |
| % change year-on-year | -64.54% | +70.06% | +1.15% |
BPSS Clearance
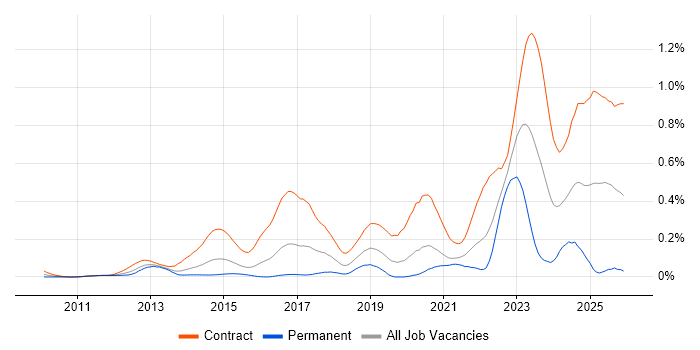
Job Vacancy Trend in the City of London
Historical trend showing the proportion of contract IT job postings citing BPSS Clearance relative to all contract IT jobs advertised in the City of London.

BPSS Clearance
Daily Rate Trend in the City of London
Contractor daily rate distribution trend for jobs in the City of London citing BPSS Clearance.

BPSS Clearance
Daily Rate Histogram in the City of London
Daily rate distribution for jobs citing BPSS Clearance in the City of London over the 6 months to 15 February 2026.
BPSS Clearance
Co-Occurring Skills & Capabilities in the City of London by Category
The following tables expand on the one above by listing co-occurrences grouped by category. They cover the same employment type, locality and period, with up to 20 co-occurrences shown in each category:
|
|
||||||||||||||||||||||||||||||||||||||||||||||||||||||||||||||||||||||||||||||||||||||||||||||||||||||||||||||||||||||||||||||
|
|
||||||||||||||||||||||||||||||||||||||||||||||||||||||||||||||||||||||||||||||||||||||||||||||||||||||||||||||||||||||||||||||
|
|
||||||||||||||||||||||||||||||||||||||||||||||||||||||||||||||||||||||||||||||||||||||||||||||||||||||||||||||||||||||||||||||
|
|
||||||||||||||||||||||||||||||||||||||||||||||||||||||||||||||||||||||||||||||||||||||||||||||||||||||||||||||||||||||||||||||
|
|
||||||||||||||||||||||||||||||||||||||||||||||||||||||||||||||||||||||||||||||||||||||||||||||||||||||||||||||||||||||||||||||
|
|
||||||||||||||||||||||||||||||||||||||||||||||||||||||||||||||||||||||||||||||||||||||||||||||||||||||||||||||||||||||||||||||
|
|
||||||||||||||||||||||||||||||||||||||||||||||||||||||||||||||||||||||||||||||||||||||||||||||||||||||||||||||||||||||||||||||
|
|
||||||||||||||||||||||||||||||||||||||||||||||||||||||||||||||||||||||||||||||||||||||||||||||||||||||||||||||||||||||||||||||
|
|||||||||||||||||||||||||||||||||||||||||||||||||||||||||||||||||||||||||||||||||||||||||||||||||||||||||||||||||||||||||||||||
