Developer Contracts in the City of London

Developer
Central London > City of London

The median Developer daily rate in the City of London is £575, according to job vacancies posted in the 6 months leading up to 30 June 2025.

The table below provides contractor rate benchmarking and summary statistics, comparing them to the same period in the previous two years.

6 months to
30 Jun 2025
Same period 2024 Same period 2023
Rank 9 6 3
Rank change year-on-year -3 -3 0
Contract jobs requiring a Developer 283 327 702
As % of all contract jobs advertised in the City of London 16.10% 15.44% 20.35%
As % of the Job Titles category 17.15% 16.19% 21.51%
Number of daily rates quoted 183 212 503
10th Percentile £413 £410 £425
25th Percentile £463 £463 £509
Median daily rate (50th Percentile) £575 £564 £650
Median % change year-on-year +2.00% -13.27% +7.44%
75th Percentile £688 £725 £775
90th Percentile £812 £849 £875
Central London median daily rate £575 £552 £638
% change year-on-year +4.21% -13.45% +6.25%
Number of hourly rates quoted 1 0 2
10th Percentile - - £75.49
25th Percentile £34.63 - £76.22
Median hourly rate £34.65 - £82.05
75th Percentile £34.68 - £87.47
90th Percentile - - £87.97
Central London median hourly rate £34.65 - £82.05
% change year-on-year - - +56.28%

All Contract IT Job Vacancies
City of London

For comparison with the information above, the following table provides summary statistics for all contract IT job vacancies in the City of London. Most job vacancies include a discernible job title that can be normalized. As such, the figures in the second row provide an indication of the number of contract jobs in our overall sample.

Contract vacancies in the City of London with a recognized job title 1,650 2,020 3,263
% of contract IT jobs with a recognized job title 93.86% 95.37% 94.61%
Number of daily rates quoted 1,046 1,390 2,204
10th Percentile £350 £350 £350
25th Percentile £455 £450 £475
Median daily rate (50th Percentile) £550 £565 £600
Median % change year-on-year -2.65% -5.83% +5.26%
75th Percentile £688 £688 £725
90th Percentile £775 £800 £825
Central London median daily rate £550 £550 £600
% change year-on-year - -8.33% +7.14%
Number of hourly rates quoted 22 16 20
10th Percentile £17.57 £16.33 £15.37
25th Percentile £24.66 £20.22 £18.50
Median hourly rate £32.50 £24.63 £35.00
Median % change year-on-year +31.98% -29.64% -18.60%
75th Percentile £62.00 £40.00 £72.50
90th Percentile £86.43 £64.50 £88.30
Central London median hourly rate £30.04 £27.00 £35.00
% change year-on-year +11.24% -22.86% -16.67%

Developer
Job Vacancy Trend in the City of London

Job postings that featured Developer in the job title as a proportion of all IT jobs advertised in the City of London.
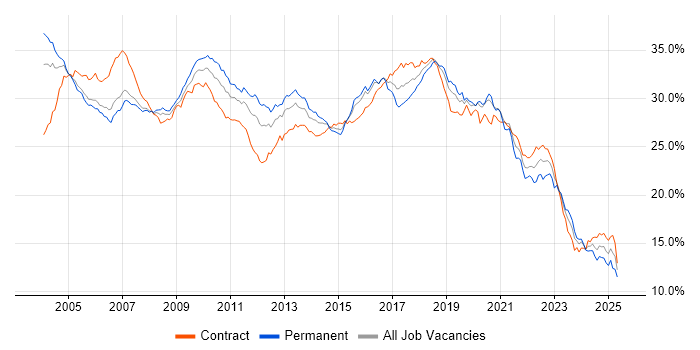
Job vacancy trend for Developer in the City of London

Developer
Contractor Daily Rate Trend in the City of London

3-month moving average daily rate quoted in jobs citing Developer in the City of London.

Daily rate trend for Developer in the City of London

Developer
Daily Rate Histogram in the City of London

Daily rate distribution for jobs citing Developer in the City of London over the 6 months to 30 June 2025.

Daily rate histogram for Developer in the City of London

Developer
Contractor Hourly Rate Trend in the City of London

3-month moving average hourly rates quoted in jobs citing Developer in the City of London.

Hourly rate trend for Developer in the City of London

Developer Skill Set
Top 30 Co-occurring Skills and Capabilities in the City of London

For the 6 months to 30 June 2025, Developer contract job roles required the following skills and capabilities in order of popularity. The figures indicate the absolute number co-occurrences and as a proportion of all contract job ads across the City of London region featuring Developer in the job title.

1 105 (37.10%) Finance
2 92 (32.51%) Agile
3 81 (28.62%) Java
3 81 (28.62%) Social Skills
4 77 (27.21%) Python
5 70 (24.73%) SQL
6 63 (22.26%) JavaScript
7 62 (21.91%) C#
8 60 (21.20%) Problem-Solving
9 58 (20.49%) AWS
9 58 (20.49%) DevOps
10 52 (18.37%) CI/CD
11 51 (18.02%) React
11 51 (18.02%) Azure
12 47 (16.61%) .NET
13 42 (14.84%) Banking
14 41 (14.49%) Full-Stack Development
15 38 (13.43%) HTML
16 36 (12.72%) SQL Server
16 36 (12.72%) Kubernetes
16 36 (12.72%) Microservices
17 32 (11.31%) Analytical Skills
17 32 (11.31%) Security Cleared
18 31 (10.95%) CSS
19 30 (10.60%) Spring
20 29 (10.25%) PostgreSQL
20 29 (10.25%) Front Office
20 29 (10.25%) Git
21 27 (9.54%) REST
21 27 (9.54%) TypeScript

Developer Skill Set
Co-occurring Skills and Capabilities in the City of London by Category

The follow tables expand on the table above by listing co-occurrences grouped by category. The same employment type, locality and period is covered with up to 20 co-occurrences shown in each of the following categories:

Application Platforms
1 10 (3.53%) Apache
1 10 (3.53%) Apache Spark
1 10 (3.53%) Confluence
2 5 (1.77%) CMS
3 4 (1.41%) SharePoint
4 3 (1.06%) Headless CMS
5 1 (0.35%) Alfresco
5 1 (0.35%) Anypoint
5 1 (0.35%) Apache Airflow
5 1 (0.35%) Camunda
5 1 (0.35%) Drupal
5 1 (0.35%) Oracle SOA Suite
5 1 (0.35%) Oracle Workflow
5 1 (0.35%) SAS
Applications
1 12 (4.24%) Microsoft Excel
2 3 (1.06%) Microsoft Office
3 2 (0.71%) Adobe Creative Suite
3 2 (0.71%) Spreadsheet
Business Applications
1 8 (2.83%) Endur
2 4 (1.41%) Dynamics CRM
3 3 (1.06%) OpenText MBPM
3 3 (1.06%) Oracle BPM
4 2 (0.71%) SAP Convergent Charging
4 2 (0.71%) SAP CRM
4 2 (0.71%) SAP S/4HANA
5 1 (0.35%) Fidessa
5 1 (0.35%) Maximo
5 1 (0.35%) Oracle Applications
5 1 (0.35%) Oracle Assets
5 1 (0.35%) Oracle EBS
5 1 (0.35%) Oracle EBS R12
5 1 (0.35%) Oracle Payables
5 1 (0.35%) SAP HR
5 1 (0.35%) SAP Hybris
Cloud Services
1 58 (20.49%) AWS
2 51 (18.02%) Azure
3 26 (9.19%) Power Platform
4 13 (4.59%) Amazon S3
5 11 (3.89%) Azure DevOps
5 11 (3.89%) GCP
6 10 (3.53%) Azure Data Factory
7 8 (2.83%) Serverless
8 7 (2.47%) Microsoft 365
8 7 (2.47%) OpenShift
8 7 (2.47%) Power Automate
9 6 (2.12%) Dynamics 365
9 6 (2.12%) PowerApps
10 5 (1.77%) Azure Synapse Analytics
10 5 (1.77%) GitHub
10 5 (1.77%) Microsoft Copilot
11 4 (1.41%) Amazon EKS
11 4 (1.41%) Boomi
12 3 (1.06%) Azure App Service
12 3 (1.06%) Azure Service Bus
Communications & Networking
1 4 (1.41%) Firewall
2 3 (1.06%) HTTP
3 1 (0.35%) Ethernet
3 1 (0.35%) tcpdump
3 1 (0.35%) VPN
Database & Business Intelligence
1 36 (12.72%) SQL Server
2 29 (10.25%) PostgreSQL
3 23 (8.13%) NoSQL
4 18 (6.36%) MongoDB
4 18 (6.36%) Power BI
5 14 (4.95%) Big Data
6 13 (4.59%) Relational Database
7 8 (2.83%) Hadoop
8 7 (2.47%) Data Warehouse
8 7 (2.47%) SQL Server Reporting Services
8 7 (2.47%) Tableau
9 6 (2.12%) BusinessObjects
9 6 (2.12%) MySQL
9 6 (2.12%) Redis
10 5 (1.77%) Crystal Reports
10 5 (1.77%) Data Lake
10 5 (1.77%) KDB
10 5 (1.77%) SQL Server Integration Services
11 3 (1.06%) Amazon Aurora
11 3 (1.06%) DocumentDB
Development Applications
1 29 (10.25%) Git
2 17 (6.01%) Jenkins
3 13 (4.59%) JIRA
4 9 (3.18%) JUnit
5 8 (2.83%) Gradle
5 8 (2.83%) Maven
6 7 (2.47%) Bitbucket Server
7 6 (2.12%) IntelliJ
8 5 (1.77%) Atlassian Bamboo
8 5 (1.77%) Bitbucket
8 5 (1.77%) TeamCity
9 4 (1.41%) GitLab
9 4 (1.41%) SonarQube
10 3 (1.06%) Babel
10 3 (1.06%) ScriptRunner
10 3 (1.06%) webpack
11 2 (0.71%) Android Studio
11 2 (0.71%) Cucumber
11 2 (0.71%) Cypress.io
11 2 (0.71%) Zephyr
General
1 105 (37.10%) Finance
2 81 (28.62%) Social Skills
3 42 (14.84%) Banking
4 32 (11.31%) Analytical Skills
5 29 (10.25%) Front Office
6 21 (7.42%) Public Sector
7 18 (6.36%) Investment Banking
8 10 (3.53%) Financial Institution
9 9 (3.18%) Marketing
10 7 (2.47%) Documentation Skills
10 7 (2.47%) Retail Banking
10 7 (2.47%) Telecoms
11 6 (2.12%) Retail
12 5 (1.77%) Corporate Banking
12 5 (1.77%) Legal
13 4 (1.41%) Back Office
13 4 (1.41%) Inclusion and Diversity
14 2 (0.71%) Advertising
14 2 (0.71%) Games
15 1 (0.35%) Spanish Language
Libraries, Frameworks & Software Standards
1 51 (18.02%) React
2 47 (16.61%) .NET
3 38 (13.43%) HTML
4 31 (10.95%) CSS
5 30 (10.60%) Spring
6 27 (9.54%) REST
7 25 (8.83%) AngularJS
8 23 (8.13%) Kafka
9 18 (6.36%) RESTful
9 18 (6.36%) Spring Boot
9 18 (6.36%) Web Services
10 14 (4.95%) GraphQL
11 10 (3.53%) Middleware
11 10 (3.53%) Node.js
12 8 (2.83%) Django
12 8 (2.83%) HTML5
12 8 (2.83%) jQuery
12 8 (2.83%) WPF
13 7 (2.47%) SOAP
14 6 (2.12%) ASP.NET
Miscellaneous
1 16 (5.65%) Foreign Exchange (FX)
2 10 (3.53%) Legacy Systems
2 10 (3.53%) Market Risk
2 10 (3.53%) Mobile App
3 7 (2.47%) Cloud Native
3 7 (2.47%) Derivative
3 7 (2.47%) Equities
3 7 (2.47%) Fixed Income
4 6 (2.12%) Analytical Mindset
4 6 (2.12%) Credit Risk
4 6 (2.12%) Distributed Systems
4 6 (2.12%) Greenfield Project
5 5 (1.77%) Algorithms
5 5 (1.77%) Distributed Computing
5 5 (1.77%) Onboarding
6 4 (1.41%) CMDB
6 4 (1.41%) Product Ownership
7 3 (1.06%) Acoustics
7 3 (1.06%) Management Information System
7 3 (1.06%) Self-Motivation
Operating Systems
1 21 (7.42%) Linux
2 12 (4.24%) Unix
3 5 (1.77%) Android
4 4 (1.41%) Windows
5 3 (1.06%) Apple iOS
Processes & Methodologies
1 92 (32.51%) Agile
2 60 (21.20%) Problem-Solving
3 58 (20.49%) DevOps
4 52 (18.37%) CI/CD
5 41 (14.49%) Full-Stack Development
6 36 (12.72%) Microservices
7 27 (9.54%) Software Engineering
8 25 (8.83%) Unit Testing
9 24 (8.48%) Analytics
10 23 (8.13%) User Experience
11 21 (7.42%) Clean Code
11 21 (7.42%) Data Analysis
12 18 (6.36%) API Development
12 18 (6.36%) Computer Science
13 17 (6.01%) Front End Development
13 17 (6.01%) Low Latency
13 17 (6.01%) SDLC
13 17 (6.01%) SOLID
13 17 (6.01%) TDD
14 16 (5.65%) Visualisation
Programming Languages
1 81 (28.62%) Java
2 77 (27.21%) Python
3 70 (24.73%) SQL
4 63 (22.26%) JavaScript
5 62 (21.91%) C#
6 27 (9.54%) TypeScript
7 13 (4.59%) C++
8 7 (2.47%) Apex Code
9 6 (2.12%) VBA
10 5 (1.77%) Go
10 5 (1.77%) Kotlin
11 4 (1.41%) Data Analysis Expressions
11 4 (1.41%) Groovy
11 4 (1.41%) PL/SQL
11 4 (1.41%) Ruby
12 3 (1.06%) Perl
12 3 (1.06%) Scala
12 3 (1.06%) Swift
13 2 (0.71%) ABAP
13 2 (0.71%) PHP
Qualifications
1 32 (11.31%) Security Cleared
2 26 (9.19%) SC Cleared
3 21 (7.42%) Degree
4 11 (3.89%) Computer Science Degree
5 9 (3.18%) AWS Certified Developer
6 5 (1.77%) BPSS Clearance
6 5 (1.77%) Master's Degree
7 4 (1.41%) DV Cleared
8 3 (1.06%) Azure Certification
8 3 (1.06%) PhD
9 1 (0.35%) Numerate Degree
Quality Assurance & Compliance
1 14 (4.95%) QA
2 12 (4.24%) Accessibility
3 3 (1.06%) Data Quality
3 3 (1.06%) EMIR
3 3 (1.06%) MiFID
4 1 (0.35%) GDPR
4 1 (0.35%) GRC
4 1 (0.35%) IFRS
4 1 (0.35%) IFRS 9
4 1 (0.35%) WCAG
System Software
1 19 (6.71%) Docker
2 1 (0.35%) Apache ZooKeeper
Systems Management
1 36 (12.72%) Kubernetes
2 13 (4.59%) Terraform
3 8 (2.83%) Ansible
4 2 (0.71%) Istio
4 2 (0.71%) Kibana
4 2 (0.71%) Opsgenie
4 2 (0.71%) Puppet
5 1 (0.35%) Argo
5 1 (0.35%) CloudHub
5 1 (0.35%) Control-M
5 1 (0.35%) Prometheus
5 1 (0.35%) Single Sign-On
Vendors
1 24 (8.48%) Oracle
2 23 (8.13%) Microsoft
3 20 (7.07%) ServiceNow
4 10 (3.53%) Salesforce
5 9 (3.18%) OpenLink
6 8 (2.83%) Splunk
7 6 (2.12%) Databricks
8 5 (1.77%) Axway
8 5 (1.77%) webMethods
9 4 (1.41%) Google
9 4 (1.41%) IBM
9 4 (1.41%) MuleSoft
9 4 (1.41%) SAP
9 4 (1.41%) UiPath
10 3 (1.06%) Atlassian
10 3 (1.06%) Dataiku
10 3 (1.06%) OpenText
11 2 (0.71%) Bloomberg
11 2 (0.71%) Calypso
11 2 (0.71%) Sybase