BusinessObjects Contracts with Work from Home Options

SAP BusinessObjects (SAP BO, BOBJ)
UK > Work from Home

The table below provides summary statistics for contract job vacancies with an option to work from home (WFH) and a requirement for BusinessObjects skills. Included is a benchmarking guide to the contractor rates offered in vacancies that have cited BusinessObjects over the 6 months to 6 May 2024 with a comparison to the same period in the previous 2 years.

6 months to
6 May 2024
Same period 2023 Same period 2022
Rank 306 393 517
Rank change year-on-year +87 +124 -114
Contract jobs citing BusinessObjects 38 81 102
As % of all contract jobs with a WFH option 0.25% 0.32% 0.23%
As % of the Database & Business Intelligence category 1.31% 1.67% 1.06%
Number of daily rates quoted 34 62 83
10th Percentile £264 £388 £400
25th Percentile £481 £472 £450
Median daily rate (50th Percentile) £488 £550 £500
Median % change year-on-year -11.36% +10.00% +12.68%
75th Percentile £562 £644 £567
90th Percentile £621 £686 £657
UK median daily rate £500 £525 £510
% change year-on-year -4.76% +2.94% +16.57%

All Database and Business Intelligence Skills
Work from Home

BusinessObjects is in the Databases and Business Intelligence category. The following table is for comparison with the above and provides summary statistics for all contract job vacancies with a WFH option and a requirement for database or business intelligence skills.

Contract vacancies with a requirement for database or business intelligence skills 2,909 4,857 9,663
As % of all contract jobs with a WFH option 19.11% 19.02% 21.68%
Number of daily rates quoted 2,141 3,541 7,026
10th Percentile £351 £385 £375
25th Percentile £425 £450 £440
Median daily rate (50th Percentile) £513 £525 £525
Median % change year-on-year -2.38% - +5.00%
75th Percentile £650 £650 £638
90th Percentile £750 £750 £734
UK median daily rate £525 £540 £550
% change year-on-year -2.78% -1.82% +10.00%
Number of hourly rates quoted 37 83 83
10th Percentile £20.06 £22.20 £19.20
25th Percentile £22.61 £41.75 £22.08
Median hourly rate £40.00 £65.00 £46.67
Median % change year-on-year -38.46% +39.28% +55.57%
75th Percentile £61.50 £75.00 £62.15
90th Percentile £70.25 £85.00 £68.20
UK median hourly rate £40.00 £59.30 £43.38
% change year-on-year -32.54% +36.70% +60.89%

BusinessObjects
Trend for Jobs with a WFH Option

Job vacancies with a work from home option citing BusinessObjects as a proportion of all IT jobs advertised.
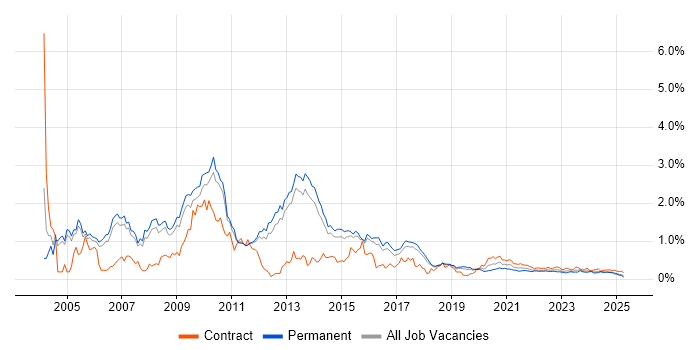
BusinessObjects trend for jobs with a WFH option

BusinessObjects
Daily Rate Trend for Jobs with a WFH Option

3-month moving average daily rate quoted in job vacancies with a work from home option citing BusinessObjects.

BusinessObjects daily rate for jobs with a WFH option

BusinessObjects
Daily Rate Histogram for Jobs with a WFH Option

Daily rate distribution for jobs with a work from home option citing BusinessObjects over the 6 months to 6 May 2024.

BusinessObjects daily rate histogram for jobs with a WFH option

BusinessObjects
Hourly Rate Trend for Jobs with a WFH Option

3-month moving average hourly rate quoted in job vacancies with a work from home option citing BusinessObjects.

BusinessObjects hourly rate for jobs with a WFH option

BusinessObjects
Co-occurring Skills and Capabilities with WFH Options by Category

The follow tables expand on the table above by listing co-occurrences grouped by category. The same employment type, locality and period is covered with up to 20 co-occurrences shown in each of the following categories:

Application Platforms
1 1 (2.63%) Confluence
1 1 (2.63%) SAS
Applications
1 3 (7.89%) Microsoft Excel
2 2 (5.26%) Adobe Captivate
2 2 (5.26%) Camtasia
2 2 (5.26%) Lectora
2 2 (5.26%) Microsoft PowerPoint
2 2 (5.26%) Microsoft Project
3 1 (2.63%) Microsoft Office
Business Applications
1 5 (13.16%) iTrent
2 1 (2.63%) NEC Housing
2 1 (2.63%) SAP S/4HANA
Cloud Services
1 13 (34.21%) Power Platform
2 3 (7.89%) AWS
2 3 (7.89%) Azure
3 1 (2.63%) Azure Cosmos DB
3 1 (2.63%) Azure Monitor
3 1 (2.63%) dbt
3 1 (2.63%) GCP
3 1 (2.63%) Snowflake
Database & Business Intelligence
1 13 (34.21%) Power BI
2 3 (7.89%) Data Warehouse
2 3 (7.89%) PostgreSQL
3 2 (5.26%) BusinessObjects XI
3 2 (5.26%) Crystal Reports
3 2 (5.26%) GIS
3 2 (5.26%) SAP HANA
3 2 (5.26%) Tableau
4 1 (2.63%) Amazon RDS
4 1 (2.63%) Amazon Redshift
4 1 (2.63%) Apache Hive
4 1 (2.63%) Data Mining
4 1 (2.63%) Hadoop
4 1 (2.63%) Impala
4 1 (2.63%) MySQL
4 1 (2.63%) NoSQL
4 1 (2.63%) OLAP
4 1 (2.63%) Pentaho
4 1 (2.63%) SAP BW
4 1 (2.63%) SAP Data Services
Development Applications
1 1 (2.63%) Bitbucket
1 1 (2.63%) Git
1 1 (2.63%) GitLab
1 1 (2.63%) Jenkins
1 1 (2.63%) JIRA
General
1 10 (26.32%) Social Skills
2 6 (15.79%) Finance
3 3 (7.89%) Analytical Skills
3 3 (7.89%) Public Sector
4 1 (2.63%) Banking
4 1 (2.63%) Local Government
4 1 (2.63%) Presentation Skills
4 1 (2.63%) Public Speaking
4 1 (2.63%) Retail
Job Titles
1 17 (44.74%) Consultant
2 14 (36.84%) Business Consultant
2 14 (36.84%) SAP BusinessObjects Consultant (SAP BO Consultant)
3 6 (15.79%) Data Scientist
4 4 (10.53%) Analyst
5 3 (7.89%) Administrator
5 3 (7.89%) Data Analyst
5 3 (7.89%) Data Engineer
5 3 (7.89%) Power BI Analyst
5 3 (7.89%) Systems Administrator
6 2 (5.26%) DevOps Engineer
6 2 (5.26%) Infrastructure Analyst
6 2 (5.26%) Learning Technologist
6 2 (5.26%) Payroll Consultant
6 2 (5.26%) Technologist
7 1 (2.63%) Business Data Analyst
7 1 (2.63%) SAP BW Project Manager
7 1 (2.63%) Statistical Data Analyst
7 1 (2.63%) UI Engineer
7 1 (2.63%) UX Engineer
Libraries, Frameworks & Software Standards
1 2 (5.26%) .NET
1 2 (5.26%) Flash
2 1 (2.63%) ADO
2 1 (2.63%) BAPI
2 1 (2.63%) CSS
2 1 (2.63%) CSS3
2 1 (2.63%) Flask
2 1 (2.63%) ggplot2
2 1 (2.63%) HTML
2 1 (2.63%) IDoc
2 1 (2.63%) Pandas
2 1 (2.63%) Plotly
2 1 (2.63%) Shiny
Miscellaneous
1 4 (10.53%) Management Information System
2 2 (5.26%) e-Learning
2 2 (5.26%) Hybrid Cloud
2 2 (5.26%) Learning Management System
2 2 (5.26%) Video Editing
3 1 (2.63%) Housing Association
3 1 (2.63%) Legacy Systems
3 1 (2.63%) NHS
3 1 (2.63%) Product Ownership
Operating Systems
1 1 (2.63%) Unix
Processes & Methodologies
1 10 (26.32%) Visualisation
2 8 (21.05%) Business Intelligence
3 7 (18.42%) Data Analysis
3 7 (18.42%) Data Science
4 5 (13.16%) Mentoring
5 3 (7.89%) Data Visualisation
5 3 (7.89%) ETL
5 3 (7.89%) Problem-Solving
5 3 (7.89%) Project Management
6 2 (5.26%) Actionable Insight
6 2 (5.26%) Asset Management
6 2 (5.26%) Business Case
6 2 (5.26%) Content Development
6 2 (5.26%) Continuous Improvement
6 2 (5.26%) Data Modelling
6 2 (5.26%) Database Migration
6 2 (5.26%) Migration
6 2 (5.26%) Pedagogy
6 2 (5.26%) Scaled Agile Framework
6 2 (5.26%) Web Development
Programming Languages
1 9 (23.68%) Python
2 5 (13.16%) R
2 5 (13.16%) SQL
3 2 (5.26%) JavaScript
4 1 (2.63%) ABAP
4 1 (2.63%) HiveQL
4 1 (2.63%) Java
4 1 (2.63%) PL/SQL
Qualifications
1 16 (42.11%) Security Cleared
2 14 (36.84%) SC Cleared
3 2 (5.26%) AWS Certification
3 2 (5.26%) BPSS Clearance
3 2 (5.26%) Degree
4 1 (2.63%) HNC
Quality Assurance & Compliance
1 2 (5.26%) Accessibility
1 2 (5.26%) Data Quality
2 1 (2.63%) Disclosure Scotland
2 1 (2.63%) QA
System Software
1 1 (2.63%) HDFS
Systems Management
1 1 (2.63%) Ansible
Vendors
1 4 (10.53%) Microsoft
1 4 (10.53%) Oracle
1 4 (10.53%) SAP
2 2 (5.26%) Adobe
2 2 (5.26%) ESRI
3 1 (2.63%) Denodo
3 1 (2.63%) Informatica
3 1 (2.63%) MicroStrategy
3 1 (2.63%) NEC
3 1 (2.63%) Talend