Developer Contracts with Work from Home Options

Developer
UK > Work from Home

The median Developer daily rate in Work from Home is £500 according to job vacancies posted during the 6 months to 9 May 2024.

The first table below provides contractor rate benchmarking and summary statistics including a comparison to same period in the previous 2 years.

6 months to
9 May 2024
Same period 2023 Same period 2022
Rank 3 4 2
Rank change year-on-year +1 -2 0
Contract jobs requiring a Developer 2,703 4,793 8,938
As % of all contract jobs with a WFH option 17.93% 19.10% 20.38%
As % of the Job Titles category 19.17% 20.03% 21.28%
Number of daily rates quoted 1,937 3,589 6,793
10th Percentile £325 £375 £375
25th Percentile £425 £431 £431
Median daily rate (50th Percentile) £500 £525 £525
Median % change year-on-year -4.76% - +10.53%
75th Percentile £638 £650 £625
90th Percentile £775 £775 £725
UK median daily rate £508 £550 £550
% change year-on-year -7.73% - +11.11%
Number of hourly rates quoted 22 64 73
10th Percentile £22.58 £38.95 £35.00
25th Percentile £35.00 £54.69 £40.00
Median hourly rate £57.50 £62.50 £52.50
Median % change year-on-year -8.00% +19.05% +17.98%
75th Percentile £71.88 £75.00 £62.25
90th Percentile £82.95 £83.50 £71.16
UK median hourly rate £65.00 £62.50 £53.75
% change year-on-year +4.00% +16.28% +19.44%

All Contract IT Job Vacancies
Work from Home

The following table is for comparison with the above and includes summary statistics for all contract IT job vacancies with a WFH option. Most job vacancies include a discernible job title that can be normalized. As such, the figures in the second row provide an indication of the number of contract jobs in our overall sample.

Contract vacancies in Work from Home with a recognized job title 14,102 23,924 42,008
% of contract IT jobs with a recognized job title 93.55% 95.36% 95.76%
Number of daily rates quoted 9,465 16,894 30,368
10th Percentile £325 £360 £356
25th Percentile £425 £445 £425
Median daily rate (50th Percentile) £525 £540 £525
Median % change year-on-year -2.78% +2.86% +10.53%
75th Percentile £638 £650 £625
90th Percentile £750 £750 £719
UK median daily rate £525 £540 £525
% change year-on-year -2.78% +2.86% +10.53%
Number of hourly rates quoted 574 548 593
10th Percentile £14.27 £17.50 £13.27
25th Percentile £23.37 £25.71 £18.76
Median hourly rate £44.87 £54.00 £35.00
Median % change year-on-year -16.91% +54.29% +42.86%
75th Percentile £63.75 £68.75 £55.00
90th Percentile £75.25 £80.25 £66.00
UK median hourly rate £36.65 £45.00 £23.91
% change year-on-year -18.56% +88.21% +6.27%

Developer
Trend for Jobs with a WFH Option

Job vacancies with a work from home option which featured Developer in the job title as a proportion of all IT jobs advertised.
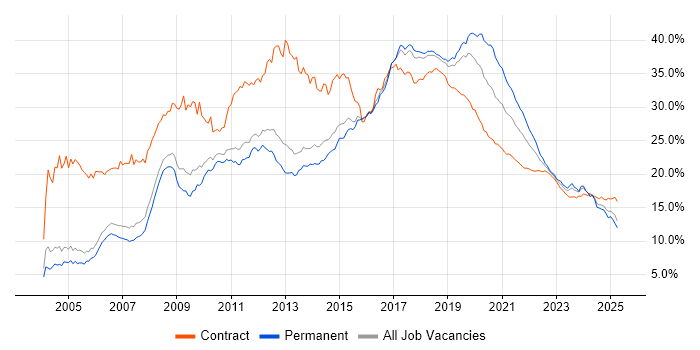
Developer trend for jobs with a WFH option

Developer
Daily Rate Trend for Jobs with a WFH Option

3-month moving average daily rate quoted in job vacancies with a work from home option citing Developer.

Developer daily rate for jobs with a WFH option

Developer
Daily Rate Histogram for Jobs with a WFH Option

Daily rate distribution for jobs with a work from home option citing Developer over the 6 months to 9 May 2024.

Developer daily rate histogram for jobs with a WFH option

Developer
Hourly Rate Trend for Jobs with a WFH Option

3-month moving average hourly rate quoted in job vacancies with a work from home option citing Developer.

Developer hourly rate for jobs with a WFH option

Developer
Hourly Rate Histogram for Jobs with a WFH Option

Hourly rate distribution for jobs with a work from home option citing Developer over the 6 months to 9 May 2024.

Developer hourly rate histogram for jobs with a WFH option

Developer Skill Set
Top 30 Co-occurring Skills and Capabilities in Job Vacancies with WFH Options

For the 6 months to 9 May 2024, Developer contract job roles required the following skills and capabilities in order of popularity. The figures indicate the absolute number co-occurrences and as a proportion of all contract jobs with a WFH option featuring Developer in the job title.

1 640 (23.68%) JavaScript
2 623 (23.05%) SQL
3 590 (21.83%) C#
4 557 (20.61%) Agile
5 503 (18.61%) AWS
6 493 (18.24%) Finance
7 483 (17.87%) Java
8 482 (17.83%) Azure
9 481 (17.80%) Python
10 412 (15.24%) .NET
11 393 (14.54%) HTML
12 382 (14.13%) React
13 379 (14.02%) Social Skills
14 378 (13.98%) Software Engineering
15 340 (12.58%) Degree
16 324 (11.99%) TypeScript
17 321 (11.88%) DevOps
18 316 (11.69%) Full Stack Development
19 308 (11.39%) Code Quality
20 287 (10.62%) Artificial Intelligence
21 270 (9.99%) CSS
22 264 (9.77%) CI/CD
23 261 (9.66%) Microsoft
24 247 (9.14%) Conversational UI
25 245 (9.06%) Chatbot
25 245 (9.06%) SQL Server
26 244 (9.03%) Security Cleared
27 241 (8.92%) PayPal
28 226 (8.36%) Problem-Solving
29 215 (7.95%) AngularJS

Developer Skill Set
Co-occurring Skills and Capabilities with WFH Options by Category

The follow tables expand on the table above by listing co-occurrences grouped by category. The same employment type, locality and period is covered with up to 20 co-occurrences shown in each of the following categories:

Application Platforms
1 53 (1.96%) Apache Airflow
2 50 (1.85%) Apache
3 48 (1.78%) CMS
4 44 (1.63%) SharePoint
5 23 (0.85%) WordPress
6 21 (0.78%) nginx
7 19 (0.70%) SAS
7 19 (0.70%) Umbraco
8 17 (0.63%) Apache Spark
9 15 (0.55%) Confluence
10 12 (0.44%) Headless CMS
11 11 (0.41%) Drupal
12 10 (0.37%) Anypoint
13 9 (0.33%) CICS
14 8 (0.30%) Kentico
14 8 (0.30%) Mule
15 7 (0.26%) Cloud Foundry
16 5 (0.18%) Mule ESB
16 5 (0.18%) Oracle Workflow
16 5 (0.18%) Tomcat
Applications
1 245 (9.06%) Chatbot
2 26 (0.96%) Microsoft Excel
3 10 (0.37%) Microsoft Office
4 4 (0.15%) Microsoft PowerPoint
5 3 (0.11%) Spreadsheet
6 2 (0.074%) 3ds Max
6 2 (0.074%) Blender
7 1 (0.037%) CPLEX
7 1 (0.037%) Houdini
7 1 (0.037%) InDesign
7 1 (0.037%) InVision
7 1 (0.037%) MS Visio
7 1 (0.037%) Photoshop
7 1 (0.037%) Sketch
Business Applications
1 26 (0.96%) Dynamics CRM
2 19 (0.70%) NetSuite
3 15 (0.55%) Endur
4 11 (0.41%) Salesforce CRM
5 9 (0.33%) Payment Gateway
6 8 (0.30%) SAP S/4HANA
7 7 (0.26%) OpenText VIM for SAP
7 7 (0.26%) Oracle EBS
7 7 (0.26%) SAP FI-AP
7 7 (0.26%) Shopify
8 6 (0.22%) Teamcenter
9 5 (0.18%) Aareon QL
9 5 (0.18%) Distributed Ledger
10 4 (0.15%) Magento
10 4 (0.15%) SAP ERP
11 3 (0.11%) Exstream
11 3 (0.11%) RMDS
12 2 (0.074%) Dynamics NAV
12 2 (0.074%) SAP FI
12 2 (0.074%) SAP GTS
Cloud Services
1 503 (18.61%) AWS
2 482 (17.83%) Azure
3 169 (6.25%) Power Platform
4 166 (6.14%) Azure DevOps
5 154 (5.70%) GCP
6 96 (3.55%) Serverless
7 81 (3.00%) GitHub
8 78 (2.89%) PowerApps
9 68 (2.52%) Power Automate
10 61 (2.26%) Dynamics 365
11 53 (1.96%) Azure Service Bus
12 48 (1.78%) AWS Lambda
13 46 (1.70%) Azure Cosmos DB
14 43 (1.59%) Amazon S3
15 42 (1.55%) Azure Functions
16 39 (1.44%) SaaS
17 37 (1.37%) dbt
17 37 (1.37%) Microsoft 365
18 31 (1.15%) Azure Monitor
19 30 (1.11%) Azure Logic Apps
Communications & Networking
1 21 (0.78%) TCP/IP
2 18 (0.67%) HTTP
3 17 (0.63%) SAN
4 7 (0.26%) Intranet
4 7 (0.26%) VPN
5 4 (0.15%) DNS
5 4 (0.15%) Firewall
5 4 (0.15%) FTP
5 4 (0.15%) Internet
5 4 (0.15%) MQTT
5 4 (0.15%) SSL
6 3 (0.11%) Bluetooth
6 3 (0.11%) WAN
7 1 (0.037%) ATM
7 1 (0.037%) DHCP
7 1 (0.037%) Ethernet
7 1 (0.037%) Extranet
7 1 (0.037%) LAN
7 1 (0.037%) SNMP
7 1 (0.037%) Wi-Fi
Database & Business Intelligence
1 245 (9.06%) SQL Server
2 119 (4.40%) PostgreSQL
3 111 (4.11%) Power BI
4 77 (2.85%) MySQL
5 70 (2.59%) NoSQL
6 61 (2.26%) MongoDB
6 61 (2.26%) Oracle Database
7 58 (2.15%) Relational Database
8 47 (1.74%) SQL Server Integration Services
9 43 (1.59%) Data Warehouse
10 39 (1.44%) Apache Ignite
11 37 (1.37%) SQL Server Reporting Services
12 34 (1.26%) Amazon Athena
13 33 (1.22%) Apache Arrow
13 33 (1.22%) Dremio
14 32 (1.18%) Data Lake
15 31 (1.15%) Azure SQL Database
16 23 (0.85%) Oracle Reports
16 23 (0.85%) Redis
17 22 (0.81%) Amazon Aurora
Development Applications
1 150 (5.55%) Git
2 71 (2.63%) Jenkins
3 69 (2.55%) JIRA
4 50 (1.85%) GitLab
5 38 (1.41%) Cypress.io
6 31 (1.15%) Mockito
6 31 (1.15%) Visual Studio
7 29 (1.07%) Cucumber
7 29 (1.07%) JUnit
8 23 (0.85%) Selenium
9 21 (0.78%) Maven
9 21 (0.78%) Oracle Forms
10 19 (0.70%) SpecFlow
11 18 (0.67%) Team Foundation Server
12 17 (0.63%) Oracle APEX
13 15 (0.55%) Visual Studio Code
13 15 (0.55%) webpack
14 13 (0.48%) Storybook
15 11 (0.41%) Android Studio
16 10 (0.37%) TeamCity
General
1 493 (18.24%) Finance
2 379 (14.02%) Social Skills
3 207 (7.66%) Front Office
4 202 (7.47%) Banking
5 176 (6.51%) Public Sector
6 130 (4.81%) Analytical Skills
7 102 (3.77%) Investment Banking
8 44 (1.63%) Retail
9 39 (1.44%) Financial Institution
10 36 (1.33%) Telecoms
11 35 (1.29%) Inclusion and Diversity
12 28 (1.04%) Manufacturing
13 27 (1.00%) Marketing
14 20 (0.74%) Tech for Good
15 14 (0.52%) Back Office
15 14 (0.52%) Law
16 13 (0.48%) Pharmaceutical
17 12 (0.44%) Billing
18 11 (0.41%) Retail Banking
19 10 (0.37%) Games
Libraries, Frameworks & Software Standards
1 412 (15.24%) .NET
2 393 (14.54%) HTML
3 382 (14.13%) React
4 270 (9.99%) CSS
5 215 (7.95%) AngularJS
6 179 (6.62%) Node.js
7 177 (6.55%) REST
8 111 (4.11%) Web Services
9 110 (4.07%) Spring Boot
10 109 (4.03%) Spring
11 98 (3.63%) RESTful
12 89 (3.29%) XML
13 86 (3.18%) .NET Framework
14 84 (3.11%) .NET Core
15 81 (3.00%) GraphQL
16 80 (2.96%) ASP.NET
17 74 (2.74%) Vue
18 71 (2.63%) Kafka
19 58 (2.15%) Next.js
20 53 (1.96%) Redux
Miscellaneous
1 116 (4.29%) Derivative
2 111 (4.11%) Fixed Income
3 72 (2.66%) Hedge funds
4 68 (2.52%) Greenfield Project
4 68 (2.52%) Product Ownership
5 66 (2.44%) Equities
6 58 (2.15%) Foreign Exchange (FX)
7 57 (2.11%) Mobile App
8 51 (1.89%) Distributed Systems
9 44 (1.63%) Algorithms
10 36 (1.33%) Equity Derivative
11 29 (1.07%) Data Structures
12 28 (1.04%) Enterprise Software
13 25 (0.92%) Legacy Systems
14 22 (0.81%) Cloud Native
14 22 (0.81%) Onboarding
15 20 (0.74%) Credit Derivative
16 19 (0.70%) Management Information System
17 15 (0.55%) Blockchain
17 15 (0.55%) Legacy Applications
Operating Systems
1 111 (4.11%) Linux
2 66 (2.44%) Unix
3 51 (1.89%) Android
4 40 (1.48%) Apple iOS
5 20 (0.74%) Windows
6 19 (0.70%) Ubuntu
7 17 (0.63%) Debian
8 9 (0.33%) zOS
9 7 (0.26%) VMS
10 4 (0.15%) OpenVMS
11 3 (0.11%) Mac OS X
11 3 (0.11%) Red Hat Enterprise Linux
12 2 (0.074%) Amazon Linux
12 2 (0.074%) CentOS
12 2 (0.074%) Oracle Linux
13 1 (0.037%) Embedded Linux
13 1 (0.037%) Windows 10
13 1 (0.037%) Windows Server
Processes & Methodologies
1 557 (20.61%) Agile
2 378 (13.98%) Software Engineering
3 321 (11.88%) DevOps
4 316 (11.69%) Full Stack Development
5 308 (11.39%) Code Quality
6 287 (10.62%) Artificial Intelligence
7 264 (9.77%) CI/CD
8 247 (9.14%) Conversational UI
9 226 (8.36%) Problem-Solving
10 197 (7.29%) Front End Development
10 197 (7.29%) Microservices
11 145 (5.36%) Business Intelligence
11 145 (5.36%) TDD
12 137 (5.07%) Test Automation
13 132 (4.88%) Data Modelling
13 132 (4.88%) Unit Testing
14 131 (4.85%) User Experience
15 126 (4.66%) Analytics
15 126 (4.66%) Scrum
16 111 (4.11%) Migration
Programming Languages
1 640 (23.68%) JavaScript
2 623 (23.05%) SQL
3 590 (21.83%) C#
4 483 (17.87%) Java
5 481 (17.80%) Python
6 324 (11.99%) TypeScript
7 90 (3.33%) PHP
8 80 (2.96%) PL/SQL
9 73 (2.70%) C++
10 70 (2.59%) PowerShell
11 50 (1.85%) Kotlin
12 48 (1.78%) Go
13 46 (1.70%) Scala
14 39 (1.44%) ABAP
14 39 (1.44%) Ruby
15 38 (1.41%) Bicep
16 27 (1.00%) Bash
17 24 (0.89%) Data Analysis Expressions
17 24 (0.89%) T-SQL
18 23 (0.85%) COBOL
Qualifications
1 340 (12.58%) Degree
2 244 (9.03%) Security Cleared
3 213 (7.88%) SC Cleared
4 39 (1.44%) Computer Science Degree
5 34 (1.26%) BPSS Clearance
6 24 (0.89%) DV Cleared
7 22 (0.81%) Master's Degree
8 13 (0.48%) PhD
9 7 (0.26%) Azure Certification
10 6 (0.22%) CCNA
10 6 (0.22%) Cisco Certification
11 4 (0.15%) CTC Cleared
12 3 (0.11%) ITIL Certification
12 3 (0.11%) Numerate Degree
13 1 (0.037%) CAPM
13 1 (0.037%) Microsoft Certification
13 1 (0.037%) PMI Certification
13 1 (0.037%) SANS
Quality Assurance & Compliance
1 77 (2.85%) Accessibility
2 64 (2.37%) QA
3 23 (0.85%) Data Quality
3 23 (0.85%) WCAG
4 9 (0.33%) MiFID
5 7 (0.26%) HL7
6 6 (0.22%) Disclosure Scotland
7 5 (0.18%) GDPR
7 5 (0.18%) PCI DSS
8 4 (0.15%) Dodd-Frank
8 4 (0.15%) SEPA
9 3 (0.11%) SLA
10 1 (0.037%) EMIR
10 1 (0.037%) FATCA
10 1 (0.037%) HIPAA
10 1 (0.037%) ISO 20022
10 1 (0.037%) ISO 8583
10 1 (0.037%) NIST
System Software
1 125 (4.62%) Docker
2 46 (1.70%) Active Directory
3 10 (0.37%) IAG
4 8 (0.30%) ACF2
4 8 (0.30%) RACF
5 5 (0.18%) Virtual Machines
6 3 (0.11%) Firmware
6 3 (0.11%) zsh
7 2 (0.074%) Time Sharing Option
8 1 (0.037%) GridGain
8 1 (0.037%) VMware Infrastructure
Systems Management
1 130 (4.81%) Kubernetes
2 81 (3.00%) Terraform
3 20 (0.74%) Grafana
4 19 (0.70%) Ansible
4 19 (0.70%) Single Sign-On
5 9 (0.33%) Prometheus
6 7 (0.26%) CloudHub
7 6 (0.22%) Docker Swarm
7 6 (0.22%) Kibana
8 3 (0.11%) Packer
8 3 (0.11%) Podman
8 3 (0.11%) Zipkin
9 2 (0.074%) CA Endevor
9 2 (0.074%) Istio
9 2 (0.074%) Kustomize
9 2 (0.074%) Progress Chef
9 2 (0.074%) Puppet
10 1 (0.037%) ITRS Geneos
10 1 (0.037%) logstash
10 1 (0.037%) SCOM
Vendors
1 261 (9.66%) Microsoft
2 241 (8.92%) PayPal
3 184 (6.81%) Oracle
4 68 (2.52%) SAP
5 67 (2.48%) ServiceNow
6 61 (2.26%) Salesforce
7 58 (2.15%) Google
8 32 (1.18%) IBM
9 22 (0.81%) Red Hat
10 19 (0.70%) Adobe
10 19 (0.70%) MuleSoft
11 18 (0.67%) Databricks
11 18 (0.67%) VMware
12 15 (0.55%) OpenAI
13 14 (0.52%) Bloomberg
14 13 (0.48%) Guidewire
15 12 (0.44%) OpenLink
15 12 (0.44%) Siebel
15 12 (0.44%) Splunk
16 11 (0.41%) Sybase