Data Structures Contracts with Work from Home Options

Data Structures
UK > Work from Home

The table below looks at the prevalence of the term Data Structures in contract job vacancies with an option to work from home (WFH). Included is a benchmarking guide to the contractor rates offered in vacancies that have cited Data Structures over the 6 months to 13 May 2024 with a comparison to the same period over the previous 2 years.

6 months to
13 May 2024
Same period 2023 Same period 2022
Rank 207 312 267
Rank change year-on-year +105 -45 -8
Contract jobs citing Data Structures 144 158 440
As % of all contract jobs with a WFH option 0.96% 0.63% 0.99%
As % of the Miscellaneous category 3.37% 1.99% 3.16%
Number of daily rates quoted 96 104 298
10th Percentile £400 £413 £406
25th Percentile £450 £476 £490
Median daily rate (50th Percentile) £625 £550 £575
Median % change year-on-year +13.64% -4.35% +4.55%
75th Percentile £700 £650 £739
90th Percentile £744 £796 £833
UK median daily rate £550 £575 £600
% change year-on-year -4.35% -4.17% +9.09%

All Generic Skills
Work from Home

Data Structures is in the General and Transferable Skills category. The following table is for comparison with the above and provides summary statistics for all contract job vacancies with a WFH option and a requirement for generic IT skills.

Contract vacancies with a requirement for generic IT skills 4,276 7,932 13,945
As % of all contract jobs with a WFH option 28.63% 31.49% 31.48%
Number of daily rates quoted 2,924 5,588 9,977
10th Percentile £325 £363 £363
25th Percentile £433 £456 £438
Median daily rate (50th Percentile) £550 £550 £540
Median % change year-on-year - +1.85% +9.09%
75th Percentile £675 £684 £650
90th Percentile £813 £792 £750
UK median daily rate £540 £550 £550
% change year-on-year -1.82% - +10.00%
Number of hourly rates quoted 188 152 226
10th Percentile £16.03 £19.00 £13.19
25th Percentile £25.50 £25.71 £20.75
Median hourly rate £51.75 £52.93 £44.50
Median % change year-on-year -2.22% +18.93% +28.91%
75th Percentile £68.13 £70.00 £60.00
90th Percentile £72.50 £85.00 £67.50
UK median hourly rate £31.25 £22.49 £27.50
% change year-on-year +38.98% -18.24% +3.19%

Data Structures
Trend for Jobs with a WFH Option

Job vacancies with a work from home option citing Data Structures as a proportion of all IT jobs advertised.
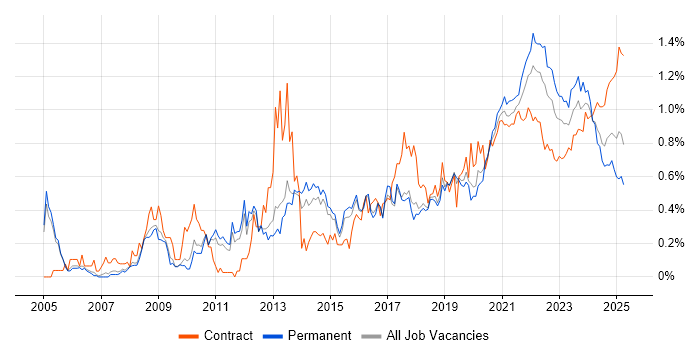
Data Structures trend for jobs with a WFH option

Data Structures
Daily Rate Trend for Jobs with a WFH Option

3-month moving average daily rate quoted in job vacancies with a work from home option citing Data Structures.

Data Structures daily rate for jobs with a WFH option

Data Structures
Daily Rate Histogram for Jobs with a WFH Option

Daily rate distribution for jobs with a work from home option citing Data Structures over the 6 months to 13 May 2024.

Data Structures daily rate histogram for jobs with a WFH option

Data Structures
Hourly Rate Trend for Jobs with a WFH Option

3-month moving average hourly rate quoted in job vacancies with a work from home option citing Data Structures.

Data Structures hourly rate for jobs with a WFH option

Data Structures
Co-occurring Skills and Capabilities with WFH Options by Category

The follow tables expand on the table above by listing co-occurrences grouped by category. The same employment type, locality and period is covered with up to 20 co-occurrences shown in each of the following categories:

Application Platforms
1 18 (12.50%) SharePoint
2 4 (2.78%) Apache Spark
3 3 (2.08%) CMS
3 3 (2.08%) Confluence
3 3 (2.08%) Jupyter
4 1 (0.69%) Ethereum
4 1 (0.69%) Hyperledger
Applications
1 3 (2.08%) Microsoft Excel
2 1 (0.69%) Microsoft Office
2 1 (0.69%) Spreadsheet
Business Applications
1 22 (15.28%) Dynamics AX
2 3 (2.08%) Sparx Enterprise Architect
3 2 (1.39%) Dynamics CRM
3 2 (1.39%) NetSuite
4 1 (0.69%) Oracle EBS
4 1 (0.69%) Oracle Payroll
4 1 (0.69%) SAP S/4HANA
4 1 (0.69%) Shopify
Cloud Services
1 70 (48.61%) Azure
2 24 (16.67%) Dynamics 365
2 24 (16.67%) Power Platform
3 23 (15.97%) Azure DevOps
4 22 (15.28%) Power Automate
4 22 (15.28%) PowerApps
5 19 (13.19%) Microsoft 365
6 17 (11.81%) GCP
7 13 (9.03%) AWS
8 11 (7.64%) Azure Stack
9 8 (5.56%) Microsoft Purview
10 6 (4.17%) GitHub
11 5 (3.47%) Amazon S3
11 5 (3.47%) Google Kubernetes Engine
12 4 (2.78%) AWS Lambda
12 4 (2.78%) Serverless
13 3 (2.08%) Amazon CloudWatch
13 3 (2.08%) Amazon ECS
13 3 (2.08%) Amazon SageMaker
13 3 (2.08%) Kong
Communications & Networking
1 3 (2.08%) DNS
1 3 (2.08%) Firewall
1 3 (2.08%) HTTP
1 3 (2.08%) TCP/IP
1 3 (2.08%) VPN
2 1 (0.69%) BIG-IP
2 1 (0.69%) F5 BIG-IP GTM
2 1 (0.69%) Intrusion Detection
2 1 (0.69%) Reverse Proxy
2 1 (0.69%) Software-Defined Networking
2 1 (0.69%) SSL
2 1 (0.69%) Wireless
Database & Business Intelligence
1 24 (16.67%) Power BI
2 22 (15.28%) Data Lake
3 13 (9.03%) Data Warehouse
4 12 (8.33%) Relational Database
5 11 (7.64%) Snowflake Schema
6 10 (6.94%) MongoDB
7 5 (3.47%) NoSQL
8 4 (2.78%) Big Data
8 4 (2.78%) PostgreSQL
9 3 (2.08%) Elasticsearch
9 3 (2.08%) Tableau
10 2 (1.39%) Data Mining
10 2 (1.39%) Hadoop
10 2 (1.39%) Metadata
10 2 (1.39%) RDBMS
10 2 (1.39%) SQL Server
10 2 (1.39%) Star Schema
11 1 (0.69%) Amazon Aurora
11 1 (0.69%) Delta Lake
11 1 (0.69%) Power Query
Development Applications
1 12 (8.33%) Jenkins
2 9 (6.25%) GitLab
3 8 (5.56%) Git
4 4 (2.78%) ERwin
4 4 (2.78%) JIRA
5 3 (2.08%) Atlassian Bamboo
5 3 (2.08%) CircleCI
5 3 (2.08%) Travis CI
6 2 (1.39%) ER Studio
6 2 (1.39%) PowerDesigner
7 1 (0.69%) Cypress.io
7 1 (0.69%) SonarQube
General
1 64 (44.44%) Social Skills
2 47 (32.64%) Analytical Skills
3 36 (25.00%) Public Sector
4 33 (22.92%) Finance
5 26 (18.06%) Retail
6 22 (15.28%) General Ledger
7 5 (3.47%) Banking
8 4 (2.78%) Presentation Skills
9 2 (1.39%) Inclusion and Diversity
9 2 (1.39%) Investment Banking
9 2 (1.39%) Pharmaceutical
10 1 (0.69%) Automotive
10 1 (0.69%) Billing
10 1 (0.69%) Financial Institution
10 1 (0.69%) Front Office
10 1 (0.69%) Law
10 1 (0.69%) Manufacturing
10 1 (0.69%) Organisational Skills
Job Titles
1 42 (29.17%) Architect
2 29 (20.14%) Developer
3 25 (17.36%) Consultant
4 21 (14.58%) Technical Architect
5 20 (13.89%) Data Architect
6 15 (10.42%) Analyst
7 14 (9.72%) Microsoft Consultant
8 13 (9.03%) Dynamics 365 Consultant
8 13 (9.03%) SharePoint Architect
9 9 (6.25%) Java Developer
9 9 (6.25%) Python Developer
9 9 (6.25%) Python Engineer
9 9 (6.25%) Senior
9 9 (6.25%) Site Engineer
9 9 (6.25%) Site Reliability Engineer
10 8 (5.56%) Data Analyst
11 5 (3.47%) Business Analyst
11 5 (3.47%) Data Scientist
11 5 (3.47%) Functional Consultant
11 5 (3.47%) Java Engineer
Libraries, Frameworks & Software Standards
1 20 (13.89%) JSON
2 16 (11.11%) React
3 15 (10.42%) XML
4 14 (9.72%) Kafka
4 14 (9.72%) REST
4 14 (9.72%) RESTful
5 9 (6.25%) CSS
5 9 (6.25%) HTML
5 9 (6.25%) RabbitMQ
6 8 (5.56%) Django
6 8 (5.56%) Spring
7 7 (4.86%) .NET
8 6 (4.17%) Elastic Stack
9 5 (3.47%) AngularJS
9 5 (3.47%) JSON Schema
9 5 (3.47%) Spring Boot
10 4 (2.78%) Pandas
10 4 (2.78%) YAML
11 3 (2.08%) Flask
11 3 (2.08%) scikit-learn
Miscellaneous
1 36 (25.00%) Algorithms
2 19 (13.19%) Cloud Native
3 18 (12.50%) Distributed Systems
4 9 (6.25%) Product Ownership
5 8 (5.56%) Reference Data
6 4 (2.78%) Data Protection Act
6 4 (2.78%) Management Information System
6 4 (2.78%) Self-Motivation
7 3 (2.08%) Blockchain
7 3 (2.08%) Enterprise Software
7 3 (2.08%) Greenfield Project
7 3 (2.08%) Social Media
8 2 (1.39%) Derivative
8 2 (1.39%) Distributed Applications
8 2 (1.39%) Hedge funds
8 2 (1.39%) Legacy Systems
9 1 (0.69%) Data Fabric
9 1 (0.69%) Hybrid Cloud
9 1 (0.69%) Onboarding
9 1 (0.69%) Public Cloud
Operating Systems
1 14 (9.72%) Linux
2 5 (3.47%) Unix
Processes & Methodologies
1 41 (28.47%) Data Modelling
1 41 (28.47%) DevOps
2 39 (27.08%) Agile
3 38 (26.39%) Business Intelligence
4 34 (23.61%) Microservices
5 30 (20.83%) CI/CD
5 30 (20.83%) Migration
6 25 (17.36%) Change Management
6 25 (17.36%) Data Migration
6 25 (17.36%) Problem-Solving
7 23 (15.97%) Requirements Gathering
8 22 (15.28%) Accounts Payable
8 22 (15.28%) Accounts Receivable
8 22 (15.28%) Requirements Workshops
9 21 (14.58%) Computer Science
10 20 (13.89%) Data Security
11 18 (12.50%) Analytics
12 15 (10.42%) Data Protection
12 15 (10.42%) Machine Learning
12 15 (10.42%) Software Architecture
Programming Languages
1 39 (27.08%) Python
2 28 (19.44%) SQL
3 24 (16.67%) Java
4 13 (9.03%) Shell Script
5 10 (6.94%) JavaScript
6 9 (6.25%) C++
7 8 (5.56%) Go
8 5 (3.47%) Kotlin
8 5 (3.47%) Scala
9 4 (2.78%) Bash
9 4 (2.78%) C#
9 4 (2.78%) Perl
10 3 (2.08%) ABAP
10 3 (2.08%) PowerShell
10 3 (2.08%) R
10 3 (2.08%) Ruby
10 3 (2.08%) TypeScript
11 2 (1.39%) F#
11 2 (1.39%) Rust
12 1 (0.69%) ActionScript
Qualifications
1 28 (19.44%) Degree
2 19 (13.19%) SC Cleared
2 19 (13.19%) Security Cleared
3 10 (6.94%) Computer Science Degree
4 3 (2.08%) BPSS Clearance
5 1 (0.69%) Master's Degree
5 1 (0.69%) Numerate Degree
Quality Assurance & Compliance
1 16 (11.11%) Data Quality
2 7 (4.86%) GDPR
3 6 (4.17%) QA
4 1 (0.69%) Accessibility
4 1 (0.69%) NIST
System Software
1 14 (9.72%) Docker
2 9 (6.25%) Apache ZooKeeper
3 1 (0.69%) Oracle RAC
Systems Management
1 28 (19.44%) Kubernetes
2 15 (10.42%) Prometheus
3 12 (8.33%) Grafana
4 9 (6.25%) Consul
5 4 (2.78%) Terraform
6 3 (2.08%) Ansible
6 3 (2.08%) Docker Swarm
6 3 (2.08%) Kibana
6 3 (2.08%) logstash
6 3 (2.08%) Progress Chef
6 3 (2.08%) Puppet
6 3 (2.08%) Zipkin
7 1 (0.69%) Argo
7 1 (0.69%) Data Guard
7 1 (0.69%) Oracle RMAN
Vendors
1 60 (41.67%) Microsoft
2 18 (12.50%) NetApp
3 9 (6.25%) SaltStack
4 6 (4.17%) SAP
5 5 (3.47%) Oracle
6 4 (2.78%) Splunk
7 3 (2.08%) Facebook
7 3 (2.08%) Instagram
7 3 (2.08%) Sparx
7 3 (2.08%) Twitter
7 3 (2.08%) YouTube
8 2 (1.39%) Google
8 2 (1.39%) IDERA
8 2 (1.39%) Informatica
8 2 (1.39%) Talend
9 1 (0.69%) CA Agile Central
9 1 (0.69%) Cadence
9 1 (0.69%) F5
9 1 (0.69%) MuleSoft
9 1 (0.69%) Salesforce