Relational Database Contracts with Work from Home Options

Relational Database
UK > Work from Home

The table below provides summary statistics for contract job vacancies with an option to work from home (WFH) and a requirement for Relational Database skills. Included is a benchmarking guide to the contractor rates offered in vacancies that have cited Relational Database over the 6 months to 19 April 2024 with a comparison to the same period in the previous 2 years.

6 months to
19 Apr 2024
Same period 2023 Same period 2022
Rank 170 176 162
Rank change year-on-year +6 -14 +7
Contract jobs citing Relational Database 188 376 783
As % of all contract jobs with a WFH option 1.21% 1.43% 1.74%
As % of the Database & Business Intelligence category 6.47% 7.46% 7.99%
Number of daily rates quoted 144 272 546
10th Percentile £363 £413 £398
25th Percentile £463 £475 £470
Median daily rate (50th Percentile) £545 £600 £550
Median % change year-on-year -9.17% +9.09% +10.00%
75th Percentile £628 £750 £653
90th Percentile £721 £775 £738
UK median daily rate £550 £600 £585
% change year-on-year -8.33% +2.56% +12.50%
Number of hourly rates quoted 2 9 13
10th Percentile £23.04 £68.50 £27.96
25th Percentile £26.37 £71.25 £46.25
Median hourly rate £34.17 £75.00 £55.00
Median % change year-on-year -54.45% +36.36% +32.74%
75th Percentile £42.74 - £65.54
90th Percentile £46.55 £80.50 -
UK median hourly rate £35.50 £65.00 £51.85
% change year-on-year -45.38% +25.36% -5.73%

All Database and Business Intelligence Skills
Work from Home

Relational Database is in the Databases and Business Intelligence category. The following table is for comparison with the above and provides summary statistics for all contract job vacancies with a WFH option and a requirement for database or business intelligence skills.

Contract vacancies with a requirement for database or business intelligence skills 2,907 5,038 9,805
As % of all contract jobs with a WFH option 18.69% 19.12% 21.77%
Number of daily rates quoted 2,132 3,662 7,141
10th Percentile £350 £385 £365
25th Percentile £425 £450 £438
Median daily rate (50th Percentile) £513 £536 £525
Median % change year-on-year -4.30% +2.00% +6.06%
75th Percentile £650 £650 £634
90th Percentile £738 £750 £725
UK median daily rate £525 £545 £540
% change year-on-year -3.67% +0.93% +8.00%
Number of hourly rates quoted 38 76 86
10th Percentile £20.24 £22.16 £18.81
25th Percentile £22.34 £43.60 £21.38
Median hourly rate £37.75 £66.00 £43.54
Median % change year-on-year -42.80% +51.58% +45.14%
75th Percentile £57.81 £75.00 £57.19
90th Percentile £69.88 £87.90 £65.54
UK median hourly rate £40.00 £60.00 £40.00
% change year-on-year -33.33% +50.00% +50.94%

Relational Database
Trend for Jobs with a WFH Option

Job vacancies with a work from home option citing Relational Database as a proportion of all IT jobs advertised.
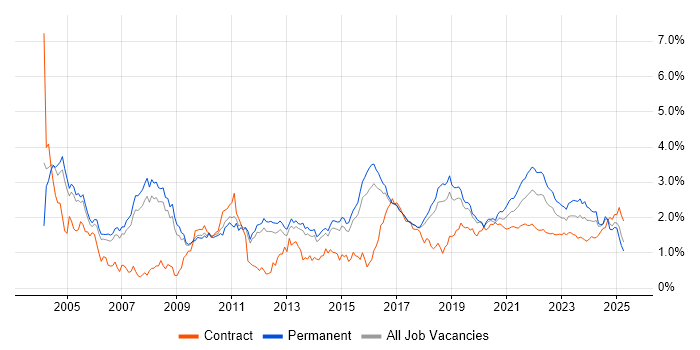
Relational Database trend for jobs with a WFH option

Relational Database
Daily Rate Trend for Jobs with a WFH Option

3-month moving average daily rate quoted in job vacancies with a work from home option citing Relational Database.

Relational Database daily rate for jobs with a WFH option

Relational Database
Daily Rate Histogram for Jobs with a WFH Option

Daily rate distribution for jobs with a work from home option citing Relational Database over the 6 months to 19 April 2024.

Relational Database daily rate histogram for jobs with a WFH option

Relational Database
Hourly Rate Trend for Jobs with a WFH Option

3-month moving average hourly rate quoted in job vacancies with a work from home option citing Relational Database.

Relational Database hourly rate for jobs with a WFH option

Relational Database
Hourly Rate Histogram for Jobs with a WFH Option

Hourly rate distribution for jobs with a work from home option citing Relational Database over the 6 months to 19 April 2024.

Relational Database hourly rate histogram for jobs with a WFH option

Relational Database
Co-occurring Skills and Capabilities with WFH Options by Category

The follow tables expand on the table above by listing co-occurrences grouped by category. The same employment type, locality and period is covered with up to 20 co-occurrences shown in each of the following categories:

Application Platforms
1 8 (4.26%) JBoss
1 8 (4.26%) SharePoint
2 6 (3.19%) Apache Spark
2 6 (3.19%) Confluence
3 4 (2.13%) WebSphere
4 3 (1.60%) Apache
4 3 (1.60%) nginx
4 3 (1.60%) Tomcat
4 3 (1.60%) WebLogic
5 2 (1.06%) Microsoft Exchange
6 1 (0.53%) Apache Solr
6 1 (0.53%) Appian
6 1 (0.53%) ArcGIS
6 1 (0.53%) OpenStack
6 1 (0.53%) Oracle Workflow
6 1 (0.53%) SAS
6 1 (0.53%) SharePoint Server
6 1 (0.53%) ThingWorx
Applications
1 5 (2.66%) Microsoft Excel
2 2 (1.06%) Microsoft Office
2 2 (1.06%) MS Visio
3 1 (0.53%) Microsoft PowerPoint
Business Applications
1 3 (1.60%) MIS ActiveH
1 3 (1.60%) NEC Housing
1 3 (1.60%) Temenos T24
2 2 (1.06%) OPENHousing
3 1 (0.53%) Dynamics CRM
3 1 (0.53%) Loan IQ
3 1 (0.53%) Orchestrade
Cloud Services
1 71 (37.77%) AWS
2 60 (31.91%) Azure
3 22 (11.70%) Serverless
4 15 (7.98%) Amazon S3
5 13 (6.91%) AWS CloudFormation
5 13 (6.91%) Power Platform
6 12 (6.38%) GCP
6 12 (6.38%) SaaS
7 11 (5.85%) Amazon CloudWatch
7 11 (5.85%) Amazon EC2
7 11 (5.85%) Azure DevOps
8 10 (5.32%) Microsoft 365
9 9 (4.79%) GitHub
10 5 (2.66%) Azure Data Factory
10 5 (2.66%) Dynamics 365
10 5 (2.66%) PaaS
11 4 (2.13%) Amazon SQS
11 4 (2.13%) AWS Lambda
12 3 (1.60%) AWS Fargate
12 3 (1.60%) OpenShift
Communications & Networking
1 13 (6.91%) Firewall
2 11 (5.85%) TCP/IP
3 9 (4.79%) DNS
4 8 (4.26%) VPN
5 3 (1.60%) BGP
5 3 (1.60%) Cisco IOS
5 3 (1.60%) Internet
5 3 (1.60%) IOS XR
6 2 (1.06%) FTP
6 2 (1.06%) HTTP
7 1 (0.53%) DHCP
7 1 (0.53%) Intranet
7 1 (0.53%) Network Security
7 1 (0.53%) SAN
7 1 (0.53%) VLAN
Database & Business Intelligence
1 63 (33.51%) RDBMS
2 59 (31.38%) SQL Server
3 34 (18.09%) PostgreSQL
4 30 (15.96%) NoSQL
5 27 (14.36%) MySQL
6 25 (13.30%) Data Warehouse
7 21 (11.17%) MongoDB
8 14 (7.45%) Oracle Reports
9 10 (5.32%) Tableau
10 9 (4.79%) Azure SQL Database
11 8 (4.26%) Big Data
11 8 (4.26%) Power BI
12 7 (3.72%) Amazon RDS
13 6 (3.19%) Data Lake
13 6 (3.19%) Metadata
14 5 (2.66%) Amazon Aurora
14 5 (2.66%) Elasticsearch
14 5 (2.66%) Oracle Database
15 4 (2.13%) Amazon Redshift
15 4 (2.13%) Data Mining
Development Applications
1 18 (9.57%) Git
1 18 (9.57%) JIRA
2 9 (4.79%) Cypress.io
3 8 (4.26%) Jenkins
4 6 (3.19%) TeamCity
5 5 (2.66%) Postman
5 5 (2.66%) SonarQube
6 4 (2.13%) GitLab
6 4 (2.13%) Selenium
7 3 (1.60%) Bitbucket
7 3 (1.60%) Bitbucket Server
7 3 (1.60%) CA Release Automation
7 3 (1.60%) HP UFT
7 3 (1.60%) Katalon Studio
7 3 (1.60%) Sonatype Nexus
8 2 (1.06%) Burp Suite
8 2 (1.06%) JUnit
8 2 (1.06%) Visual Studio
9 1 (0.53%) AppScan
9 1 (0.53%) Toad
General
1 72 (38.30%) Social Skills
2 33 (17.55%) Analytical Skills
3 23 (12.23%) Public Sector
4 19 (10.11%) Finance
5 12 (6.38%) Banking
6 9 (4.79%) Influencing Skills
7 8 (4.26%) Front Office
7 8 (4.26%) Marketing
8 7 (3.72%) Manufacturing
9 4 (2.13%) Health Technology
10 3 (1.60%) Telecoms
11 2 (1.06%) Financial Institution
11 2 (1.06%) Investment Banking
11 2 (1.06%) Legal
11 2 (1.06%) Organisational Skills
11 2 (1.06%) Presentation Skills
11 2 (1.06%) Retail
12 1 (0.53%) Agriculture
12 1 (0.53%) Pharmaceutical
12 1 (0.53%) Social Housing
Job Titles
1 51 (27.13%) Developer
2 30 (15.96%) Architect
3 28 (14.89%) DBA
4 14 (7.45%) PostgreSQL DBA
4 14 (7.45%) Senior
5 13 (6.91%) Analyst
5 13 (6.91%) Lead
6 11 (5.85%) Data Architect
6 11 (5.85%) Data Engineer
7 10 (5.32%) Administrator
7 10 (5.32%) Solutions Architect
8 8 (4.26%) .NET Developer
8 8 (4.26%) DevOps Engineer
8 8 (4.26%) Full Stack Developer
8 8 (4.26%) Java Developer
8 8 (4.26%) Technical Architect
9 7 (3.72%) Business Analyst
9 7 (3.72%) Consultant
9 7 (3.72%) React Developer
10 6 (3.19%) Senior Developer
Libraries, Frameworks & Software Standards
1 24 (12.77%) Kafka
2 23 (12.23%) JSON
3 22 (11.70%) RESTful
4 20 (10.64%) React
5 19 (10.11%) XML
6 18 (9.57%) REST
7 16 (8.51%) .NET
8 15 (7.98%) AngularJS
8 15 (7.98%) Spring Boot
9 14 (7.45%) Elastic Stack
10 13 (6.91%) HTML
10 13 (6.91%) Spring
11 12 (6.38%) Web Services
12 11 (5.85%) CSS
13 10 (5.32%) .NET Framework
13 10 (5.32%) ASP.NET
14 9 (4.79%) SOAP
15 8 (4.26%) jQuery
16 7 (3.72%) Django
16 7 (3.72%) Node.js
Miscellaneous
1 15 (7.98%) Public Cloud
2 10 (5.32%) Distributed Systems
2 10 (5.32%) Product Ownership
3 9 (4.79%) Data Structures
4 8 (4.26%) NHS
5 7 (3.72%) Algorithms
5 7 (3.72%) Foreign Exchange (FX)
5 7 (3.72%) Management Information System
6 6 (3.19%) Cloud Native
7 5 (2.66%) Data Protection Act
7 5 (2.66%) Enterprise Software
7 5 (2.66%) IoT
7 5 (2.66%) Low-Code
8 4 (2.13%) Derivative
8 4 (2.13%) Fixed Income
9 3 (1.60%) Linux Command Line
9 3 (1.60%) Private Cloud
9 3 (1.60%) Self-Motivation
10 2 (1.06%) Analytical Mindset
10 2 (1.06%) Legacy Systems
Operating Systems
1 28 (14.89%) Linux
2 21 (11.17%) Windows
3 8 (4.26%) Red Hat Enterprise Linux
3 8 (4.26%) Unix
4 5 (2.66%) Windows Server
5 1 (0.53%) CentOS
5 1 (0.53%) Windows Server 2016
5 1 (0.53%) Windows Server 2019
5 1 (0.53%) zOS
Processes & Methodologies
1 73 (38.83%) Agile
2 52 (27.66%) DevOps
3 36 (19.15%) Problem-Solving
4 32 (17.02%) CI/CD
5 31 (16.49%) Data Modelling
6 27 (14.36%) Migration
7 23 (12.23%) SDLC
8 21 (11.17%) Microservices
8 21 (11.17%) Test Automation
9 19 (10.11%) Mentoring
10 18 (9.57%) Design Patterns
11 17 (9.04%) ETL
12 16 (8.51%) Business Intelligence
12 16 (8.51%) Continuous Integration
12 16 (8.51%) Full Stack Development
13 15 (7.98%) Analytics
13 15 (7.98%) Computer Science
13 15 (7.98%) Data Management
13 15 (7.98%) Database Security
13 15 (7.98%) Project Management
Programming Languages
1 88 (46.81%) SQL
2 44 (23.40%) Java
3 34 (18.09%) C#
4 33 (17.55%) Python
5 26 (13.83%) JavaScript
6 14 (7.45%) TypeScript
7 12 (6.38%) PowerShell
8 8 (4.26%) Bash
9 7 (3.72%) PHP
10 6 (3.19%) Perl
10 6 (3.19%) Shell Script
10 6 (3.19%) T-SQL
11 5 (2.66%) C++
12 4 (2.13%) Go
12 4 (2.13%) Scala
13 3 (1.60%) Kotlin
13 3 (1.60%) PL/SQL
14 2 (1.06%) Ruby
14 2 (1.06%) Rust
14 2 (1.06%) VB.NET
Qualifications
1 25 (13.30%) Degree
2 22 (11.70%) Security Cleared
3 19 (10.11%) SC Cleared
4 15 (7.98%) Computer Science Degree
5 6 (3.19%) AWS Certification
6 5 (2.66%) Microsoft Certification
7 2 (1.06%) Azure Certification
7 2 (1.06%) Master's Degree
7 2 (1.06%) SANS
8 1 (0.53%) AWS Certified DevOps Engineer
8 1 (0.53%) AWS Certified Solutions Architect
8 1 (0.53%) DV Cleared
8 1 (0.53%) ITIL Certification
Quality Assurance & Compliance
1 22 (11.70%) QA
2 10 (5.32%) Data Quality
3 3 (1.60%) Accessibility
3 3 (1.60%) MiFID
4 2 (1.06%) GDPR
5 1 (0.53%) COPPA
5 1 (0.53%) EMIR
5 1 (0.53%) FATCA
5 1 (0.53%) HIPAA
5 1 (0.53%) ISO 20022
5 1 (0.53%) ISO/IEC 27001
5 1 (0.53%) NIST
System Software
1 20 (10.64%) Docker
2 9 (4.79%) Active Directory
3 2 (1.06%) Hyper-V
Systems Management
1 24 (12.77%) Kubernetes
2 19 (10.11%) Ansible
2 19 (10.11%) Terraform
3 11 (5.85%) Grafana
4 10 (5.32%) Prometheus
5 9 (4.79%) Nagios
6 7 (3.72%) Graylog
7 6 (3.19%) Progress Chef
8 5 (2.66%) Kibana
9 3 (1.60%) Puppet
10 2 (1.06%) Opsgenie
10 2 (1.06%) Packer
10 2 (1.06%) Zipkin
11 1 (0.53%) Control-M
11 1 (0.53%) HP Fortify
11 1 (0.53%) logstash
11 1 (0.53%) Nessus
11 1 (0.53%) NetBackup
11 1 (0.53%) VxRail
11 1 (0.53%) WebInspect
Vendors
1 48 (25.53%) Oracle
2 33 (17.55%) Microsoft
3 14 (7.45%) Splunk
4 9 (4.79%) AVEVA
4 9 (4.79%) Red Hat
5 8 (4.26%) IBM
5 8 (4.26%) SAP
6 7 (3.72%) Google
7 4 (2.13%) Brio
7 4 (2.13%) Salesforce
7 4 (2.13%) ServiceNow
8 3 (1.60%) AppDynamics
8 3 (1.60%) Atlassian
8 3 (1.60%) Cisco
8 3 (1.60%) Dynatrace
8 3 (1.60%) Micro Focus
8 3 (1.60%) Murex
8 3 (1.60%) NEC
8 3 (1.60%) Temenos
8 3 (1.60%) TOWER Software