SAP Contracts with Work from Home Options

SAP
UK > Work from Home

The table below provides summary statistics for contract job vacancies with an option to work from home (WFH) and a requirement for knowledge and experience of SAP products and/or services. Included is a benchmarking guide to the contractor rates offered in vacancies that have cited SAP over the 6 months to 5 May 2024 with a comparison to the same period in the previous 2 years.

The figures below represent the IT contractor job market in general and are not representative of contractor rates within SAP SE.

6 months to
5 May 2024
Same period 2023 Same period 2022
Rank 26 30 49
Rank change year-on-year +4 +19 -11
Contract jobs citing SAP 981 1,675 2,266
As % of all contract jobs with a WFH option 6.47% 6.56% 5.08%
As % of the Vendors category 15.29% 15.23% 13.00%
Number of daily rates quoted 470 868 1,349
10th Percentile £381 £400 £406
25th Percentile £450 £474 £463
Median daily rate (50th Percentile) £550 £550 £550
Median % change year-on-year - - +10.00%
75th Percentile £688 £663 £650
90th Percentile £789 £750 £738
UK median daily rate £560 £550 £550
% change year-on-year +1.82% - +10.00%
Number of hourly rates quoted 29 37 19
10th Percentile £12.75 £35.73 £12.41
25th Percentile £17.00 £42.50 £18.13
Median hourly rate £35.00 £45.00 £45.00
Median % change year-on-year -22.22% - +6.51%
75th Percentile £55.00 £49.00 £56.25
90th Percentile £61.25 £85.50 £70.00
UK median hourly rate £25.75 £45.00 £29.38
% change year-on-year -42.78% +53.17% +40.24%

All Vendors
Work from Home

SAP is in the Vendor Products and Services category. The following table is for comparison with the above and provides summary statistics for all contract job vacancies with a WFH option and a requirement for knowledge or experience of vendor products and services.

Contract vacancies with a requirement for knowledge or experience of vendor products and services 6,417 11,001 17,434
As % of all contract jobs with a WFH option 42.35% 43.08% 39.10%
Number of daily rates quoted 3,989 7,393 11,880
10th Percentile £325 £330 £345
25th Percentile £425 £425 £425
Median daily rate (50th Percentile) £525 £525 £525
Median % change year-on-year - - +10.53%
75th Percentile £625 £650 £625
90th Percentile £725 £750 £713
UK median daily rate £515 £525 £525
% change year-on-year -1.90% - +10.53%
Number of hourly rates quoted 220 259 257
10th Percentile £13.92 £17.50 £13.26
25th Percentile £16.93 £31.09 £18.75
Median hourly rate £30.56 £54.00 £35.00
Median % change year-on-year -43.41% +54.29% +16.67%
75th Percentile £58.13 £68.75 £52.50
90th Percentile £70.00 £80.25 £66.30
UK median hourly rate £22.15 £42.50 £21.50
% change year-on-year -47.88% +97.67% -2.27%

SAP
Trend for Jobs with a WFH Option

Job vacancies with a work from home option citing SAP as a proportion of all IT jobs advertised.
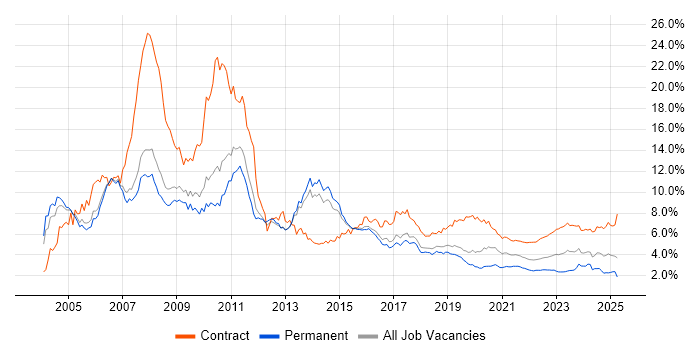
SAP trend for jobs with a WFH option

SAP
Daily Rate Trend for Jobs with a WFH Option

3-month moving average daily rate quoted in job vacancies with a work from home option citing SAP.

SAP daily rate for jobs with a WFH option

SAP
Daily Rate Histogram for Jobs with a WFH Option

Daily rate distribution for jobs with a work from home option citing SAP over the 6 months to 5 May 2024.

SAP daily rate histogram for jobs with a WFH option

SAP
Hourly Rate Trend for Jobs with a WFH Option

3-month moving average hourly rate quoted in job vacancies with a work from home option citing SAP.

SAP hourly rate for jobs with a WFH option

SAP
Hourly Rate Histogram for Jobs with a WFH Option

Hourly rate distribution for jobs with a work from home option citing SAP over the 6 months to 5 May 2024.

SAP hourly rate histogram for jobs with a WFH option

SAP
Co-occurring Skills and Capabilities with WFH Options by Category

The follow tables expand on the table above by listing co-occurrences grouped by category. The same employment type, locality and period is covered with up to 20 co-occurrences shown in each of the following categories:

Application Platforms
1 21 (2.14%) Confluence
2 13 (1.33%) Adobe Experience Manager
3 11 (1.12%) NetWeaver
4 10 (1.02%) SharePoint
5 5 (0.51%) Cloud Foundry
6 3 (0.31%) CMS
6 3 (0.31%) OpenStack
7 2 (0.20%) Oracle SOA Suite
7 2 (0.20%) Oracle Workflow
8 1 (0.10%) Anypoint
8 1 (0.10%) ArcGIS
8 1 (0.10%) IBM HTTP Server
8 1 (0.10%) NServiceBus
8 1 (0.10%) SAS
Applications
1 23 (2.34%) Microsoft Excel
2 18 (1.83%) Microsoft Office
3 14 (1.43%) Microsoft PowerPoint
4 6 (0.61%) Spreadsheet
5 3 (0.31%) Microsoft Project
6 2 (0.20%) MS Visio
Business Applications
1 337 (34.35%) SAP S/4HANA
2 48 (4.89%) SAP FI
3 42 (4.28%) SAP SD
4 35 (3.57%) SAP EWM
5 32 (3.26%) SAP CO
6 29 (2.96%) SAP FI/CO
7 27 (2.75%) SAP MDG
8 22 (2.24%) SAP ERP
9 20 (2.04%) SAP HCM
10 19 (1.94%) OpenText VIM for SAP
10 19 (1.94%) SAP HR
11 18 (1.83%) SAP Hybris
12 16 (1.63%) SAP IBP
13 15 (1.53%) SAP MM
14 14 (1.43%) SAP PP
14 14 (1.43%) SAP PS
15 12 (1.22%) SAP Retail
16 11 (1.12%) SAP Payroll
16 11 (1.12%) SAP PM
16 11 (1.12%) SAP QM
Cloud Services
1 87 (8.87%) SuccessFactors
2 62 (6.32%) Azure
3 27 (2.75%) AWS
4 24 (2.45%) Azure DevOps
5 23 (2.34%) SAP Commerce Cloud
6 14 (1.43%) Power Platform
7 13 (1.33%) SaaS
7 13 (1.33%) WhatsApp
8 12 (1.22%) PaaS
9 11 (1.12%) Microsoft 365
10 10 (1.02%) Dynamics 365
11 8 (0.82%) Amazon EC2
11 8 (0.82%) IaaS
12 6 (0.61%) Cloud Computing
12 6 (0.61%) Miro
12 6 (0.61%) Virtual Private Cloud
13 5 (0.51%) BigCommerce
13 5 (0.51%) Serverless
14 4 (0.41%) PowerApps
14 4 (0.41%) SAP Fieldglass
Communications & Networking
1 7 (0.71%) 3G
1 7 (0.71%) 4G
2 5 (0.51%) HTTP
3 4 (0.41%) VPN
4 3 (0.31%) FTP
4 3 (0.31%) WinSCP
5 2 (0.20%) Internet
6 1 (0.10%) DNS
6 1 (0.10%) Firewall
6 1 (0.10%) InfiniBand
6 1 (0.10%) SD-WAN
6 1 (0.10%) TCP/IP
6 1 (0.10%) WAN
Database & Business Intelligence
1 44 (4.49%) SAP HANA
2 26 (2.65%) SAP BW
3 23 (2.34%) SQL Server
4 14 (1.43%) Metadata
5 13 (1.33%) Power BI
6 10 (1.02%) Oracle Database
7 8 (0.82%) SAP Data Services
8 7 (0.71%) Relational Database
9 6 (0.61%) Amazon RDS
9 6 (0.61%) Ingres
10 5 (0.51%) GIS
11 4 (0.41%) BusinessObjects
11 4 (0.41%) NoSQL
11 4 (0.41%) Tableau
12 3 (0.31%) Data Lake
12 3 (0.31%) Data Warehouse
12 3 (0.31%) PostgreSQL
12 3 (0.31%) Sybase ASE
13 2 (0.20%) BusinessObjects Business Intelligence
13 2 (0.20%) MySQL
Development Applications
1 38 (3.87%) JIRA
2 15 (1.53%) Jenkins
3 14 (1.43%) Git
4 12 (1.22%) ERwin
5 7 (0.71%) Cypress.io
6 6 (0.61%) Postman
7 5 (0.51%) SoapUI
8 4 (0.41%) Eclipse
8 4 (0.41%) LSMW
8 4 (0.41%) Maven
8 4 (0.41%) NUnit
8 4 (0.41%) Selenium
8 4 (0.41%) TeamCity
9 3 (0.31%) Cucumber
9 3 (0.31%) GitLab
9 3 (0.31%) Visual Studio
10 2 (0.20%) Gradle
10 2 (0.20%) Mocha
10 2 (0.20%) TestNG
10 2 (0.20%) WebDriver
General
1 308 (31.40%) Finance
2 235 (23.96%) Social Skills
3 172 (17.53%) Manufacturing
4 137 (13.97%) Public Sector
5 112 (11.42%) Marketing
6 111 (11.31%) Telecoms
7 101 (10.30%) Electronics
8 76 (7.75%) Analytical Skills
9 73 (7.44%) Retail
10 45 (4.59%) Pharmaceutical
11 30 (3.06%) Billing
12 20 (2.04%) Banking
12 20 (2.04%) Influencing Skills
12 20 (2.04%) Presentation Skills
13 15 (1.53%) Legal
14 13 (1.33%) German Language
15 12 (1.22%) Organisational Skills
16 11 (1.12%) French Language
17 8 (0.82%) Spanish Language
18 7 (0.71%) General Ledger
Job Titles
1 293 (29.87%) Consultant
2 248 (25.28%) SAP Consultant
3 132 (13.46%) Lead
4 111 (11.31%) Architect
5 82 (8.36%) Analyst
6 70 (7.14%) Developer
6 70 (7.14%) SAP Manager
7 62 (6.32%) Project Manager
8 51 (5.20%) Senior
9 47 (4.79%) SAP Architect
10 45 (4.59%) Business Analyst
10 45 (4.59%) Solutions Architect
11 44 (4.49%) Functional Consultant
12 41 (4.18%) SAP Functional Consultant
13 39 (3.98%) SAP Developer
14 33 (3.36%) SAP Project Manager
15 26 (2.65%) SAP Analyst
15 26 (2.65%) SAP Solutions Architect
16 23 (2.34%) SAP SD Consultant
17 21 (2.14%) SAP S/4HANA Consultant
Libraries, Frameworks & Software Standards
1 27 (2.75%) SAP Fiori
2 25 (2.55%) EDI
3 20 (2.04%) IDoc
4 19 (1.94%) .NET
4 19 (1.94%) REST
5 16 (1.63%) SAP Basis
6 15 (1.53%) Web Services
7 12 (1.22%) Node.js
8 11 (1.12%) CSS
8 11 (1.12%) HTML
8 11 (1.12%) Middleware
8 11 (1.12%) SAP TM
8 11 (1.12%) SAPUI5
9 10 (1.02%) AngularJS
10 9 (0.92%) BAPI
10 9 (0.92%) XML
11 8 (0.82%) SAP ALE
11 8 (0.82%) SAP Business Workflow
11 8 (0.82%) Web Dynpro
12 7 (0.71%) React
Miscellaneous
1 30 (3.06%) Onboarding
2 21 (2.14%) FMCG
3 20 (2.04%) Replication
4 19 (1.94%) Greenfield Project
5 18 (1.83%) Management Information System
6 15 (1.53%) Data Protection Act
7 14 (1.43%) Product Ownership
8 12 (1.22%) Life Science
8 12 (1.22%) Wiki
9 10 (1.02%) Cloud Native
9 10 (1.02%) Self-Motivation
10 9 (0.92%) Public Cloud
11 8 (0.82%) IoT
11 8 (0.82%) Legacy Systems
12 7 (0.71%) Blog
13 6 (0.61%) Analytical Mindset
13 6 (0.61%) Data Structures
14 5 (0.51%) Foreign Exchange (FX)
14 5 (0.51%) Virtual Team
15 4 (0.41%) NHS
Operating Systems
1 28 (2.85%) Linux
2 20 (2.04%) Windows
3 17 (1.73%) Unix
4 5 (0.51%) Windows Server
5 4 (0.41%) Windows 7
6 3 (0.31%) Windows 10
7 2 (0.20%) Windows Server 2016
8 1 (0.10%) Mac OS
8 1 (0.10%) Red Hat Enterprise Linux
8 1 (0.10%) VMS
8 1 (0.10%) Windows Server 2008
8 1 (0.10%) Windows Server 2012
8 1 (0.10%) Windows Server 2019
Processes & Methodologies
1 131 (13.35%) Agile
2 125 (12.74%) Business Intelligence
2 125 (12.74%) ERP
3 122 (12.44%) Migration
4 115 (11.72%) Project Management
5 112 (11.42%) Programme Management
6 111 (11.31%) Stakeholder Management
7 101 (10.30%) Digital Marketing
8 85 (8.66%) Problem-Solving
9 78 (7.95%) Data Migration
10 55 (5.61%) Analytics
11 54 (5.50%) Logistics
12 53 (5.40%) DevOps
13 49 (4.99%) User Acceptance Testing
14 47 (4.79%) Data Modelling
15 46 (4.69%) Change Management
16 45 (4.59%) Roadmaps
17 43 (4.38%) Project Delivery
18 40 (4.08%) Continuous Improvement
19 38 (3.87%) Requirements Gathering
Programming Languages
1 79 (8.05%) ABAP
2 66 (6.73%) SQL
3 27 (2.75%) Python
4 24 (2.45%) Java
5 22 (2.24%) JavaScript
6 16 (1.63%) C#
6 16 (1.63%) PowerShell
7 8 (0.82%) TypeScript
8 7 (0.71%) PL/SQL
9 6 (0.61%) Kusto Query Language
10 3 (0.31%) Bash
10 3 (0.31%) C
10 3 (0.31%) Perl
10 3 (0.31%) R
11 2 (0.20%) Data Analysis Expressions
11 2 (0.20%) Groovy
11 2 (0.20%) MATLAB
12 1 (0.10%) Go
12 1 (0.10%) Shell Script
12 1 (0.10%) T-SQL
Qualifications
1 117 (11.93%) Security Cleared
2 94 (9.58%) SC Cleared
3 56 (5.71%) Degree
4 38 (3.87%) SAP Certification
5 21 (2.14%) DV Cleared
6 11 (1.12%) PMI Certification
6 11 (1.12%) PMP
7 10 (1.02%) AWS Certification
7 10 (1.02%) BPSS Clearance
7 10 (1.02%) Computer Science Degree
8 7 (0.71%) ISTQB
8 7 (0.71%) Master's Degree
9 3 (0.31%) Azure Certification
9 3 (0.31%) CCA
9 3 (0.31%) CIMA
10 2 (0.20%) ACCA
10 2 (0.20%) CAPM
10 2 (0.20%) MBA
11 1 (0.10%) CEH
11 1 (0.10%) CISSP
Quality Assurance & Compliance
1 41 (4.18%) QA
2 21 (2.14%) Data Quality
3 20 (2.04%) SLA
4 19 (1.94%) GDPR
5 18 (1.83%) PMO
6 6 (0.61%) IFRS
7 4 (0.41%) Accessibility
8 3 (0.31%) GAAP
8 3 (0.31%) ISO 20022
8 3 (0.31%) ISO 9001
8 3 (0.31%) Sarbanes-Oxley
9 2 (0.20%) GRC
9 2 (0.20%) GxP
9 2 (0.20%) PCI DSS
10 1 (0.10%) COSO
10 1 (0.10%) GAMP
10 1 (0.10%) ISO/IEC 27001
10 1 (0.10%) ITGC
10 1 (0.10%) NIST
10 1 (0.10%) Transfer of Undertakings (Protection of Employment)
System Software
1 22 (2.24%) Active Directory
2 10 (1.02%) Docker
3 2 (0.20%) Firmware
4 1 (0.10%) Hyper-V
4 1 (0.10%) Virtual Machines
4 1 (0.10%) VMware Infrastructure
Systems Management
1 18 (1.83%) Terraform
2 8 (0.82%) Kubernetes
3 4 (0.41%) HP ALM
4 2 (0.20%) Ansible
4 2 (0.20%) Single Sign-On
5 1 (0.10%) Dell DRAC
5 1 (0.10%) Grafana
5 1 (0.10%) HP Quality Center
5 1 (0.10%) Istio
5 1 (0.10%) Prometheus
5 1 (0.10%) Puppet
Vendors
1 81 (8.26%) Ariba
2 65 (6.63%) Microsoft
3 62 (6.32%) Oracle
4 32 (3.26%) Salesforce
5 28 (2.85%) Adobe
6 24 (2.45%) ServiceNow
7 18 (1.83%) OpenText
8 12 (1.22%) Sparx
9 11 (1.12%) Workday
10 8 (0.82%) IBM
11 7 (0.71%) Dell
12 6 (0.61%) MuleSoft
13 5 (0.51%) Apple
13 5 (0.51%) Concur
13 5 (0.51%) Google
13 5 (0.51%) HP
13 5 (0.51%) Murex
13 5 (0.51%) Sitecore
14 4 (0.41%) Computacenter
14 4 (0.41%) ESRI