Unix Contracts with Hybrid/Remote/WFH Options

Unix
UK > Work from Home

The table below provides summary statistics for remote or hybrid contract work requiring Unix skills. It includes a benchmarking guide to the contractor rates offered in vacancies that cited Unix over the 6 months leading up to 1 May 2025, comparing them to the same period in the previous two years.

6 months to
1 May 2025
Same period 2024 Same period 2023
Rank 123 143 90
Rank change year-on-year +20 -53 +28
Contract jobs citing Unix 209 228 658
As % of all contract jobs with a WFH option 2.11% 1.49% 2.54%
As % of the Operating Systems category 17.76% 14.28% 18.57%
Number of daily rates quoted 128 152 442
10th Percentile £363 £336 £450
25th Percentile £412 £430 £500
Median daily rate (50th Percentile) £484 £535 £545
Median % change year-on-year -9.40% -1.93% +3.81%
75th Percentile £591 £623 £619
90th Percentile £729 £748 £725
UK median daily rate £500 £550 £550
% change year-on-year -9.09% - +1.38%
Number of hourly rates quoted 4 1 15
10th Percentile - - £42.50
25th Percentile £40.50 £58.50 £51.25
Median hourly rate £41.00 £63.00 £58.59
Median % change year-on-year -34.92% +7.53% -11.23%
75th Percentile £47.38 £67.50 £74.38
90th Percentile £57.95 - £75.60
UK median hourly rate £52.50 £40.00 £58.59
% change year-on-year +31.25% -31.73% -9.86%

All Operating Systems
Work from Home

Unix falls under the Operating Systems category. For comparison with the information above, the following table provides summary statistics for all contract job vacancies with remote or hybrid options requiring operating system skills.

Contract vacancies with a requirement for operating system skills 1,177 1,597 3,543
As % of all contract jobs with a WFH option 11.88% 10.41% 13.70%
Number of daily rates quoted 792 1,113 2,503
10th Percentile £288 £218 £250
25th Percentile £388 £350 £408
Median daily rate (50th Percentile) £500 £475 £520
Median % change year-on-year +5.26% -8.65% +4.00%
75th Percentile £581 £588 £625
90th Percentile £675 £680 £718
UK median daily rate £475 £469 £505
% change year-on-year +1.28% -7.13% +1.00%
Number of hourly rates quoted 34 49 101
10th Percentile £14.20 £13.15 £19.00
25th Percentile £32.19 £14.27 £40.00
Median hourly rate £62.50 £18.30 £57.50
Median % change year-on-year +241.53% -68.17% +35.29%
75th Percentile £68.00 £65.00 £70.00
90th Percentile £68.53 £73.50 £75.00
UK median hourly rate £24.18 £22.00 £39.30
% change year-on-year +9.91% -44.02% +74.67%

Unix
Trend for Jobs with a WFH Option

Job vacancies with remote working options citing Unix as a proportion of all IT jobs advertised.
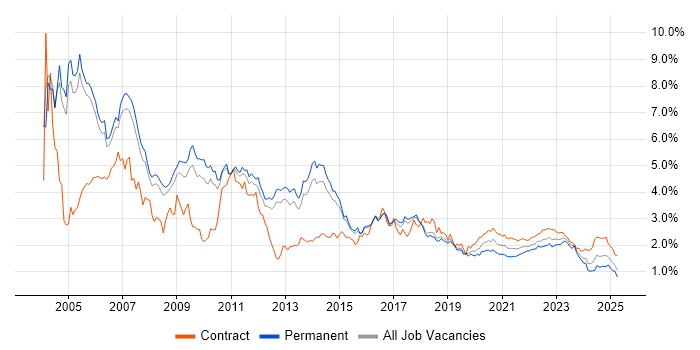
Unix trend for jobs with Hybrid/Remote/WFH options

Unix
Daily Rate Trend for Jobs with a WFH Option

3-month moving average daily rate quoted in job vacancies with remote working options citing Unix.

Unix daily rate for jobs with a WFH option

Unix
Daily Rate Histogram for Jobs with a WFH Option

Daily rate distribution for jobs with remote working options citing Unix over the 6 months to 1 May 2025.

Unix daily rate histogram for jobs with a WFH option

Unix
Hourly Rate Trend for Jobs with a WFH Option

3-month moving average hourly rate quoted in job vacancies with remote working options citing Unix.

Unix hourly rate for jobs with a WFH option

Unix
Hourly Rate Histogram for Jobs with a WFH Option

Hourly rate distribution for jobs with remote working options citing Unix over the 6 months to 1 May 2025.

Unix hourly rate histogram for jobs with a WFH option

Unix
Co-occurring Skills and Capabilities with WFH Options by Category

The follow tables expand on the table above by listing co-occurrences grouped by category. The same employment type, locality and period is covered with up to 20 co-occurrences shown in each of the following categories:

Application Platforms
1 10 (4.78%) Apache
2 9 (4.31%) Confluence
2 9 (4.31%) nginx
3 7 (3.35%) WebSphere
4 5 (2.39%) OpenStack
4 5 (2.39%) Traefik
5 4 (1.91%) CMS
5 4 (1.91%) Drupal
5 4 (1.91%) WordPress
6 3 (1.44%) Microsoft Exchange
6 3 (1.44%) Oracle Workflow
6 3 (1.44%) SAS
7 2 (0.96%) Apache Spark
7 2 (0.96%) JBoss
7 2 (0.96%) Oracle SOA Suite
7 2 (0.96%) WebSphere Application Server
8 1 (0.48%) CICS
8 1 (0.48%) SharePoint
8 1 (0.48%) Tomcat
8 1 (0.48%) WebLogic
Applications
1 11 (5.26%) Microsoft Excel
2 2 (0.96%) Microsoft Office
2 2 (0.96%) Microsoft Project
3 1 (0.48%) Microsoft PowerPoint
3 1 (0.48%) MS Visio
Business Applications
1 3 (1.44%) Oracle Assets
1 3 (1.44%) Oracle EBS
1 3 (1.44%) Oracle EBS R12
1 3 (1.44%) Oracle Payables
2 2 (0.96%) Actimize
2 2 (0.96%) Kondor
2 2 (0.96%) Oracle Applications
2 2 (0.96%) Oracle Cash Management
2 2 (0.96%) Oracle E-Business Tax
2 2 (0.96%) Oracle General Ledger
2 2 (0.96%) Oracle Internet Expenses
2 2 (0.96%) Oracle iProcurement
2 2 (0.96%) Oracle Receivables
2 2 (0.96%) Oracle Subledger Accounting
3 1 (0.48%) iTrent
3 1 (0.48%) NetSuite
3 1 (0.48%) SAP IBP
3 1 (0.48%) Summit
3 1 (0.48%) Unit4 Business World
Cloud Services
1 39 (18.66%) AWS
2 31 (14.83%) Azure
3 16 (7.66%) Entra ID
4 14 (6.70%) AWS CloudFormation
5 10 (4.78%) GCP
6 8 (3.83%) Amazon ECS
6 8 (3.83%) Virtual Private Cloud
7 7 (3.35%) Amazon CloudWatch
7 7 (3.35%) AWS Fargate
8 5 (2.39%) Cloud Computing
9 4 (1.91%) Azure DevOps
10 3 (1.44%) Amazon EKS
10 3 (1.44%) AWS Lambda
10 3 (1.44%) OpenShift
10 3 (1.44%) Power Platform
10 3 (1.44%) Serverless
11 2 (0.96%) AWS Control Tower
11 2 (0.96%) Datadog
12 1 (0.48%) Microsoft Purview
12 1 (0.48%) OneDrive
Communications & Networking
1 13 (6.22%) DNS
2 11 (5.26%) TCP/IP
3 9 (4.31%) HTTP
4 5 (2.39%) Firewall
4 5 (2.39%) HTTPS
4 5 (2.39%) SAN
4 5 (2.39%) SSL
5 4 (1.91%) Internet
5 4 (1.91%) Network Security
5 4 (1.91%) VPN
6 3 (1.44%) IMAP
6 3 (1.44%) POP3
6 3 (1.44%) SMTP
6 3 (1.44%) SSH
7 2 (0.96%) DHCP
8 1 (0.48%) Intrusion Detection
8 1 (0.48%) Kerberos
8 1 (0.48%) NAS
8 1 (0.48%) VSAN
8 1 (0.48%) Wi-Fi
Database & Business Intelligence
1 15 (7.18%) SQL Server
2 14 (6.70%) Relational Database
3 11 (5.26%) MongoDB
4 10 (4.78%) DB2
4 10 (4.78%) PostgreSQL
5 8 (3.83%) MySQL
5 8 (3.83%) Oracle Database
6 7 (3.35%) RDBMS
7 6 (2.87%) MS Access
8 5 (2.39%) Data Warehouse
9 3 (1.44%) Apache Hive
9 3 (1.44%) Impala
9 3 (1.44%) Oracle Reports
9 3 (1.44%) Power BI
10 2 (0.96%) Amazon RDS
10 2 (0.96%) Big Data
10 2 (0.96%) CockroachDB
10 2 (0.96%) HBase
10 2 (0.96%) NoSQL
10 2 (0.96%) Redis
Development Applications
1 34 (16.27%) Jenkins
2 18 (8.61%) Git
2 18 (8.61%) GitLab
3 17 (8.13%) JIRA
4 8 (3.83%) Subversion
5 7 (3.35%) Atlassian Bamboo
5 7 (3.35%) Bitbucket
5 7 (3.35%) Maven
6 6 (2.87%) JUnit
7 5 (2.39%) Ant
8 4 (1.91%) Bitbucket Server
8 4 (1.91%) QARun
8 4 (1.91%) WinRunner
9 2 (0.96%) Mockito
9 2 (0.96%) Postman
9 2 (0.96%) REST Assured
9 2 (0.96%) SoapUI
9 2 (0.96%) SonarQube
9 2 (0.96%) Toad
9 2 (0.96%) XCTest
General
1 51 (24.40%) Social Skills
2 46 (22.01%) Finance
3 30 (14.35%) Banking
4 22 (10.53%) Analytical Skills
5 11 (5.26%) Public Sector
6 9 (4.31%) Front Office
7 6 (2.87%) Inclusion and Diversity
8 5 (2.39%) French Language
8 5 (2.39%) Wholesale Banking
9 4 (1.91%) Documentation Skills
9 4 (1.91%) Investment Banking
10 3 (1.44%) Financial Institution
10 3 (1.44%) General Ledger
10 3 (1.44%) Law
10 3 (1.44%) Organisational Skills
11 2 (0.96%) Influencing Skills
12 1 (0.48%) Back Office
12 1 (0.48%) Legal
12 1 (0.48%) Presentation Skills
12 1 (0.48%) Telecoms
Job Titles
1 48 (22.97%) Analyst
2 29 (13.88%) Developer
3 25 (11.96%) Senior
4 19 (9.09%) Pensions Analyst
4 19 (9.09%) Unix Engineer
5 18 (8.61%) Linux Engineer
6 17 (8.13%) Java Developer
7 15 (7.18%) Linux Scripter
8 14 (6.70%) Infrastructure Engineer
9 13 (6.22%) DevOps Engineer
9 13 (6.22%) Technical Analyst
10 12 (5.74%) Senior DevOps
11 11 (5.26%) Software Engineer
11 11 (5.26%) Unix Linux Engineer
12 10 (4.78%) Support Engineer
13 9 (4.31%) Administrator
13 9 (4.31%) Programmer
13 9 (4.31%) Python Programmer
13 9 (4.31%) Senior DevOps Engineer
14 8 (3.83%) Platform Engineer
Libraries, Frameworks & Software Standards
1 21 (10.05%) Web Services
2 16 (7.66%) Kafka
3 15 (7.18%) Middleware
4 13 (6.22%) SOAP
5 12 (5.74%) .NET
6 11 (5.26%) cloud-init
7 9 (4.31%) J2EE
8 8 (3.83%) HTML
8 8 (3.83%) XML
9 7 (3.35%) CSS
9 7 (3.35%) Elastic Stack
9 7 (3.35%) Keycloak
9 7 (3.35%) Spring
9 7 (3.35%) Spring Boot
10 6 (2.87%) AngularJS
10 6 (2.87%) RESTful
11 5 (2.39%) jQuery
11 5 (2.39%) JSON
11 5 (2.39%) LDAP
11 5 (2.39%) REST
Miscellaneous
1 15 (7.18%) Management Information System
2 14 (6.70%) Derivative
3 12 (5.74%) Foreign Exchange (FX)
4 10 (4.78%) Algorithms
5 8 (3.83%) Onboarding
5 8 (3.83%) PKI
6 7 (3.35%) Cloud Native
6 7 (3.35%) Distributed Systems
6 7 (3.35%) Equities
6 7 (3.35%) Equity Derivative
6 7 (3.35%) Product Ownership
7 6 (2.87%) Data Protection Act
7 6 (2.87%) Virtual Team
8 5 (2.39%) Data Structures
9 4 (1.91%) Clustering
9 4 (1.91%) Legacy Code
9 4 (1.91%) Mainframe
9 4 (1.91%) Public Cloud
9 4 (1.91%) Replication
10 3 (1.44%) Data Centre
Operating Systems
1 134 (64.11%) Linux
2 55 (26.32%) Windows
3 22 (10.53%) Red Hat Enterprise Linux
4 17 (8.13%) Windows Server
5 16 (7.66%) AIX
6 12 (5.74%) CentOS
7 7 (3.35%) Solaris
8 4 (1.91%) HPUX
9 3 (1.44%) Mac OS
9 3 (1.44%) Ubuntu
10 1 (0.48%) Amazon Linux
10 1 (0.48%) Android
10 1 (0.48%) Apple iOS
10 1 (0.48%) Data ONTAP
10 1 (0.48%) Mac OS X
10 1 (0.48%) SUSE
10 1 (0.48%) VyOS
Processes & Methodologies
1 44 (21.05%) Problem-Solving
2 38 (18.18%) DevOps
3 31 (14.83%) CI/CD
4 28 (13.40%) Agile
4 28 (13.40%) OO
4 28 (13.40%) Test Automation
5 27 (12.92%) High Availability
6 26 (12.44%) Software Engineering
7 24 (11.48%) Migration
8 23 (11.00%) Infrastructure as Code
9 21 (10.05%) Storage Management
10 19 (9.09%) Concurrent Programming
11 18 (8.61%) Data Migration
12 17 (8.13%) Capacity Management
12 17 (8.13%) Design Patterns
12 17 (8.13%) SDLC
12 17 (8.13%) Technical Analysis
13 15 (7.18%) Microservices
14 14 (6.70%) Continuous Integration
14 14 (6.70%) Multithreading
Programming Languages
1 84 (40.19%) SQL
2 79 (37.80%) Python
3 32 (15.31%) Java
4 23 (11.00%) Bash
5 22 (10.53%) Shell Script
6 19 (9.09%) Perl
7 14 (6.70%) PL/SQL
8 13 (6.22%) Go
9 11 (5.26%) PowerShell
10 10 (4.78%) JavaScript
11 8 (3.83%) C
11 8 (3.83%) C#
12 6 (2.87%) ActionScript
12 6 (2.87%) ActionScript 2.0
12 6 (2.87%) Groovy
13 4 (1.91%) C++
13 4 (1.91%) PHP
14 3 (1.44%) REXX
15 2 (0.96%) COBOL
15 2 (0.96%) JCL
Qualifications
1 26 (12.44%) Security Cleared
2 24 (11.48%) SC Cleared
3 10 (4.78%) AWS Certification
4 6 (2.87%) Degree
5 3 (1.44%) AWS Certified DevOps Engineer
6 2 (0.96%) IBM Certification
6 2 (0.96%) ISTQB
7 1 (0.48%) AWS Certified Developer
7 1 (0.48%) AWS Certified Solutions Architect
7 1 (0.48%) AWS Certified SysOps Administrator
7 1 (0.48%) BPSS Clearance
7 1 (0.48%) CCDE
7 1 (0.48%) Computer Science Degree
7 1 (0.48%) DV Cleared
7 1 (0.48%) ISEB
7 1 (0.48%) ISTQB Foundation Certification
7 1 (0.48%) Master's Degree
7 1 (0.48%) VMware Certified Professional (VCP)
Quality Assurance & Compliance
1 7 (3.35%) NCSC
1 7 (3.35%) QA
2 4 (1.91%) Cyber Essentials
2 4 (1.91%) Cyber Essentials PLUS
2 4 (1.91%) Disclosure Scotland
3 3 (1.44%) NIST
3 3 (1.44%) SLA
4 2 (0.96%) GMP
4 2 (0.96%) MiFID
5 1 (0.48%) Accessibility
5 1 (0.48%) Basel III
5 1 (0.48%) Data Quality
5 1 (0.48%) EMIR
5 1 (0.48%) HL7
5 1 (0.48%) ISO 20022
5 1 (0.48%) SEPA
5 1 (0.48%) WCAG
System Software
1 20 (9.57%) Docker
2 16 (7.66%) Active Directory
3 12 (5.74%) VMware Infrastructure
4 6 (2.87%) Hyper-V
5 4 (1.91%) RACF
5 4 (1.91%) Virtual Machines
6 3 (1.44%) HDFS
6 3 (1.44%) Veritas Cluster Server
6 3 (1.44%) Virtual Servers
7 2 (0.96%) Apache ZooKeeper
7 2 (0.96%) vSphere
8 1 (0.48%) BitLocker
8 1 (0.48%) KVM
8 1 (0.48%) Tivoli Workload Scheduler
8 1 (0.48%) Virtual Desktop
8 1 (0.48%) VMware NSX
Systems Management
1 29 (13.88%) Kubernetes
2 28 (13.40%) Terraform
3 26 (12.44%) Ansible
4 13 (6.22%) Grafana
5 11 (5.26%) Packer
5 11 (5.26%) Prometheus
6 10 (4.78%) Progress Chef
6 10 (4.78%) Puppet
7 7 (3.35%) Consul
7 7 (3.35%) Istio
7 7 (3.35%) Jamf Pro
7 7 (3.35%) linkerd
7 7 (3.35%) Rancher
7 7 (3.35%) ZABBIX
8 6 (2.87%) HAProxy
9 4 (1.91%) Microsoft Intune
9 4 (1.91%) SCCM
9 4 (1.91%) Tivoli
9 4 (1.91%) Tivoli Storage Manager
10 2 (0.96%) Nagios
Vendors
1 33 (15.79%) Oracle
2 31 (14.83%) Microsoft
3 22 (10.53%) Splunk
4 19 (9.09%) IBM
5 17 (8.13%) VMware
6 16 (7.66%) CyberArk
7 9 (4.31%) Red Hat
8 8 (3.83%) Okta
9 7 (3.35%) Citrix
9 7 (3.35%) Sybase
10 6 (2.87%) Apple
10 6 (2.87%) Dynatrace
10 6 (2.87%) HP
11 5 (2.39%) AppDynamics
11 5 (2.39%) Atlassian
11 5 (2.39%) ESET
11 5 (2.39%) IBM Sterling
11 5 (2.39%) Veritas
12 4 (1.91%) BeyondTrust
12 4 (1.91%) Zend