GCP Contracts with Hybrid/Remote/WFH Options

Google Cloud Platform (GCP)
UK > Work from Home

The table below provides summary statistics for remote or hybrid contract work requiring GCP skills. It includes a benchmarking guide to the contractor rates offered in vacancies that cited GCP over the 6 months leading up to 1 May 2025, comparing them to the same period in the previous two years.

6 months to
1 May 2025
Same period 2024 Same period 2023
Rank 42 67 63
Rank change year-on-year +25 -4 -6
Contract jobs citing GCP 474 453 955
As % of all contract jobs with a WFH option 4.79% 2.95% 3.69%
As % of the Cloud Services category 12.03% 8.15% 9.33%
Number of daily rates quoted 362 337 731
10th Percentile £350 £423 £438
25th Percentile £480 £500 £513
Median daily rate (50th Percentile) £600 £600 £625
Median % change year-on-year - -4.00% -
75th Percentile £737 £763 £738
90th Percentile £838 £838 £800
UK median daily rate £575 £600 £625
% change year-on-year -4.17% -4.00% +1.63%
Number of hourly rates quoted 5 5 7
10th Percentile £22.85 £39.70 £62.00
25th Percentile £25.25 £46.75 £63.25
Median hourly rate £25.50 £55.00 £80.00
Median % change year-on-year -53.64% -31.25% +82.86%
75th Percentile £25.75 £58.75 £86.25
90th Percentile £53.80 £68.50 £95.00
UK median hourly rate £52.50 £51.75 £70.18
% change year-on-year +1.45% -26.26% +47.74%

All Cloud Skills
Work from Home

GCP falls under the Cloud Services category. For comparison with the information above, the following table provides summary statistics for all contract job vacancies with remote or hybrid options requiring cloud computing skills.

Contract vacancies with a requirement for cloud computing skills 3,940 5,557 10,236
As % of all contract jobs with a WFH option 39.78% 36.21% 39.59%
Number of daily rates quoted 2,887 3,982 7,514
10th Percentile £351 £350 £373
25th Percentile £425 £430 £450
Median daily rate (50th Percentile) £523 £525 £550
Median % change year-on-year -0.38% -4.55% -
75th Percentile £630 £638 £650
90th Percentile £750 £738 £743
UK median daily rate £520 £525 £550
% change year-on-year -0.95% -4.55% -
Number of hourly rates quoted 42 89 125
10th Percentile £16.00 £15.50 £16.43
25th Percentile £25.25 £17.00 £21.31
Median hourly rate £35.00 £26.00 £55.00
Median % change year-on-year +34.62% -52.73% +83.33%
75th Percentile £70.63 £50.25 £70.00
90th Percentile £92.50 £64.37 £78.40
UK median hourly rate £27.35 £21.00 £35.00
% change year-on-year +30.24% -40.00% +62.79%

GCP
Trend for Jobs with a WFH Option

Job vacancies with remote working options citing GCP as a proportion of all IT jobs advertised.
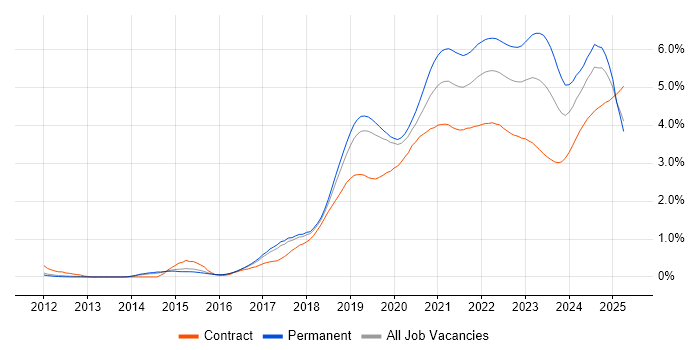
GCP trend for jobs with Hybrid/Remote/WFH options

GCP
Daily Rate Trend for Jobs with a WFH Option

3-month moving average daily rate quoted in job vacancies with remote working options citing GCP.

GCP daily rate for jobs with a WFH option

GCP
Daily Rate Histogram for Jobs with a WFH Option

Daily rate distribution for jobs with remote working options citing GCP over the 6 months to 1 May 2025.

GCP daily rate histogram for jobs with a WFH option

GCP
Hourly Rate Trend for Jobs with a WFH Option

3-month moving average hourly rate quoted in job vacancies with remote working options citing GCP.

GCP hourly rate for jobs with a WFH option

GCP
Hourly Rate Histogram for Jobs with a WFH Option

Hourly rate distribution for jobs with remote working options citing GCP over the 6 months to 1 May 2025.

GCP hourly rate histogram for jobs with a WFH option

GCP
Co-occurring Skills and Capabilities with WFH Options by Category

The follow tables expand on the table above by listing co-occurrences grouped by category. The same employment type, locality and period is covered with up to 20 co-occurrences shown in each of the following categories:

Application Platforms
1 65 (13.71%) Apache Airflow
2 45 (9.49%) Apache
3 14 (2.95%) Apache Spark
4 8 (1.69%) Confluence
5 2 (0.42%) CMS
5 2 (0.42%) Headless CMS
5 2 (0.42%) Jupyter
5 2 (0.42%) SAS
5 2 (0.42%) Tomcat
6 1 (0.21%) Adobe Experience Manager
6 1 (0.21%) Anypoint
6 1 (0.21%) Luigi
6 1 (0.21%) Microsoft Exchange
6 1 (0.21%) Mule
6 1 (0.21%) NetWeaver
6 1 (0.21%) nginx
6 1 (0.21%) SharePoint
Applications
1 8 (1.69%) Microsoft PowerPoint
1 8 (1.69%) MS Visio
2 2 (0.42%) Trello
3 1 (0.21%) Microsoft Excel
3 1 (0.21%) Microsoft Office
3 1 (0.21%) Notion
Business Applications
1 3 (0.63%) SAP S/4HANA
1 3 (0.63%) Unica
2 1 (0.21%) Adobe Campaign
2 1 (0.21%) Kondor
2 1 (0.21%) Magento
2 1 (0.21%) NetSuite
2 1 (0.21%) Oracle EBS
2 1 (0.21%) Oracle EBS R12
2 1 (0.21%) SAP IBP
2 1 (0.21%) Shopify
Cloud Services
1 365 (77.00%) AWS
2 289 (60.97%) Azure
3 60 (12.66%) dbt
4 40 (8.44%) Snowflake
5 33 (6.96%) AWS CloudFormation
6 32 (6.75%) PaaS
6 32 (6.75%) SaaS
7 29 (6.12%) IaaS
8 27 (5.70%) Dagster
8 27 (5.70%) Power Platform
9 24 (5.06%) GitHub
10 21 (4.43%) Amazon EKS
11 20 (4.22%) Amazon EC2
12 19 (4.01%) Amazon ECS
13 17 (3.59%) Cloud Computing
13 17 (3.59%) GitHub Actions
14 12 (2.53%) Entra ID
15 11 (2.32%) Serverless
16 9 (1.90%) Azure DevOps
17 8 (1.69%) Azure Sentinel
Communications & Networking
1 31 (6.54%) DNS
2 30 (6.33%) Firewall
3 29 (6.12%) TCP/IP
4 26 (5.49%) HTTP
5 22 (4.64%) DHCP
5 22 (4.64%) HTTPS
6 20 (4.22%) BGP
7 19 (4.01%) OSPF
8 13 (2.74%) Network Security
9 8 (1.69%) VPN
10 6 (1.27%) SSL
11 2 (0.42%) DOCSIS
11 2 (0.42%) Kerberos
11 2 (0.42%) NGFW
11 2 (0.42%) VLAN
11 2 (0.42%) Wi-Fi
12 1 (0.21%) NAS
12 1 (0.21%) NetScaler
12 1 (0.21%) Wireless
12 1 (0.21%) Wireshark
Database & Business Intelligence
1 67 (14.14%) PostgreSQL
2 54 (11.39%) Amazon Athena
3 53 (11.18%) Apache Iceberg
3 53 (11.18%) Dremio
4 45 (9.49%) Data Lake
5 44 (9.28%) Apache Arrow
6 43 (9.07%) BigQuery
7 41 (8.65%) Data Warehouse
8 28 (5.91%) Apache Ignite
9 23 (4.85%) Looker
10 22 (4.64%) Power BI
11 21 (4.43%) Big Data
12 18 (3.80%) MongoDB
12 18 (3.80%) Relational Database
12 18 (3.80%) Tableau
13 17 (3.59%) MySQL
14 16 (3.38%) Hadoop
15 13 (2.74%) SQL Server
16 12 (2.53%) Metadata
17 11 (2.32%) NoSQL
Development Applications
1 37 (7.81%) Jenkins
2 34 (7.17%) GitLab
3 24 (5.06%) Git
4 15 (3.16%) JIRA
5 10 (2.11%) MLflow
6 5 (1.05%) CircleCI
6 5 (1.05%) Postman
7 4 (0.84%) Cypress.io
7 4 (0.84%) JUnit
7 4 (0.84%) Mockito
8 3 (0.63%) Eclipse
8 3 (0.63%) Gatling
8 3 (0.63%) Gradle
8 3 (0.63%) IntelliJ
8 3 (0.63%) JMeter
8 3 (0.63%) Maven
8 3 (0.63%) REST Assured
8 3 (0.63%) TestNG
9 2 (0.42%) SonarQube
9 2 (0.42%) webpack
General
1 150 (31.65%) Finance
2 105 (22.15%) Front Office
3 97 (20.46%) Social Skills
4 73 (15.40%) Banking
5 48 (10.13%) Analytical Skills
6 38 (8.02%) Public Sector
7 21 (4.43%) Investment Banking
8 12 (2.53%) Marketing
9 11 (2.32%) Presentation Skills
10 9 (1.90%) Telecoms
11 7 (1.48%) Legal
12 6 (1.27%) Inclusion and Diversity
13 4 (0.84%) Advertising
13 4 (0.84%) Manufacturing
13 4 (0.84%) Retail
14 3 (0.63%) Financial Institution
14 3 (0.63%) Health Technology
15 2 (0.42%) Digital Health
15 2 (0.42%) Documentation Skills
16 1 (0.21%) Organisational Skills
Job Titles
1 136 (28.69%) Developer
2 112 (23.63%) Software Engineer
3 105 (22.15%) Architect
4 78 (16.46%) Developer/Software Engineer
5 51 (10.76%) AWS Engineer
6 44 (9.28%) AWS Software Engineer
7 43 (9.07%) Python Developer
8 42 (8.86%) Senior
9 39 (8.23%) Data Engineer
9 39 (8.23%) Python Engineer
10 38 (8.02%) React Developer
11 34 (7.17%) Solutions Architect
11 34 (7.17%) Technical Architect
12 32 (6.75%) Cloud Architect
13 28 (5.91%) Full-Stack Developer
14 27 (5.70%) AWS Developer
14 27 (5.70%) Python Software Engineer
15 25 (5.27%) Analyst
15 25 (5.27%) Java Engineer
16 24 (5.06%) DevOps Engineer
Libraries, Frameworks & Software Standards
1 96 (20.25%) React
2 71 (14.98%) Node.js
3 64 (13.50%) Redux
4 58 (12.24%) Pandas
5 57 (12.03%) NumPy
6 56 (11.81%) AngularJS
7 53 (11.18%) SciPy
8 46 (9.70%) Vue
9 31 (6.54%) PySpark
10 29 (6.12%) Protocol Buffers
11 28 (5.91%) gRPC
12 25 (5.27%) RESTful
13 19 (4.01%) .NET
14 17 (3.59%) Kafka
14 17 (3.59%) REST
15 16 (3.38%) Elastic Stack
15 16 (3.38%) HTML
16 14 (2.95%) CSS
16 14 (2.95%) Middleware
17 13 (2.74%) OAuth
Miscellaneous
1 97 (20.46%) Fixed Income
2 45 (9.49%) Cloud Native
3 44 (9.28%) Equities
4 42 (8.86%) Foreign Exchange (FX)
5 33 (6.96%) Hedge funds
6 19 (4.01%) Derivative
7 13 (2.74%) Management Information System
8 10 (2.11%) Product Ownership
9 9 (1.90%) Hybrid Cloud
10 8 (1.69%) Enterprise Software
11 7 (1.48%) Algorithms
11 7 (1.48%) Legacy Systems
11 7 (1.48%) Security Posture
12 6 (1.27%) Data Structures
12 6 (1.27%) Distributed Systems
12 6 (1.27%) Greenfield Project
12 6 (1.27%) NHS
13 5 (1.05%) Data Centre
13 5 (1.05%) Renewable Energy
13 5 (1.05%) Self-Motivation
Operating Systems
1 27 (5.70%) Linux
2 12 (2.53%) Windows
3 10 (2.11%) Unix
4 5 (1.05%) Windows Server
5 3 (0.63%) Red Hat Enterprise Linux
5 3 (0.63%) VMS
6 2 (0.42%) AIX
6 2 (0.42%) Solaris
7 1 (0.21%) Android
7 1 (0.21%) Oracle Linux
Processes & Methodologies
1 170 (35.86%) Agile
2 156 (32.91%) Software Engineering
3 119 (25.11%) CI/CD
4 107 (22.57%) DevOps
5 101 (21.31%) Asset Management
6 91 (19.20%) Fintech
7 87 (18.35%) Investment Management
8 82 (17.30%) Analytics
9 81 (17.09%) Problem-Solving
10 70 (14.77%) Containerisation
11 67 (14.14%) Infrastructure as Code
12 61 (12.87%) Migration
13 55 (11.60%) Microservices
14 52 (10.97%) User Experience
15 49 (10.34%) Test Automation
16 44 (9.28%) Artificial Intelligence
17 43 (9.07%) Machine Learning
18 42 (8.86%) Data Pipeline
19 40 (8.44%) Cloud Security
20 38 (8.02%) Data Engineering
Programming Languages
1 245 (51.69%) Python
2 140 (29.54%) JavaScript
3 103 (21.73%) TypeScript
4 89 (18.78%) Java
5 72 (15.19%) SQL
6 31 (6.54%) Bash
7 28 (5.91%) PowerShell
8 22 (4.64%) Bicep
9 17 (3.59%) C#
10 9 (1.90%) Shell Script
11 8 (1.69%) Go
12 6 (1.27%) R
13 4 (0.84%) C
13 4 (0.84%) Kotlin
13 4 (0.84%) Ruby
13 4 (0.84%) Scala
14 3 (0.63%) ActionScript
14 3 (0.63%) ActionScript 2.0
14 3 (0.63%) C++
14 3 (0.63%) DAML
Qualifications
1 44 (9.28%) Security Cleared
2 41 (8.65%) SC Cleared
3 30 (6.33%) AWS Certification
4 29 (6.12%) Azure Certification
4 29 (6.12%) Degree
5 26 (5.49%) Computer Science Degree
6 17 (3.59%) CISSP
7 15 (3.16%) Microsoft Certification
8 13 (2.74%) AWS Certified Solutions Architect
9 11 (2.32%) Master's Degree
10 9 (1.90%) TOGAF Certification
11 8 (1.69%) Cisco Certification
11 8 (1.69%) CISM
12 7 (1.48%) GIAC
13 6 (1.27%) (ISC)2 CCSP
13 6 (1.27%) SANS
14 5 (1.05%) CEH
15 3 (0.63%) CITP
15 3 (0.63%) OSCP
16 2 (0.42%) DV Cleared
Quality Assurance & Compliance
1 26 (5.49%) QA
2 23 (4.85%) GDPR
3 19 (4.01%) Data Quality
4 18 (3.80%) NIST
5 10 (2.11%) ISO/IEC 27001
5 10 (2.11%) PCI DSS
6 8 (1.69%) Accessibility
6 8 (1.69%) HIPAA
7 4 (0.84%) California Consumer Privacy Act
7 4 (0.84%) SOC 2
8 2 (0.42%) Actionable Recommendations
8 2 (0.42%) Basel III
8 2 (0.42%) GRC
8 2 (0.42%) Sarbanes-Oxley
8 2 (0.42%) WCAG
9 1 (0.21%) IFRS
9 1 (0.21%) IFRS 9
9 1 (0.21%) MiFID
9 1 (0.21%) NIST 800
9 1 (0.21%) Software Quality Assurance
System Software
1 77 (16.24%) Docker
2 15 (3.16%) Active Directory
3 10 (2.11%) Virtual Machines
4 5 (1.05%) VMware Infrastructure
5 2 (0.42%) Hyper-V
6 1 (0.21%) HDFS
6 1 (0.21%) VMware ESXi
6 1 (0.21%) VMware NSX
Systems Management
1 82 (17.30%) Kubernetes
2 73 (15.40%) Terraform
3 30 (6.33%) Ansible
4 23 (4.85%) Grafana
5 19 (4.01%) Prometheus
6 8 (1.69%) Puppet
7 6 (1.27%) Single Sign-On
8 5 (1.05%) Progress Chef
9 4 (0.84%) Argo
9 4 (0.84%) Kubeflow
10 2 (0.42%) Active Directory Federation Services
10 2 (0.42%) Kibana
10 2 (0.42%) logstash
10 2 (0.42%) Nagios
10 2 (0.42%) QRadar
11 1 (0.21%) CA Wily
11 1 (0.21%) Nessus
11 1 (0.21%) Netcool
11 1 (0.21%) Tivoli
11 1 (0.21%) Tivoli Storage Manager
Vendors
1 136 (28.69%) Google
2 52 (10.97%) Microsoft
3 25 (5.27%) Databricks
3 25 (5.27%) Palo Alto
4 22 (4.64%) Cisco
5 18 (3.80%) CheckPoint
5 18 (3.80%) Fortinet
6 15 (3.16%) Oracle
7 14 (2.95%) Splunk
8 12 (2.53%) IBM
9 8 (1.69%) VMware
10 7 (1.48%) CyberArk
11 6 (1.27%) SAP
11 6 (1.27%) ServiceNow
12 5 (1.05%) Cloudera
13 3 (0.63%) Adobe
13 3 (0.63%) IBM Sterling
13 3 (0.63%) Informatica
13 3 (0.63%) Red Hat
13 3 (0.63%) Salesforce