Release Management Contracts with Work from Home Options

Release Management
UK > Work from Home

The table below provides summary statistics for contract job vacancies with an option to work from home (WFH) and a requirement for Release Management skills. Included is a benchmarking guide to the contractor rates offered in vacancies that have cited Release Management over the 6 months to 29 April 2024 with a comparison to the same period in the previous 2 years.

6 months to
29 Apr 2024
Same period 2023 Same period 2022
Rank 234 267 348
Rank change year-on-year +33 +81 -135
Contract jobs citing Release Management 119 215 305
As % of all contract jobs with a WFH option 0.77% 0.83% 0.68%
As % of the Processes & Methodologies category 0.88% 0.93% 0.75%
Number of daily rates quoted 88 154 199
10th Percentile £425 £315 £363
25th Percentile £475 £453 £456
Median daily rate (50th Percentile) £575 £558 £525
Median % change year-on-year +3.14% +6.19% -
75th Percentile £627 £684 £625
90th Percentile £650 £750 £738
UK median daily rate £563 £563 £540
% change year-on-year - +4.17% +2.86%
Number of hourly rates quoted 0 1 4
10th Percentile - - £26.88
25th Percentile - £52.50 £29.69
Median hourly rate - £55.00 £33.75
Median % change year-on-year - +62.96% +110.94%
75th Percentile - £57.50 £39.31
90th Percentile - - £47.08
UK median hourly rate £38.00 £59.69 £28.75
% change year-on-year -36.34% +107.61% +41.66%

All Process and Methodology Skills
Work from Home

Release Management is in the Processes and Methodologies category. The following table is for comparison with the above and provides summary statistics for all contract job vacancies with a WFH option and a requirement for process or methodology skills.

Contract vacancies with a requirement for process or methodology skills 13,505 23,232 40,651
As % of all contract jobs with a WFH option 87.83% 89.84% 91.14%
Number of daily rates quoted 9,015 16,421 29,503
10th Percentile £325 £363 £360
25th Percentile £425 £450 £431
Median daily rate (50th Percentile) £525 £540 £525
Median % change year-on-year -2.78% +2.86% +9.03%
75th Percentile £638 £650 £625
90th Percentile £750 £750 £719
UK median daily rate £525 £550 £525
% change year-on-year -4.55% +4.76% +7.69%
Number of hourly rates quoted 573 532 547
10th Percentile £15.17 £19.00 £13.50
25th Percentile £24.25 £30.54 £19.96
Median hourly rate £42.50 £55.00 £35.00
Median % change year-on-year -22.73% +57.14% +34.62%
75th Percentile £60.00 £68.75 £55.00
90th Percentile £75.25 £80.23 £67.50
UK median hourly rate £35.50 £37.30 £25.00
% change year-on-year -4.83% +49.20% -

Release Management
Trend for Jobs with a WFH Option

Job vacancies with a work from home option citing Release Management as a proportion of all IT jobs advertised.
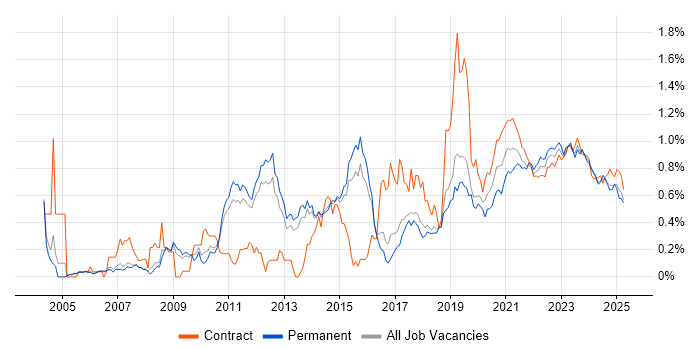
Release Management trend for jobs with a WFH option

Release Management
Daily Rate Trend for Jobs with a WFH Option

3-month moving average daily rate quoted in job vacancies with a work from home option citing Release Management.

Release Management daily rate for jobs with a WFH option

Release Management
Daily Rate Histogram for Jobs with a WFH Option

Daily rate distribution for jobs with a work from home option citing Release Management over the 6 months to 29 April 2024.

Release Management daily rate histogram for jobs with a WFH option

Release Management
Hourly Rate Trend for Jobs with a WFH Option

3-month moving average hourly rate quoted in job vacancies with a work from home option citing Release Management.

Release Management hourly rate for jobs with a WFH option

Release Management
Co-occurring Skills and Capabilities with WFH Options by Category

The follow tables expand on the table above by listing co-occurrences grouped by category. The same employment type, locality and period is covered with up to 20 co-occurrences shown in each of the following categories:

Application Platforms
1 20 (16.81%) Microsoft Exchange
2 6 (5.04%) Confluence
3 2 (1.68%) IIS
4 1 (0.84%) Exchange Server 2007
4 1 (0.84%) Exchange Server 2010
4 1 (0.84%) SharePoint
Applications
1 3 (2.52%) MS Visio
2 1 (0.84%) Chatbot
2 1 (0.84%) Microsoft Excel
2 1 (0.84%) Microsoft Office
2 1 (0.84%) Microsoft PowerPoint
Business Applications
1 9 (7.56%) Oracle 11i
1 9 (7.56%) Oracle EBS
1 9 (7.56%) Oracle EBS R12
2 6 (5.04%) Endur
3 4 (3.36%) Oracle Cash Management
3 4 (3.36%) Oracle Payables
3 4 (3.36%) Oracle Receivables
4 2 (1.68%) Salesforce CRM
5 1 (0.84%) Remedy ITSM
5 1 (0.84%) SAP CAR
Cloud Services
1 51 (42.86%) Azure
2 25 (21.01%) AWS
3 20 (16.81%) Azure DevOps
4 18 (15.13%) Microsoft 365
5 17 (14.29%) Azure Monitor
5 17 (14.29%) Entra ID
6 16 (13.45%) Azure Storage
7 13 (10.92%) GitHub
8 11 (9.24%) GitHub Actions
9 10 (8.40%) IaaS
9 10 (8.40%) PaaS
9 10 (8.40%) SaaS
10 5 (4.20%) Power Platform
10 5 (4.20%) Slack
11 4 (3.36%) Cloud Computing
11 4 (3.36%) Dynamics 365
11 4 (3.36%) OCI
12 3 (2.52%) Serverless
13 2 (1.68%) Azure Data Factory
13 2 (1.68%) Salesforce Sales Cloud
Communications & Networking
1 22 (18.49%) DNS
2 21 (17.65%) DHCP
3 17 (14.29%) Firewall
4 2 (1.68%) TCP/IP
5 1 (0.84%) NetScaler
Database & Business Intelligence
1 6 (5.04%) SQL Server
2 5 (4.20%) Power BI
3 3 (2.52%) Crystal Reports
3 3 (2.52%) Data Lake
3 3 (2.52%) MySQL
3 3 (2.52%) PostgreSQL
4 2 (1.68%) NoSQL
5 1 (0.84%) Apache Cassandra
5 1 (0.84%) Big Data
5 1 (0.84%) BigQuery
5 1 (0.84%) Looker
5 1 (0.84%) Oracle BI EE
5 1 (0.84%) Oracle ODI
5 1 (0.84%) Oracle Reports
5 1 (0.84%) Redis
5 1 (0.84%) Relational Database
Development Applications
1 10 (8.40%) SonarQube
2 8 (6.72%) JIRA
3 6 (5.04%) Jenkins
4 4 (3.36%) Git
5 3 (2.52%) Team Foundation Server
6 1 (0.84%) Axure RP
6 1 (0.84%) Bitbucket
6 1 (0.84%) Gatling
6 1 (0.84%) Mockito
6 1 (0.84%) ScalaTest
6 1 (0.84%) Visual Studio Code
General
1 35 (29.41%) Social Skills
2 19 (15.97%) Finance
3 11 (9.24%) Analytical Skills
4 9 (7.56%) Front Office
5 6 (5.04%) Banking
6 4 (3.36%) Presentation Skills
6 4 (3.36%) Telecoms
7 3 (2.52%) Influencing Skills
7 3 (2.52%) Investment Banking
7 3 (2.52%) Public Sector
7 3 (2.52%) Retail Banking
8 2 (1.68%) Marketing
9 1 (0.84%) Back Office
9 1 (0.84%) French Language
9 1 (0.84%) German Language
9 1 (0.84%) Italian Language
9 1 (0.84%) Manufacturing
9 1 (0.84%) Organisational Skills
9 1 (0.84%) Retail
9 1 (0.84%) Spanish Language
Job Titles
1 15 (12.61%) Active Directory Support
1 15 (12.61%) Azure Specialist
2 14 (11.76%) Active Directory Specialist
2 14 (11.76%) Support Specialist
3 13 (10.92%) Release Manager
4 11 (9.24%) Developer
5 7 (5.88%) Unix Support
6 6 (5.04%) Analyst
6 6 (5.04%) Business Analyst
6 6 (5.04%) Data Business Analyst
6 6 (5.04%) Project Manager
7 5 (4.20%) Applications Support
7 5 (4.20%) Delivery Manager
7 5 (4.20%) DevOps Engineer
7 5 (4.20%) HR Manager
7 5 (4.20%) Systems Manager
8 4 (3.36%) Finance Manager
8 4 (3.36%) Lead
8 4 (3.36%) Oracle HRMS Support
8 4 (3.36%) Support Manager
Libraries, Frameworks & Software Standards
1 27 (22.69%) ARM Templates
2 10 (8.40%) Azure Blueprints
3 7 (5.88%) .NET
4 5 (4.20%) Web Services
4 5 (4.20%) XML
5 4 (3.36%) Middleware
5 4 (3.36%) XSLT
6 3 (2.52%) Blazor
6 3 (2.52%) RabbitMQ
6 3 (2.52%) RESTful
7 2 (1.68%) CSS
7 2 (1.68%) Lightning Web Components
8 1 (0.84%) Akka
8 1 (0.84%) Express.js
8 1 (0.84%) HTML5
8 1 (0.84%) Node.js
8 1 (0.84%) Play Framework
8 1 (0.84%) REST
8 1 (0.84%) SOAP
8 1 (0.84%) WebCenter
Miscellaneous
1 19 (15.97%) PKI
2 17 (14.29%) Self-Motivation
3 13 (10.92%) Management Information System
4 10 (8.40%) Onboarding
5 9 (7.56%) Mobile App
5 9 (7.56%) Product Ownership
6 4 (3.36%) Legacy Systems
7 2 (1.68%) Clustering
8 1 (0.84%) Cloud Native
8 1 (0.84%) Data Protection Act
8 1 (0.84%) Data Structures
8 1 (0.84%) Distributed Systems
8 1 (0.84%) Enterprise Software
8 1 (0.84%) Greenfield Project
8 1 (0.84%) Hedge funds
8 1 (0.84%) Virtual Team
Operating Systems
1 35 (29.41%) Windows
2 21 (17.65%) Linux
3 16 (13.45%) Windows Server
3 16 (13.45%) Windows Server 2016
3 16 (13.45%) Windows Server 2019
4 11 (9.24%) Unix
5 2 (1.68%) Ubuntu
6 1 (0.84%) CentOS
6 1 (0.84%) VMS
Processes & Methodologies
1 45 (37.82%) Agile
2 44 (36.97%) DevOps
3 32 (26.89%) Analytics
4 25 (21.01%) ITIL
5 20 (16.81%) CI/CD
6 19 (15.97%) Change Management
6 19 (15.97%) Service Management
7 18 (15.13%) Infrastructure as Code
7 18 (15.13%) RBAC
8 17 (14.29%) Identity Management
8 17 (14.29%) Log Analytics
8 17 (14.29%) Project Management
9 16 (13.45%) Multi-Factor Authentication
9 16 (13.45%) Privileged Identity Management
9 16 (13.45%) Test Automation
10 15 (12.61%) Software Engineering
11 14 (11.76%) Deployment Automation
11 14 (11.76%) Stakeholder Management
12 12 (10.08%) Containerisation
12 12 (10.08%) SDLC
Programming Languages
1 32 (26.89%) PowerShell
2 24 (20.17%) C#
3 22 (18.49%) SQL
4 16 (13.45%) Bicep
4 16 (13.45%) VB
4 16 (13.45%) VBScript
5 10 (8.40%) Python
6 6 (5.04%) VB.NET
7 4 (3.36%) PL/SQL
7 4 (3.36%) T-SQL
7 4 (3.36%) XPath
8 3 (2.52%) Bash
8 3 (2.52%) Java
8 3 (2.52%) JavaScript
8 3 (2.52%) Scala
9 2 (1.68%) Apex Code
9 2 (1.68%) C++
9 2 (1.68%) Kotlin
10 1 (0.84%) SOQL
10 1 (0.84%) TypeScript
Qualifications
1 35 (29.41%) Security Cleared
2 33 (27.73%) SC Cleared
3 25 (21.01%) Degree
4 19 (15.97%) DV Cleared
5 16 (13.45%) ITIL Foundation Certificate
6 10 (8.40%) BPSS Clearance
7 4 (3.36%) Azure Certification
8 3 (2.52%) ITIL Certification
8 3 (2.52%) Microsoft Certification
9 1 (0.84%) Computer Science Degree
9 1 (0.84%) MCSA
9 1 (0.84%) MCSE
Quality Assurance & Compliance
1 10 (8.40%) NCSC
2 9 (7.56%) QA
3 2 (1.68%) ISO 9001
3 2 (1.68%) ISO/IEC 20000
3 2 (1.68%) SLA
4 1 (0.84%) MiFID
System Software
1 24 (20.17%) Active Directory
2 19 (15.97%) Virtual Machines
3 18 (15.13%) Virtual Desktop
4 13 (10.92%) Docker
5 2 (1.68%) Hyper-V
5 2 (1.68%) VMware Infrastructure
5 2 (1.68%) vSphere
6 1 (0.84%) XenApp
6 1 (0.84%) XenDesktop
Systems Management
1 34 (28.57%) Kubernetes
2 20 (16.81%) WSUS
3 18 (15.13%) SCCM
4 16 (13.45%) Active Directory Federation Services
4 16 (13.45%) Microsoft Intune
4 16 (13.45%) SCOM
5 14 (11.76%) Terraform
6 11 (9.24%) Ansible
7 1 (0.84%) Grafana
7 1 (0.84%) Prometheus
Vendors
1 33 (27.73%) Microsoft
2 18 (15.13%) Oracle
3 5 (4.20%) Databricks
4 4 (3.36%) VMware
4 4 (3.36%) Workday
5 3 (2.52%) Atlassian
5 3 (2.52%) OpenLink
5 3 (2.52%) Salesforce
6 2 (1.68%) Pardot
6 2 (1.68%) ServiceNow
6 2 (1.68%) SolarWinds
7 1 (0.84%) Blue Prism
7 1 (0.84%) Cisco
7 1 (0.84%) Citrix
7 1 (0.84%) Google
7 1 (0.84%) IronPort
7 1 (0.84%) Qualys
7 1 (0.84%) Remedy
7 1 (0.84%) SAP
7 1 (0.84%) UiPath