Management Information System Contracts with Hybrid/Remote/WFH Options

Management Information Systems
UK > Work from Home

The table below looks at the prevalence of the term Management Information System in remote or hybrid contract work. Included is a benchmarking guide to the contractor rates offered in vacancies that cited Management Information System over the 6 months leading up to 1 May 2025, comparing them to the same period in the previous two years.

6 months to
1 May 2025
Same period 2024 Same period 2023
Rank 112 96 121
Rank change year-on-year -16 +25 +11
Contract jobs citing Management Information System 231 346 514
As % of all contract jobs with a WFH option 2.33% 2.25% 1.99%
As % of the Miscellaneous category 7.06% 7.85% 6.32%
Number of daily rates quoted 119 215 345
10th Percentile £208 £265 £275
25th Percentile £311 £413 £425
Median daily rate (50th Percentile) £525 £500 £540
Median % change year-on-year +5.00% -7.41% -
75th Percentile £603 £607 £625
90th Percentile £701 £742 £750
UK median daily rate £525 £520 £525
% change year-on-year +0.96% -0.95% -
Number of hourly rates quoted 15 25 7
10th Percentile £22.59 £16.64 £29.35
25th Percentile £26.88 £22.87 £35.00
Median hourly rate £53.50 £30.12 £53.35
Median % change year-on-year +77.62% -43.54% +97.74%
75th Percentile £65.25 £57.50 £66.00
90th Percentile £87.05 £60.00 -
UK median hourly rate £50.00 £22.50 £10.63
% change year-on-year +122.22% +111.67% -53.78%

All Generic Skills
Work from Home

Management Information System falls under the General and Transferable Skills category. For comparison with the information above, the following table provides summary statistics for all contract job vacancies with remote or hybrid options requiring generic IT skills.

Contract vacancies with a requirement for generic IT skills 3,272 4,408 8,138
As % of all contract jobs with a WFH option 33.03% 28.73% 31.47%
Number of daily rates quoted 2,222 2,974 5,725
10th Percentile £350 £325 £363
25th Percentile £425 £431 £454
Median daily rate (50th Percentile) £545 £550 £550
Median % change year-on-year -0.91% - +2.33%
75th Percentile £680 £675 £688
90th Percentile £825 £800 £800
UK median daily rate £525 £538 £550
% change year-on-year -2.33% -2.27% -
Number of hourly rates quoted 76 199 151
10th Percentile £18.75 £15.48 £19.00
25th Percentile £26.25 £25.50 £31.38
Median hourly rate £41.75 £51.00 £57.50
Median % change year-on-year -18.14% -11.30% +29.21%
75th Percentile £64.57 £65.02 £70.00
90th Percentile £78.13 £72.50 £85.00
UK median hourly rate £32.05 £30.00 £22.49
% change year-on-year +6.83% +33.42% -18.24%

Management Information System
Trend for Jobs with a WFH Option

Job vacancies with remote working options citing Management Information System as a proportion of all IT jobs advertised.
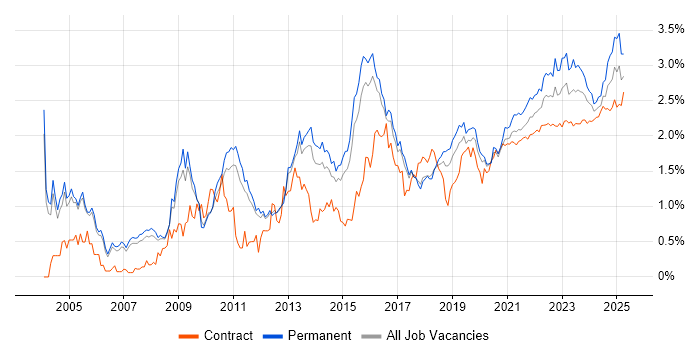
Management Information System trend for jobs with Hybrid/Remote/WFH options

Management Information System
Daily Rate Trend for Jobs with a WFH Option

3-month moving average daily rate quoted in job vacancies with remote working options citing Management Information System.

Management Information System daily rate for jobs with a WFH option

Management Information System
Daily Rate Histogram for Jobs with a WFH Option

Daily rate distribution for jobs with remote working options citing Management Information System over the 6 months to 1 May 2025.

Management Information System daily rate histogram for jobs with a WFH option

Management Information System
Hourly Rate Trend for Jobs with a WFH Option

3-month moving average hourly rate quoted in job vacancies with remote working options citing Management Information System.

Management Information System hourly rate for jobs with a WFH option

Management Information System
Hourly Rate Histogram for Jobs with a WFH Option

Hourly rate distribution for jobs with remote working options citing Management Information System over the 6 months to 1 May 2025.

Management Information System hourly rate histogram for jobs with a WFH option

Management Information System
Co-occurring Skills and Capabilities with WFH Options by Category

The follow tables expand on the table above by listing co-occurrences grouped by category. The same employment type, locality and period is covered with up to 20 co-occurrences shown in each of the following categories:

Application Platforms
1 16 (6.93%) SharePoint
2 8 (3.46%) CMS
3 4 (1.73%) WebSphere
4 3 (1.30%) Microsoft Exchange
5 2 (0.87%) Confluence
5 2 (0.87%) EPiServer
5 2 (0.87%) Umbraco
5 2 (0.87%) WordPress
6 1 (0.43%) Headless CMS
6 1 (0.43%) IIS
6 1 (0.43%) SAS
6 1 (0.43%) ThingWorx
Applications
1 20 (8.66%) Microsoft Excel
2 18 (7.79%) Microsoft PowerPoint
3 16 (6.93%) MS Visio
4 12 (5.19%) Microsoft Office
5 3 (1.30%) Microsoft Project
6 2 (0.87%) Oracle Smart View
6 2 (0.87%) Revit
7 1 (0.43%) Adobe Creative Suite
7 1 (0.43%) Adobe XD
7 1 (0.43%) AutoCAD
7 1 (0.43%) Photoshop
Business Applications
1 8 (3.46%) iTrent
2 6 (2.60%) SAP S/4HANA
3 3 (1.30%) SAP Oil and Gas
4 2 (0.87%) SAP SCM
5 1 (0.43%) Actimize
5 1 (0.43%) Maximo
5 1 (0.43%) PeopleSoft Financials
5 1 (0.43%) Primavera
5 1 (0.43%) SAP CRM
5 1 (0.43%) SAP EWM
5 1 (0.43%) SAP MM
5 1 (0.43%) SimCorp Dimension
Cloud Services
1 24 (10.39%) Azure
2 19 (8.23%) AWS
3 15 (6.49%) Microsoft 365
4 13 (5.63%) GCP
5 11 (4.76%) Cloud Computing
6 9 (3.90%) Power Platform
7 4 (1.73%) Entra ID
7 4 (1.73%) Microsoft Purview
8 3 (1.30%) Azure AKS
8 3 (1.30%) Azure DevOps
8 3 (1.30%) Google Workspace
8 3 (1.30%) OneDrive
8 3 (1.30%) SaaS
9 2 (0.87%) Azure Functions
9 2 (0.87%) Canva
9 2 (0.87%) OCI
9 2 (0.87%) PaaS
9 2 (0.87%) Salsify
9 2 (0.87%) Serverless
9 2 (0.87%) Yammer
Communications & Networking
1 6 (2.60%) Firewall
2 5 (2.16%) SSL
2 5 (2.16%) VPN
3 4 (1.73%) Intranet
4 3 (1.30%) DNS
4 3 (1.30%) HTTP
4 3 (1.30%) Intrusion Detection
4 3 (1.30%) NAS
4 3 (1.30%) Network Security
5 2 (0.87%) IPsec
5 2 (0.87%) LAN
5 2 (0.87%) MPLS
5 2 (0.87%) SMTP
5 2 (0.87%) Unified Communications
5 2 (0.87%) WAN
5 2 (0.87%) Wireless
6 1 (0.43%) DHCP
6 1 (0.43%) Extranet
6 1 (0.43%) SNMP
6 1 (0.43%) TCP/IP
Database & Business Intelligence
1 9 (3.90%) Power BI
2 6 (2.60%) Metadata
2 6 (2.60%) Power Query
3 4 (1.73%) DB2
3 4 (1.73%) Oracle Reports
3 4 (1.73%) Tableau
4 3 (1.30%) NoSQL
4 3 (1.30%) PostgreSQL
5 2 (0.87%) Azure SQL Database
5 2 (0.87%) Electronic Patient Records
6 1 (0.43%) BusinessObjects
6 1 (0.43%) Delta Lake
6 1 (0.43%) Geospatial Data
6 1 (0.43%) GIS
6 1 (0.43%) Looker
6 1 (0.43%) PowerPivot
6 1 (0.43%) Relational Database
6 1 (0.43%) SAP Data Services
6 1 (0.43%) SAP HANA
6 1 (0.43%) SQL Server
Development Applications
1 5 (2.16%) JIRA
2 4 (1.73%) Jenkins
3 3 (1.30%) Git
4 2 (0.87%) Oracle Forms
5 1 (0.43%) Axure RP
5 1 (0.43%) Balsamiq
5 1 (0.43%) Bitbucket Server
5 1 (0.43%) Browser DevTools
5 1 (0.43%) Subversion
5 1 (0.43%) TeamCity
5 1 (0.43%) Vite
5 1 (0.43%) webpack
General
1 95 (41.13%) Social Skills
2 70 (30.30%) Finance
3 52 (22.51%) Analytical Skills
4 26 (11.26%) Public Sector
5 22 (9.52%) Banking
6 17 (7.36%) Investment Banking
7 14 (6.06%) Presentation Skills
8 10 (4.33%) Inclusion and Diversity
9 9 (3.90%) Legal
10 8 (3.46%) Automotive
10 8 (3.46%) Manufacturing
10 8 (3.46%) Marketing
11 7 (3.03%) Documentation Skills
12 5 (2.16%) Back Office
12 5 (2.16%) Influencing Skills
13 3 (1.30%) General Ledger
13 3 (1.30%) Law
13 3 (1.30%) Local Government
13 3 (1.30%) Military
13 3 (1.30%) Publishing
Job Titles
1 50 (21.65%) Analyst
2 33 (14.29%) Architect
3 22 (9.52%) Solutions Architect
4 15 (6.49%) Consultant
5 14 (6.06%) Senior
6 13 (5.63%) Python Engineer
7 12 (5.19%) Administrator
7 12 (5.19%) Business Analyst
8 11 (4.76%) Project Manager
9 10 (4.33%) IT Manager
9 10 (4.33%) Lead
9 10 (4.33%) Technical Architect
9 10 (4.33%) Technical Solutions Architect
10 9 (3.90%) Programmer
10 9 (3.90%) Python Programmer
10 9 (3.90%) Systems Analyst
10 9 (3.90%) Technical Analyst
11 8 (3.46%) Data Analyst
11 8 (3.46%) Integration Architect
11 8 (3.46%) JavaScript Engineer
Libraries, Frameworks & Software Standards
1 6 (2.60%) Kafka
1 6 (2.60%) Oracle Fusion
2 5 (2.16%) CSS
2 5 (2.16%) HTML
2 5 (2.16%) Middleware
3 3 (1.30%) .NET
3 3 (1.30%) 802.1X
3 3 (1.30%) SailPoint
4 2 (0.87%) AngularJS
4 2 (0.87%) HTML5
4 2 (0.87%) OAuth
4 2 (0.87%) OpenID
4 2 (0.87%) React
4 2 (0.87%) SAML
5 1 (0.43%) ADO
5 1 (0.43%) EDI
5 1 (0.43%) SAP PI
5 1 (0.43%) SOAP
5 1 (0.43%) Web Services
5 1 (0.43%) YAML
Miscellaneous
1 13 (5.63%) Operational Technology
2 11 (4.76%) Security Posture
3 9 (3.90%) Distributed Systems
4 7 (3.03%) Data Centre
4 7 (3.03%) IoT
4 7 (3.03%) Life Science
5 6 (2.60%) Derivative
5 6 (2.60%) Legacy Systems
5 6 (2.60%) Renewable Energy
6 5 (2.16%) Industry 4.0
6 5 (2.16%) Onboarding
7 4 (1.73%) CMDB
7 4 (1.73%) Cyber Threat
7 4 (1.73%) Mainframe
7 4 (1.73%) NHS
7 4 (1.73%) Product Ownership
8 3 (1.30%) Data Protection Act
8 3 (1.30%) LIMS
8 3 (1.30%) Market Risk
8 3 (1.30%) PMI
Operating Systems
1 23 (9.96%) Linux
1 23 (9.96%) Windows
2 15 (6.49%) Unix
3 9 (3.90%) Windows 10
4 8 (3.46%) Windows Server
5 4 (1.73%) zOS
6 1 (0.43%) Mac OS X
Processes & Methodologies
1 72 (31.17%) Problem-Solving
2 49 (21.21%) Stakeholder Management
3 46 (19.91%) Risk Management
4 44 (19.05%) Decision-Making
5 37 (16.02%) Computer Science
5 37 (16.02%) Project Management
6 35 (15.15%) Agile
7 25 (10.82%) Change Management
7 25 (10.82%) Roadmaps
8 24 (10.39%) Information Management
8 24 (10.39%) Information Security
9 22 (9.52%) Analytics
9 22 (9.52%) Continuous Improvement
10 21 (9.09%) Data Management
11 19 (8.23%) Artificial Intelligence
12 18 (7.79%) Cybersecurity
13 17 (7.36%) Collaborative Working
13 17 (7.36%) Regulatory Compliance
14 16 (6.93%) Capacity Management
15 15 (6.49%) ITIL
Programming Languages
1 28 (12.12%) Python
2 25 (10.82%) SQL
3 22 (9.52%) Java
4 15 (6.49%) JavaScript
5 10 (4.33%) Perl
5 10 (4.33%) TypeScript
6 6 (2.60%) PowerShell
6 6 (2.60%) VBA
7 1 (0.43%) Apex Code
7 1 (0.43%) Bash
7 1 (0.43%) Bicep
7 1 (0.43%) C
7 1 (0.43%) C++
7 1 (0.43%) PeopleCode
7 1 (0.43%) PL/SQL
7 1 (0.43%) R
7 1 (0.43%) Scala
7 1 (0.43%) VB
Qualifications
1 59 (25.54%) Degree
2 25 (10.82%) Security Cleared
3 23 (9.96%) Computer Science Degree
4 18 (7.79%) CISSP
5 17 (7.36%) SC Cleared
6 10 (4.33%) CISA
7 9 (3.90%) CISM
7 9 (3.90%) Master's Degree
7 9 (3.90%) PMI Certification
8 7 (3.03%) PMP
9 5 (2.16%) DV Cleared
10 4 (1.73%) IBM Certification
10 4 (1.73%) Microsoft Certification
11 3 (1.30%) Azure Certification
11 3 (1.30%) DBS Check
11 3 (1.30%) ISO 27001 Lead Auditor
11 3 (1.30%) ITIL Certification
12 2 (0.87%) CompTIA Security+
12 2 (0.87%) OCP
12 2 (0.87%) Oracle Certification
Quality Assurance & Compliance
1 17 (7.36%) GDPR
2 16 (6.93%) ISO/IEC 27001
3 15 (6.49%) NIST
4 14 (6.06%) SLA
5 13 (5.63%) Data Quality
5 13 (5.63%) QA
6 7 (3.03%) Accessibility
6 7 (3.03%) Disclosure Scotland
7 6 (2.60%) COBIT
7 6 (2.60%) Sarbanes-Oxley
8 5 (2.16%) NCSC
9 4 (1.73%) COSO
9 4 (1.73%) GRC
9 4 (1.73%) PCI DSS
10 3 (1.30%) PMO
11 2 (0.87%) Actionable Recommendations
11 2 (0.87%) ISO/IEC 27002 (supersedes ISO/IEC 17799)
11 2 (0.87%) MiFID
11 2 (0.87%) NIST 800
11 2 (0.87%) WCAG
System Software
1 18 (7.79%) Active Directory
2 6 (2.60%) Virtual Machines
3 4 (1.73%) RACF
4 2 (0.87%) Docker
5 1 (0.43%) Firmware
5 1 (0.43%) Hyper-V
5 1 (0.43%) VMware Infrastructure
5 1 (0.43%) VMware NSX
5 1 (0.43%) vSphere
Systems Management
1 4 (1.73%) Kubernetes
2 3 (1.30%) OPNET
2 3 (1.30%) Terraform
3 1 (0.43%) Ansible
3 1 (0.43%) CASB
3 1 (0.43%) CSIRT
3 1 (0.43%) Grafana
3 1 (0.43%) Microsoft Intune
3 1 (0.43%) PaperCut
3 1 (0.43%) Prometheus
3 1 (0.43%) Single Sign-On
Vendors
1 40 (17.32%) Microsoft
2 16 (6.93%) SAP
2 16 (6.93%) ServiceNow
3 14 (6.06%) Oracle
4 8 (3.46%) Google
4 8 (3.46%) IBM
5 3 (1.30%) Dell
5 3 (1.30%) HP
5 3 (1.30%) Snow
6 2 (0.87%) Adobe
6 2 (0.87%) Autodesk
6 2 (0.87%) Cisco
6 2 (0.87%) Darktrace
6 2 (0.87%) F5
6 2 (0.87%) Informatica
6 2 (0.87%) Instagram
6 2 (0.87%) MEDITECH
6 2 (0.87%) Salesforce
6 2 (0.87%) Splunk
6 2 (0.87%) Workday