Data Modelling Contracts with Hybrid/Remote/WFH Options

Data Modelling
UK > Work from Home

The table below provides summary statistics for remote or hybrid contract work requiring Data Modelling skills. It includes a benchmarking guide to the contractor rates offered in vacancies that cited Data Modelling over the 6 months leading up to 30 April 2025, comparing them to the same period in the previous two years.

6 months to
30 Apr 2025
Same period 2024 Same period 2023
Rank 46 43 72
Rank change year-on-year -3 +29 -10
Contract jobs citing Data Modelling 433 638 830
As % of all contract jobs with a WFH option 4.37% 4.15% 3.21%
As % of the Processes & Methodologies category 4.80% 4.72% 3.57%
Number of daily rates quoted 307 482 592
10th Percentile £346 £413 £406
25th Percentile £419 £475 £475
Median daily rate (50th Percentile) £513 £550 £557
Median % change year-on-year -6.82% -1.17% -3.22%
75th Percentile £638 £663 £675
90th Percentile £750 £750 £763
UK median daily rate £525 £550 £575
% change year-on-year -4.55% -4.35% -
Number of hourly rates quoted 8 6 12
10th Percentile £31.78 - -
25th Percentile £57.28 £35.00 £19.00
Median hourly rate £67.50 £41.75 £19.98
Median % change year-on-year +61.68% +108.96% -69.51%
75th Percentile £99.42 £60.96 £66.00
90th Percentile £102.00 £66.64 -
UK median hourly rate £52.50 £48.50 £35.00
% change year-on-year +8.25% +38.57% -27.46%

All Process and Methodology Skills
Work from Home

Data Modelling falls under the Processes and Methodologies category. For comparison with the information above, the following table provides summary statistics for all contract job vacancies with remote or hybrid options requiring process or methodology skills.

Contract vacancies with a requirement for process or methodology skills 9,023 13,505 23,232
As % of all contract jobs with a WFH option 91.03% 87.83% 89.84%
Number of daily rates quoted 6,195 9,015 16,421
10th Percentile £340 £325 £363
25th Percentile £419 £425 £450
Median daily rate (50th Percentile) £525 £525 £540
Median % change year-on-year - -2.78% +2.86%
75th Percentile £638 £638 £650
90th Percentile £763 £750 £750
UK median daily rate £521 £525 £550
% change year-on-year -0.86% -4.55% +4.76%
Number of hourly rates quoted 225 573 532
10th Percentile £14.20 £15.17 £19.00
25th Percentile £19.75 £24.25 £30.54
Median hourly rate £40.00 £42.50 £55.00
Median % change year-on-year -5.88% -22.73% +57.14%
75th Percentile £67.50 £60.00 £68.75
90th Percentile £75.00 £75.25 £80.23
UK median hourly rate £29.00 £35.50 £37.30
% change year-on-year -18.31% -4.83% +49.20%

Data Modelling
Trend for Jobs with a WFH Option

Job vacancies with remote working options citing Data Modelling as a proportion of all IT jobs advertised.
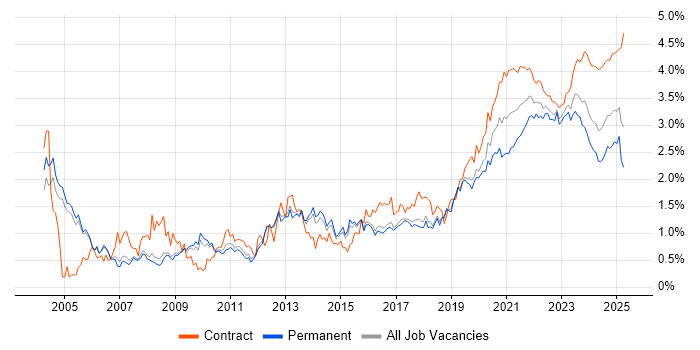
Data Modelling trend for jobs with Hybrid/Remote/WFH options

Data Modelling
Daily Rate Trend for Jobs with a WFH Option

3-month moving average daily rate quoted in job vacancies with remote working options citing Data Modelling.

Data Modelling daily rate for jobs with a WFH option

Data Modelling
Daily Rate Histogram for Jobs with a WFH Option

Daily rate distribution for jobs with remote working options citing Data Modelling over the 6 months to 30 April 2025.

Data Modelling daily rate histogram for jobs with a WFH option

Data Modelling
Hourly Rate Trend for Jobs with a WFH Option

3-month moving average hourly rate quoted in job vacancies with remote working options citing Data Modelling.

Data Modelling hourly rate for jobs with a WFH option

Data Modelling
Hourly Rate Histogram for Jobs with a WFH Option

Hourly rate distribution for jobs with remote working options citing Data Modelling over the 6 months to 30 April 2025.

Data Modelling hourly rate histogram for jobs with a WFH option

Data Modelling
Co-occurring Skills and Capabilities with WFH Options by Category

The follow tables expand on the table above by listing co-occurrences grouped by category. The same employment type, locality and period is covered with up to 20 co-occurrences shown in each of the following categories:

Application Platforms
1 18 (4.16%) Confluence
2 17 (3.93%) Apache Airflow
3 12 (2.77%) Apache Spark
4 11 (2.54%) SharePoint
5 10 (2.31%) Apache
6 3 (0.69%) Jupyter
7 2 (0.46%) IIS
8 1 (0.23%) Adobe Experience Manager
8 1 (0.23%) CMS
8 1 (0.23%) Luigi
8 1 (0.23%) SAS
Applications
1 17 (3.93%) Microsoft Excel
2 8 (1.85%) MS Visio
3 3 (0.69%) Microsoft Office
4 2 (0.46%) Oracle Smart View
4 2 (0.46%) Trello
5 1 (0.23%) Microsoft PowerPoint
5 1 (0.23%) Notepad++
Business Applications
1 11 (2.54%) Aladdin
2 9 (2.08%) SAP S/4HANA
2 9 (2.08%) Sparx Enterprise Architect
3 6 (1.39%) Dynamics CRM
4 3 (0.69%) Oracle EBS
4 3 (0.69%) SAP MDG
5 2 (0.46%) Endur
5 2 (0.46%) Misys Midas
5 2 (0.46%) Payment Gateway
5 2 (0.46%) Salesforce CRM
5 2 (0.46%) SAP EHS
5 2 (0.46%) SAP ERP
6 1 (0.23%) Adobe Campaign
6 1 (0.23%) IBM Planning Analytics
6 1 (0.23%) Maximo
6 1 (0.23%) Oracle ERP
6 1 (0.23%) SAP EWM
6 1 (0.23%) SAP MM
6 1 (0.23%) Siebel CRM
Cloud Services
1 143 (33.03%) Azure
2 108 (24.94%) Power Platform
3 84 (19.40%) AWS
4 37 (8.55%) dbt
5 34 (7.85%) GCP
6 32 (7.39%) Snowflake
7 30 (6.93%) Azure Data Factory
7 30 (6.93%) Azure Synapse Analytics
8 25 (5.77%) GitHub
9 21 (4.85%) PowerApps
10 18 (4.16%) Serverless
11 16 (3.70%) Amazon S3
11 16 (3.70%) GitHub Actions
12 15 (3.46%) Dynamics 365
12 15 (3.46%) SaaS
13 13 (3.00%) AWS Lambda
14 12 (2.77%) Azure DevOps
14 12 (2.77%) OCI
15 11 (2.54%) Microsoft 365
15 11 (2.54%) Power Automate
Communications & Networking
1 2 (0.46%) Intrusion Detection
2 1 (0.23%) Internet
2 1 (0.23%) SMS
2 1 (0.23%) Unified Communications
Database & Business Intelligence
1 94 (21.71%) Power BI
2 88 (20.32%) Data Warehouse
3 51 (11.78%) Data Lake
4 48 (11.09%) Metadata
5 31 (7.16%) SQL Server
6 29 (6.70%) Relational Database
7 27 (6.24%) Tableau
8 24 (5.54%) Big Data
9 22 (5.08%) NoSQL
10 18 (4.16%) SQL Server Integration Services
11 16 (3.70%) PostgreSQL
11 16 (3.70%) Snowflake Schema
12 15 (3.46%) Amazon Redshift
12 15 (3.46%) Azure SQL Database
13 13 (3.00%) RDBMS
14 10 (2.31%) Amazon RDS
14 10 (2.31%) Metadata Repository
14 10 (2.31%) Power Query
15 9 (2.08%) BigQuery
15 9 (2.08%) Oracle Database
Development Applications
1 24 (5.54%) JIRA
2 21 (4.85%) ERwin
3 15 (3.46%) Git
4 9 (2.08%) ER Studio
5 6 (1.39%) Jenkins
6 5 (1.15%) MLflow
7 4 (0.92%) GitLab
7 4 (0.92%) Oracle Forms
7 4 (0.92%) PVCS
7 4 (0.92%) Subversion
8 3 (0.69%) PowerDesigner
8 3 (0.69%) Visual Studio
9 2 (0.46%) CircleCI
9 2 (0.46%) Postman
9 2 (0.46%) Rational DOORS
9 2 (0.46%) SQL Server Management Studio (SSMS)
10 1 (0.23%) Hudson
10 1 (0.23%) Liquibase
10 1 (0.23%) Rational Rhapsody
10 1 (0.23%) Terragrunt
General
1 120 (27.71%) Social Skills
2 85 (19.63%) Analytical Skills
3 77 (17.78%) Finance
4 65 (15.01%) Public Sector
5 25 (5.77%) Banking
6 20 (4.62%) Retail
7 13 (3.00%) Marketing
8 12 (2.77%) Presentation Skills
9 10 (2.31%) Documentation Skills
10 9 (2.08%) Inclusion and Diversity
10 9 (2.08%) Manufacturing
11 6 (1.39%) Automotive
11 6 (1.39%) Influencing Skills
11 6 (1.39%) Military
11 6 (1.39%) Pharmaceutical
12 5 (1.15%) Back Office
12 5 (1.15%) Local Government
13 4 (0.92%) Organisational Skills
13 4 (0.92%) Telecoms
14 3 (0.69%) Health Technology
Job Titles
1 90 (20.79%) Architect
2 79 (18.24%) Data Engineer
3 63 (14.55%) Analyst
3 63 (14.55%) Data Architect
4 58 (13.39%) Developer
5 46 (10.62%) Senior
6 38 (8.78%) Data Modeller
7 37 (8.55%) Lead
8 25 (5.77%) Consultant
8 25 (5.77%) Data Analyst
9 24 (5.54%) Business Analyst
10 15 (3.46%) Senior Data Engineer
11 12 (2.77%) Azure Data Engineer
11 12 (2.77%) Azure Engineer
12 11 (2.54%) Business Intelligence Analyst
13 10 (2.31%) Business Intelligence Developer
13 10 (2.31%) Data Business Analyst
13 10 (2.31%) Lead Data Engineer
13 10 (2.31%) Oracle Developer
13 10 (2.31%) Solutions Architect
Libraries, Frameworks & Software Standards
1 20 (4.62%) PySpark
2 17 (3.93%) Jinja
3 12 (2.77%) React
3 12 (2.77%) REST
4 11 (2.54%) Kafka
5 9 (2.08%) JSON
6 7 (1.62%) Node.js
6 7 (1.62%) Oracle Fusion
7 6 (1.39%) OAuth
7 6 (1.39%) XML
8 5 (1.15%) AngularJS
8 5 (1.15%) Lightning Web Components
8 5 (1.15%) Plotly
8 5 (1.15%) scikit-learn
9 4 (0.92%) Java EE
9 4 (0.92%) RESTful
9 4 (0.92%) TensorFlow
10 3 (0.69%) Django
10 3 (0.69%) Matplotlib
10 3 (0.69%) OAuth2
Miscellaneous
1 31 (7.16%) Data Structures
2 21 (4.85%) Legacy Systems
3 16 (3.70%) Product Ownership
4 9 (2.08%) Algorithms
4 9 (2.08%) Cloud Native
5 6 (1.39%) CMDB
5 6 (1.39%) Management Information System
6 5 (1.15%) Clustering
6 5 (1.15%) Data Fabric
6 5 (1.15%) Reference Data
7 4 (0.92%) FMCG
8 3 (0.69%) Data Protection Act
8 3 (0.69%) Derivative
8 3 (0.69%) Distributed Systems
8 3 (0.69%) Industry 4.0
8 3 (0.69%) Life Science
8 3 (0.69%) Manufacturing Execution System
8 3 (0.69%) Onboarding
8 3 (0.69%) Operational Technology
8 3 (0.69%) Self-Motivation
Operating Systems
1 3 (0.69%) Linux
2 1 (0.23%) Windows
Processes & Methodologies
1 133 (30.72%) Analytics
2 122 (28.18%) ETL
3 120 (27.71%) Business Intelligence
4 89 (20.55%) Problem-Solving
5 82 (18.94%) Agile
6 75 (17.32%) Data Governance
7 74 (17.09%) Data Architecture
8 67 (15.47%) Data Integration
8 67 (15.47%) Data Pipeline
9 60 (13.86%) Migration
10 54 (12.47%) CI/CD
10 54 (12.47%) Visualisation
11 52 (12.01%) Data Engineering
12 51 (11.78%) Stakeholder Management
13 46 (10.62%) Logical Data Model
14 44 (10.16%) Data Analysis
14 44 (10.16%) DevOps
15 43 (9.93%) Decision-Making
16 42 (9.70%) Data Migration
17 40 (9.24%) Physical Data Model
Programming Languages
1 213 (49.19%) SQL
2 97 (22.40%) Python
3 24 (5.54%) Java
4 18 (4.16%) PL/SQL
5 16 (3.70%) Data Analysis Expressions
5 16 (3.70%) JavaScript
6 12 (2.77%) R
6 12 (2.77%) Scala
7 11 (2.54%) T-SQL
8 5 (1.15%) ABAP
8 5 (1.15%) Apex Code
9 4 (0.92%) C
9 4 (0.92%) ProC
9 4 (0.92%) TypeScript
9 4 (0.92%) VB
10 3 (0.69%) C++
11 2 (0.46%) C#
11 2 (0.46%) Gremlin
11 2 (0.46%) PowerShell
11 2 (0.46%) SPARQL
Qualifications
1 67 (15.47%) Security Cleared
2 59 (13.63%) SC Cleared
3 43 (9.93%) Degree
4 21 (4.85%) Computer Science Degree
5 13 (3.00%) Master's Degree
6 12 (2.77%) BPSS Clearance
7 10 (2.31%) AWS Certification
7 10 (2.31%) Microsoft Certification
8 6 (1.39%) Azure Certification
9 5 (1.15%) Numerate Degree
10 4 (0.92%) AWS Certified Solutions Architect
11 2 (0.46%) DV Cleared
11 2 (0.46%) ITIL Certification
11 2 (0.46%) ITIL Foundation Certificate
12 1 (0.23%) ACCA
12 1 (0.23%) CIMA
12 1 (0.23%) CITP
12 1 (0.23%) PhD
12 1 (0.23%) Siebel Certification
12 1 (0.23%) SnowPro
Quality Assurance & Compliance
1 68 (15.70%) Data Quality
2 20 (4.62%) QA
3 14 (3.23%) GDPR
4 12 (2.77%) Accessibility
5 6 (1.39%) California Consumer Privacy Act
6 5 (1.15%) NIST
7 3 (0.69%) HL7
8 2 (0.46%) IFRS
8 2 (0.46%) MISRA
8 2 (0.46%) MISRA C
9 1 (0.23%) Actionable Recommendations
9 1 (0.23%) Basel III
9 1 (0.23%) HIPAA
9 1 (0.23%) IFRS 17
9 1 (0.23%) IFRS 9
9 1 (0.23%) ISO 20022
9 1 (0.23%) NCSC
System Software
1 10 (2.31%) Docker
2 4 (0.92%) Active Directory
3 1 (0.23%) Hyper-V
3 1 (0.23%) VMware Infrastructure
Systems Management
1 14 (3.23%) Terraform
2 9 (2.08%) Kubernetes
3 3 (0.69%) MOM
4 2 (0.46%) Active Directory Federation Services
4 2 (0.46%) Grafana
4 2 (0.46%) Kubeflow
4 2 (0.46%) Prometheus
5 1 (0.23%) Single Sign-On
Vendors
1 73 (16.86%) Microsoft
2 58 (13.39%) Databricks
3 51 (11.78%) Oracle
4 34 (7.85%) SAP
5 21 (4.85%) Google
6 18 (4.16%) Salesforce
7 11 (2.54%) Informatica
8 10 (2.31%) Sparx
9 7 (1.62%) ServiceNow
10 6 (1.39%) Ariba
10 6 (1.39%) IBM
11 5 (1.15%) Cloudera
12 4 (0.92%) Alteryx
12 4 (0.92%) Atlassian
12 4 (0.92%) MuleSoft
13 3 (0.69%) Rockwell
13 3 (0.69%) Siemens
13 3 (0.69%) Talend
14 2 (0.46%) Sage
14 2 (0.46%) TIBCO