Oracle Contracts with Hybrid/Remote/WFH Options

Oracle
UK > Work from Home

The table below provides summary statistics for remote or hybrid contract work requiring knowledge or experience of Oracle products and/or services. It includes a benchmarking guide to contractor rates offered in vacancies that cited Oracle over the 6 months leading up to 1 May 2025, comparing them to the same period in the previous two years.

The figures below represent the IT contractor job market in general and are not representative of contractor rates within the Oracle Corporation.

6 months to
1 May 2025
Same period 2024 Same period 2023
Rank 33 37 35
Rank change year-on-year +4 -2 +6
Contract jobs citing Oracle 602 804 1,524
As % of all contract jobs with a WFH option 6.08% 5.24% 5.89%
As % of the Vendors category 13.26% 12.36% 13.69%
Number of daily rates quoted 433 537 971
10th Percentile £392 £400 £400
25th Percentile £445 £463 £438
Median daily rate (50th Percentile) £540 £550 £525
Median % change year-on-year -1.82% +4.76% -2.78%
75th Percentile £675 £638 £650
90th Percentile £823 £725 £790
UK median daily rate £530 £550 £540
% change year-on-year -3.64% +1.85% -1.82%
Number of hourly rates quoted 4 15 20
10th Percentile £55.13 - £58.23
25th Percentile £59.06 £25.50 £61.81
Median hourly rate £62.50 £26.00 £72.50
Median % change year-on-year +140.38% -64.14% +87.10%
75th Percentile £71.25 £26.50 £85.00
90th Percentile £84.75 £48.40 £85.25
UK median hourly rate £30.40 £38.50 £64.50
% change year-on-year -21.04% -40.31% +77.32%

All Vendors
Work from Home

Oracle falls under the Vendor Products and Services category. For comparison with the information above, the following table provides summary statistics for all contract job vacancies with a remote or hybrid options requiring knowledge or experience of all vendor products and services.

Contract vacancies with a requirement for knowledge or experience of vendor products and services 4,540 6,506 11,129
As % of all contract jobs with a WFH option 45.84% 42.40% 43.04%
Number of daily rates quoted 2,959 4,024 7,488
10th Percentile £325 £325 £330
25th Percentile £413 £425 £425
Median daily rate (50th Percentile) £525 £525 £525
Median % change year-on-year -0.10% - -
75th Percentile £625 £625 £650
90th Percentile £738 £725 £750
UK median daily rate £515 £517 £525
% change year-on-year -0.39% -1.52% -
Number of hourly rates quoted 120 220 258
10th Percentile £14.20 £13.92 £17.87
25th Percentile £19.56 £16.93 £31.81
Median hourly rate £47.25 £32.31 £54.50
Median % change year-on-year +46.25% -40.72% +55.71%
75th Percentile £68.00 £60.00 £68.75
90th Percentile £86.00 £72.50 £80.25
UK median hourly rate £26.45 £22.30 £43.75
% change year-on-year +18.61% -49.03% +108.14%

Oracle
Trend for Jobs with a WFH Option

Job vacancies with remote working options citing Oracle as a proportion of all IT jobs advertised.
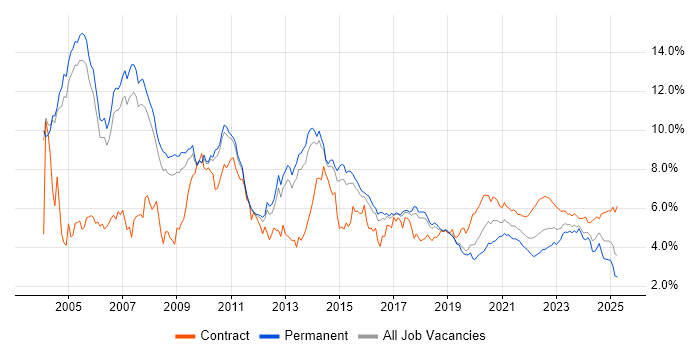
Oracle trend for jobs with Hybrid/Remote/WFH options

Oracle
Daily Rate Trend for Jobs with a WFH Option

3-month moving average daily rate quoted in job vacancies with remote working options citing Oracle.

Oracle daily rate for jobs with a WFH option

Oracle
Daily Rate Histogram for Jobs with a WFH Option

Daily rate distribution for jobs with remote working options citing Oracle over the 6 months to 1 May 2025.

Oracle daily rate histogram for jobs with a WFH option

Oracle
Hourly Rate Trend for Jobs with a WFH Option

3-month moving average hourly rate quoted in job vacancies with remote working options citing Oracle.

Oracle hourly rate for jobs with a WFH option

Oracle
Hourly Rate Histogram for Jobs with a WFH Option

Hourly rate distribution for jobs with remote working options citing Oracle over the 6 months to 1 May 2025.

Oracle hourly rate histogram for jobs with a WFH option

Oracle
Co-occurring Skills and Capabilities with WFH Options by Category

The follow tables expand on the table above by listing co-occurrences grouped by category. The same employment type, locality and period is covered with up to 20 co-occurrences shown in each of the following categories:

Application Platforms
1 36 (5.98%) Confluence
2 13 (2.16%) Oracle Coherence
3 11 (1.83%) Oracle Workflow
4 10 (1.66%) Oracle SOA Suite
4 10 (1.66%) SharePoint
5 8 (1.33%) GemFire
5 8 (1.33%) WebSphere
6 6 (1.00%) SAS
7 5 (0.83%) CMS
7 5 (0.83%) Documentum
7 5 (0.83%) Oracle Self-Service HR
7 5 (0.83%) WebLogic
8 4 (0.66%) Apache Spark
9 3 (0.50%) Adobe Experience Manager
9 3 (0.50%) Apache
9 3 (0.50%) IIS
9 3 (0.50%) JBoss
9 3 (0.50%) Microsoft Exchange
9 3 (0.50%) PowerExchange
10 2 (0.33%) Tomcat
Applications
1 18 (2.99%) Microsoft Excel
2 17 (2.82%) Microsoft Office
3 8 (1.33%) Oracle Smart View
4 3 (0.50%) Microsoft PowerPoint
5 2 (0.33%) Microsoft Project
6 1 (0.17%) MS Visio
6 1 (0.17%) Notepad++
6 1 (0.17%) Trello
Business Applications
1 69 (11.46%) Oracle EBS
2 27 (4.49%) Oracle EBS R12
3 24 (3.99%) Oracle ERP
4 22 (3.65%) Oracle Payables
5 16 (2.66%) Oracle Financials
6 14 (2.33%) Oracle General Ledger
7 13 (2.16%) Oracle Assets
7 13 (2.16%) Oracle Receivables
8 11 (1.83%) Maximo
8 11 (1.83%) Oracle ASCP
9 10 (1.66%) Primavera
10 8 (1.33%) Oracle Cash Management
10 8 (1.33%) Oracle E-Business Tax
11 6 (1.00%) Endur
11 6 (1.00%) SAP S/4HANA
12 5 (0.83%) Oracle Procure-to-Pay
13 4 (0.66%) NetSuite
13 4 (0.66%) Oracle Applications
13 4 (0.66%) Sage X3
13 4 (0.66%) Unit4 Business World
Cloud Services
1 79 (13.12%) AWS
2 74 (12.29%) OCI
3 72 (11.96%) Azure
4 27 (4.49%) SaaS
5 25 (4.15%) Power Platform
5 25 (4.15%) Serverless
6 16 (2.66%) AWS Lambda
7 15 (2.49%) Amazon S3
7 15 (2.49%) GCP
8 12 (1.99%) Azure DevOps
8 12 (1.99%) Entra ID
9 9 (1.50%) PaaS
10 6 (1.00%) Amazon EC2
10 6 (1.00%) IaaS
11 5 (0.83%) BigCommerce
11 5 (0.83%) IBM Blueworks
11 5 (0.83%) Oracle CX
11 5 (0.83%) Snowflake
12 4 (0.66%) Azure Cosmos DB
12 4 (0.66%) Dynamics 365
Communications & Networking
1 7 (1.16%) Firewall
2 6 (1.00%) DNS
3 4 (0.66%) SAN
3 4 (0.66%) TCP/IP
4 3 (0.50%) DHCP
4 3 (0.50%) VPN
5 2 (0.33%) HTTP
5 2 (0.33%) IPsec
5 2 (0.33%) Network Security
5 2 (0.33%) SSL
5 2 (0.33%) Wireless
6 1 (0.17%) 4G
6 1 (0.17%) 5G
6 1 (0.17%) Converged Networks
6 1 (0.17%) HTTPS
6 1 (0.17%) NAS
6 1 (0.17%) Radio Access Network
6 1 (0.17%) Softphone
6 1 (0.17%) Unified Communications
6 1 (0.17%) Wi-Fi
Database & Business Intelligence
1 100 (16.61%) Oracle Database
2 65 (10.80%) SQL Server
3 51 (8.47%) PostgreSQL
4 49 (8.14%) Oracle Reports
5 43 (7.14%) Relational Database
6 30 (4.98%) MySQL
7 22 (3.65%) MongoDB
7 22 (3.65%) RDBMS
8 21 (3.49%) Data Warehouse
9 19 (3.16%) Power BI
10 18 (2.99%) Oracle BI Publisher
11 14 (2.33%) NoSQL
12 10 (1.66%) Amazon RDS
12 10 (1.66%) Big Data
12 10 (1.66%) Oracle ODI
13 9 (1.50%) Tableau
14 7 (1.16%) DB2
14 7 (1.16%) Oracle Database 11g
15 6 (1.00%) CockroachDB
15 6 (1.00%) Metadata
Development Applications
1 65 (10.80%) JIRA
2 27 (4.49%) Git
3 19 (3.16%) Jenkins
3 19 (3.16%) Visual Studio
4 13 (2.16%) Oracle APEX
5 12 (1.99%) Oracle Forms
6 11 (1.83%) GitLab
7 8 (1.33%) Subversion
8 7 (1.16%) Bitbucket
9 6 (1.00%) ERwin
10 5 (0.83%) Postman
11 4 (0.66%) JMeter
11 4 (0.66%) PVCS
11 4 (0.66%) Toad
12 3 (0.50%) JUnit
12 3 (0.50%) LoadRunner
12 3 (0.50%) Maven
12 3 (0.50%) Selenium
12 3 (0.50%) SoapUI
12 3 (0.50%) Team Foundation Server
General
1 202 (33.55%) Finance
2 201 (33.39%) Social Skills
3 126 (20.93%) Analytical Skills
4 67 (11.13%) Public Sector
5 56 (9.30%) Banking
6 21 (3.49%) Manufacturing
7 17 (2.82%) Front Office
8 16 (2.66%) General Ledger
9 13 (2.16%) Back Office
10 12 (1.99%) Law
10 12 (1.99%) Retail
11 10 (1.66%) Documentation Skills
12 9 (1.50%) Inclusion and Diversity
13 7 (1.16%) Investment Banking
13 7 (1.16%) Local Government
13 7 (1.16%) Organisational Skills
14 5 (0.83%) Presentation Skills
14 5 (0.83%) Telecoms
15 4 (0.66%) Influencing Skills
15 4 (0.66%) Legal
Job Titles
1 143 (23.75%) Developer
2 98 (16.28%) Consultant
3 70 (11.63%) Oracle Consultant
4 65 (10.80%) Analyst
5 59 (9.80%) Architect
6 42 (6.98%) Lead
7 40 (6.64%) C# Developer
8 39 (6.48%) Oracle Functional Consultant
9 37 (6.15%) Functional Consultant
9 37 (6.15%) Oracle Developer
10 25 (4.15%) Oracle Analyst
11 24 (3.99%) Oracle Architect
11 24 (3.99%) Senior
12 20 (3.32%) Java Developer
13 19 (3.16%) Data Engineer
13 19 (3.16%) DBA
14 18 (2.99%) .NET Developer
14 18 (2.99%) C++ Developer
14 18 (2.99%) C++/C# Developer
15 17 (2.82%) Data Analyst
Libraries, Frameworks & Software Standards
1 92 (15.28%) Oracle Fusion
2 58 (9.63%) .NET
3 42 (6.98%) Kafka
4 38 (6.31%) Web Services
5 37 (6.15%) AngularJS
6 33 (5.48%) REST
7 28 (4.65%) XML
8 27 (4.49%) ASP.NET
9 22 (3.65%) .NET Core
10 19 (3.16%) WCF
11 17 (2.82%) Middleware
12 16 (2.66%) SOAP
12 16 (2.66%) Spring
13 15 (2.49%) Reactive Extensions
14 14 (2.33%) JSON
15 13 (2.16%) React
15 13 (2.16%) Spring Boot
16 12 (1.99%) CSS
16 12 (1.99%) HTML
16 12 (1.99%) RESTful
Miscellaneous
1 22 (3.65%) Legacy Applications
2 21 (3.49%) Enterprise Software
2 21 (3.49%) Foreign Exchange (FX)
3 14 (2.33%) Management Information System
4 13 (2.16%) Data Centre
4 13 (2.16%) Onboarding
5 12 (1.99%) Legacy Systems
6 11 (1.83%) Product Ownership
7 9 (1.50%) Distributed Systems
8 8 (1.33%) Data Structures
9 7 (1.16%) Data Protection Act
9 7 (1.16%) Replication
10 6 (1.00%) Security Posture
11 5 (0.83%) Cloud Native
11 5 (0.83%) Greenfield Project
12 4 (0.66%) Derivative
12 4 (0.66%) Self-Motivation
13 3 (0.50%) Clustering
13 3 (0.50%) Private Cloud
13 3 (0.50%) Reference Data
Operating Systems
1 62 (10.30%) Windows
2 55 (9.14%) Linux
3 33 (5.48%) Unix
4 14 (2.33%) AIX
5 13 (2.16%) Windows Server
6 11 (1.83%) Red Hat Enterprise Linux
7 8 (1.33%) Oracle Linux
8 5 (0.83%) Solaris
9 2 (0.33%) Ubuntu
10 1 (0.17%) CentOS
10 1 (0.17%) Data ONTAP
10 1 (0.17%) Windows 10
Processes & Methodologies
1 142 (23.59%) Agile
2 127 (21.10%) Problem-Solving
3 109 (18.11%) Migration
4 95 (15.78%) DevOps
5 85 (14.12%) ERP
6 60 (9.97%) Analytics
6 60 (9.97%) Data Migration
7 51 (8.47%) Data Modelling
8 48 (7.97%) Performance Tuning
9 45 (7.48%) Business Intelligence
10 44 (7.31%) CI/CD
11 40 (6.64%) Change Management
12 35 (5.81%) Continuous Improvement
12 35 (5.81%) Project Management
13 34 (5.65%) User Acceptance Testing
14 33 (5.48%) Computer Science
14 33 (5.48%) ETL
14 33 (5.48%) Stakeholder Management
15 30 (4.98%) Microservices
16 29 (4.82%) Software Engineering
Programming Languages
1 222 (36.88%) SQL
2 100 (16.61%) PL/SQL
3 91 (15.12%) Java
4 68 (11.30%) C#
5 52 (8.64%) Python
6 36 (5.98%) JavaScript
7 24 (3.99%) TypeScript
8 20 (3.32%) C++
9 14 (2.33%) Delphi
10 11 (1.83%) Bash
11 10 (1.66%) PowerShell
12 8 (1.33%) C
13 7 (1.16%) Shell Script
14 5 (0.83%) Groovy
14 5 (0.83%) Perl
14 5 (0.83%) ProC
14 5 (0.83%) Ruby
14 5 (0.83%) T-SQL
14 5 (0.83%) VB
14 5 (0.83%) VBA
Qualifications
1 91 (15.12%) Security Cleared
2 80 (13.29%) SC Cleared
3 41 (6.81%) Degree
4 15 (2.49%) Computer Science Degree
5 11 (1.83%) BPSS Clearance
6 9 (1.50%) Oracle Certification
7 8 (1.33%) Numerate Degree
8 6 (1.00%) AWS Certification
9 4 (0.66%) Azure Certification
9 4 (0.66%) Cisco Certification
10 3 (0.50%) AWS Certified Solutions Architect
10 3 (0.50%) CISA
10 3 (0.50%) CISSP
10 3 (0.50%) OCP
11 2 (0.33%) CCNP
11 2 (0.33%) CIMA
11 2 (0.33%) Microsoft Certification
11 2 (0.33%) OCA
11 2 (0.33%) PMP
11 2 (0.33%) VMware Certified Professional (VCP)
Quality Assurance & Compliance
1 11 (1.83%) QA
2 9 (1.50%) SLA
3 8 (1.33%) GDPR
3 8 (1.33%) Sarbanes-Oxley
4 7 (1.16%) Data Quality
5 6 (1.00%) Disclosure Scotland
6 5 (0.83%) ISO/IEC 27001
7 3 (0.50%) Cyber Essentials
7 3 (0.50%) ITGC
7 3 (0.50%) NIST
8 2 (0.33%) Accessibility
8 2 (0.33%) ISO 20022
8 2 (0.33%) ISO/IEC 27002 (supersedes ISO/IEC 17799)
8 2 (0.33%) PCI DSS
9 1 (0.17%) Basel III
9 1 (0.17%) COREP
9 1 (0.17%) COSO
9 1 (0.17%) HIPAA
9 1 (0.17%) MiFID
9 1 (0.17%) SEPA
System Software
1 22 (3.65%) Docker
2 20 (3.32%) Active Directory
3 11 (1.83%) VMware Infrastructure
4 8 (1.33%) GridGain
5 5 (0.83%) Virtual Machines
6 4 (0.66%) Oracle RAC
6 4 (0.66%) VMware ESXi
7 3 (0.50%) HDFS
7 3 (0.50%) vSphere
8 1 (0.17%) Hyper-V
8 1 (0.17%) KVM
8 1 (0.17%) LXC
Systems Management
1 19 (3.16%) Ansible
2 16 (2.66%) Kubernetes
3 12 (1.99%) Terraform
4 10 (1.66%) Oracle Enterprise Manager
4 10 (1.66%) Oracle RMAN
5 8 (1.33%) Data Guard
6 7 (1.16%) Single Sign-On
7 5 (0.83%) Grafana
8 4 (0.66%) Tivoli
8 4 (0.66%) Tivoli Storage Manager
9 3 (0.50%) HP ALM
10 2 (0.33%) CEMLI
10 2 (0.33%) vCenter Server
11 1 (0.17%) EMC NetWorker
11 1 (0.17%) Nagios
11 1 (0.17%) Netcool
11 1 (0.17%) OfficeScan
11 1 (0.17%) PowerCLI
11 1 (0.17%) Prometheus
11 1 (0.17%) Trend Micro Deep Security
Vendors
1 59 (9.80%) Microsoft
2 33 (5.48%) SAP
3 21 (3.49%) IBM
4 20 (3.32%) ServiceNow
5 16 (2.66%) Salesforce
5 16 (2.66%) VMware
6 12 (1.99%) CyberArk
7 10 (1.66%) MuleSoft
7 10 (1.66%) Red Hat
7 10 (1.66%) Siebel
8 9 (1.50%) Sybase
8 9 (1.50%) Workday
9 8 (1.33%) Commvault
9 8 (1.33%) Google
9 8 (1.33%) Informatica
10 7 (1.16%) Atlassian
11 6 (1.00%) Cisco
11 6 (1.00%) IFS
11 6 (1.00%) OpenLink
11 6 (1.00%) Splunk