Linux Jobs in London

Linux
England > London

The table below provides summary statistics for permanent job vacancies advertised in London requiring Linux skills. It includes a benchmarking guide to the annual salaries offered in vacancies that cited Linux over the 6 months leading up to 26 April 2025, comparing them to the same period in the previous two years.

6 months to
26 Apr 2025
Same period 2024 Same period 2023
Rank 49 37 35
Rank change year-on-year -12 -2 +8
Permanent jobs citing Linux 753 1,303 2,546
As % of all permanent jobs advertised in London 5.85% 5.53% 7.07%
As % of the Operating Systems category 41.95% 41.51% 45.44%
Number of salaries quoted 505 876 1,885
10th Percentile £43,750 £45,000 £50,000
25th Percentile £57,500 £59,688 £60,000
Median annual salary (50th Percentile) £80,000 £75,000 £80,000
Median % change year-on-year +6.67% -6.25% +6.67%
75th Percentile £102,500 £95,000 £105,000
90th Percentile £130,000 £115,000 £122,500
England median annual salary £60,000 £55,000 £65,000
% change year-on-year +9.09% -15.38% +8.33%

All Operating Systems
London

Linux falls under the Operating Systems category. For comparison with the information above, the following table provides summary statistics for all permanent job vacancies requiring operating system skills in London.

Permanent vacancies with a requirement for operating system skills 1,795 3,139 5,603
As % of all permanent jobs advertised in London 13.96% 13.33% 15.55%
Number of salaries quoted 1,326 2,393 4,283
10th Percentile £33,375 £31,250 £32,500
25th Percentile £44,277 £41,250 £45,000
Median annual salary (50th Percentile) £65,000 £62,500 £65,000
Median % change year-on-year +4.00% -3.85% -
75th Percentile £88,750 £83,750 £90,000
90th Percentile £115,000 £102,500 £111,250
England median annual salary £46,500 £45,000 £52,500
% change year-on-year +3.33% -14.29% -

Linux
Job Vacancy Trend in London

Job postings citing Linux as a proportion of all IT jobs advertised in London.
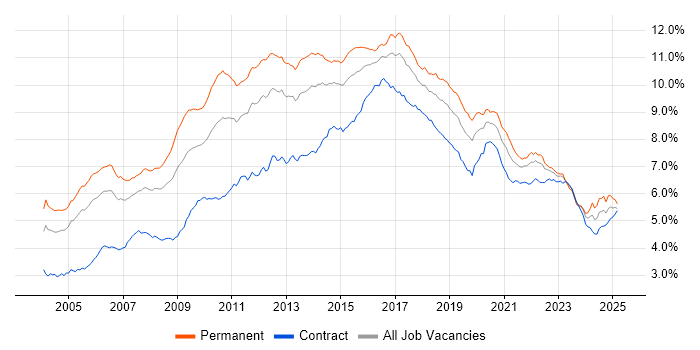
Job vacancy trend for Linux in London

Linux
Salary Trend in London

3-month moving average salary quoted in jobs citing Linux in London.

Salary trend for Linux in London

Linux
Salary Histogram in London

Salary distribution for jobs citing Linux in London over the 6 months to 26 April 2025.

Salary histogram for Linux in London

Linux
Job Locations in London

The table below looks at the demand and provides a guide to the median salaries quoted in IT jobs citing Linux within the London region over the 6 months to 26 April 2025. The 'Rank Change' column provides an indication of the change in demand within each location based on the same 6 month period last year.

Location Rank Change
on Same Period
Last Year
Matching
Permanent
IT Job Ads
Median Salary
Past 6 Months
Median Salary
% Change
on Same Period
Last Year
Live
Jobs
Central London +21 129 £65,000 -7.14% 32
West London +11 31 £45,750 -16.82% 11
East London 0 21 £75,000 +30.43% 5
South London -7 16 £60,000 +17.76% 6
Linux
England

Linux
Co-occurring Skills and Capabilities in London by Category

The follow tables expand on the table above by listing co-occurrences grouped by category. The same employment type, locality and period is covered with up to 20 co-occurrences shown in each of the following categories:

Application Platforms
1 52 (6.91%) Confluence
2 29 (3.85%) Microsoft Exchange
3 22 (2.92%) nginx
4 14 (1.86%) SharePoint
5 10 (1.33%) Apache
6 9 (1.20%) IIS
7 8 (1.06%) Tomcat
8 6 (0.80%) WordPress
9 3 (0.40%) Apache Airflow
9 3 (0.40%) Apache Spark
9 3 (0.40%) OpenStack
9 3 (0.40%) Oracle SOA Suite
9 3 (0.40%) WinCC
10 2 (0.27%) Apache Solr
10 2 (0.27%) CMS
10 2 (0.27%) Drupal
10 2 (0.27%) GemFire
11 1 (0.13%) Alfresco
11 1 (0.13%) Jetty
11 1 (0.13%) Oracle Workflow
Applications
1 29 (3.85%) Microsoft Excel
1 29 (3.85%) Microsoft Office
2 7 (0.93%) Chatbot
3 4 (0.53%) Microsoft Project
3 4 (0.53%) Mozilla Thunderbird
3 4 (0.53%) Photoshop
4 3 (0.40%) MS Visio
4 3 (0.40%) SOLIDWORKS
5 1 (0.13%) Adobe Creative Suite
5 1 (0.13%) InDesign
5 1 (0.13%) Microsoft PowerPoint
Business Applications
1 13 (1.73%) Fidessa
2 4 (0.53%) NEC Housing
3 3 (0.40%) Remedy ITSM
4 2 (0.27%) Refinitiv Enterprise Platform
5 1 (0.13%) Oracle Applications
5 1 (0.13%) Oracle EBS
5 1 (0.13%) SAP HCM
Cloud Services
1 246 (32.67%) AWS
2 200 (26.56%) Azure
3 64 (8.50%) GCP
4 48 (6.37%) Microsoft 365
5 46 (6.11%) GitHub
6 38 (5.05%) Amazon S3
7 37 (4.91%) SaaS
8 34 (4.52%) Entra ID
9 33 (4.38%) Serverless
10 31 (4.12%) Amazon EKS
11 30 (3.98%) Amazon EC2
12 29 (3.85%) Cloud Computing
13 28 (3.72%) AWS Lambda
14 24 (3.19%) Datadog
15 23 (3.05%) Pulumi
16 22 (2.92%) AWS CloudFormation
17 20 (2.66%) PaaS
18 18 (2.39%) Amazon ECS
19 17 (2.26%) Azure DevOps
19 17 (2.26%) GitHub Actions
Communications & Networking
1 95 (12.62%) Firewall
2 72 (9.56%) TCP/IP
3 53 (7.04%) DNS
4 33 (4.38%) DHCP
5 30 (3.98%) VPN
6 26 (3.45%) VLAN
7 19 (2.52%) Multicast
7 19 (2.52%) WAN
8 15 (1.99%) SAN
9 14 (1.86%) LAN
10 13 (1.73%) Network Security
10 13 (1.73%) SSL
11 9 (1.20%) FIX Connectivity
12 8 (1.06%) HTTP
12 8 (1.06%) Wi-Fi
13 7 (0.93%) Link 16
13 7 (0.93%) RS-232
13 7 (0.93%) RS-485
13 7 (0.93%) Tactical Data Link
13 7 (0.93%) Wireshark
Database & Business Intelligence
1 62 (8.23%) SQL Server
2 43 (5.71%) PostgreSQL
3 36 (4.78%) Relational Database
4 30 (3.98%) Elasticsearch
4 30 (3.98%) MySQL
5 26 (3.45%) MongoDB
6 16 (2.12%) Oracle Reports
7 14 (1.86%) NoSQL
8 13 (1.73%) Amazon RDS
9 6 (0.80%) Redis
10 5 (0.66%) Tick Data
11 4 (0.53%) BusinessObjects
11 4 (0.53%) Hadoop
11 4 (0.53%) HBase
12 2 (0.27%) DB2
12 2 (0.27%) KDB
12 2 (0.27%) QlikView
12 2 (0.27%) SQL Server Integration Services
12 2 (0.27%) SQL Server Reporting Services
12 2 (0.27%) Tableau
Development Applications
1 99 (13.15%) Git
2 87 (11.55%) Jenkins
3 67 (8.90%) JIRA
4 43 (5.71%) Maven
5 31 (4.12%) GitLab
6 29 (3.85%) Sonatype Nexus
7 27 (3.59%) TeamCity
8 25 (3.32%) SonarQube
9 22 (2.92%) Ant
9 22 (2.92%) JUnit
10 16 (2.12%) Cucumber
10 16 (2.12%) IntelliJ
10 16 (2.12%) Mockito
11 9 (1.20%) Artifactory
11 9 (1.20%) Gradle
12 7 (0.93%) Bitbucket
12 7 (0.93%) Burp Suite
13 4 (0.53%) Atlassian Bamboo
13 4 (0.53%) Bitbucket Server
14 3 (0.40%) webpack
General
1 281 (37.32%) Finance
2 175 (23.24%) Social Skills
3 122 (16.20%) Banking
4 78 (10.36%) Analytical Skills
5 52 (6.91%) Front Office
6 36 (4.78%) Investment Banking
7 29 (3.85%) Inclusion and Diversity
8 26 (3.45%) Games
9 23 (3.05%) Telecoms
10 22 (2.92%) Back Office
11 15 (1.99%) Legal
11 15 (1.99%) Presentation Skills
12 12 (1.59%) Financial Institution
12 12 (1.59%) Law
13 8 (1.06%) Military
14 7 (0.93%) Organisational Skills
14 7 (0.93%) Police
14 7 (0.93%) Public Sector
15 5 (0.66%) Local Government
15 5 (0.66%) Manufacturing
Job Titles
1 180 (23.90%) Senior
2 167 (22.18%) Developer
3 76 (10.09%) C++ Developer
4 72 (9.56%) Analyst
5 70 (9.30%) Cloud Engineer
5 70 (9.30%) Software Engineer
6 68 (9.03%) Senior Developer
7 65 (8.63%) Lead
8 52 (6.91%) Linux Engineer
9 50 (6.64%) Infrastructure Engineer
10 45 (5.98%) DevOps Engineer
10 45 (5.98%) Platform Engineer
11 42 (5.58%) Senior C++ Developer
12 41 (5.44%) Support Engineer
13 40 (5.31%) Cloud Native Engineer
13 40 (5.31%) Cloud Software Engineer
13 40 (5.31%) Support Analyst
14 38 (5.05%) C++ Quantitative Developer
14 38 (5.05%) Quantitative Developer
15 37 (4.91%) Senior Software Engineer
Libraries, Frameworks & Software Standards
1 39 (5.18%) FIX Protocol
2 37 (4.91%) Node.js
3 23 (3.05%) Boost C++ Libraries
3 23 (3.05%) REST
4 21 (2.79%) .NET
4 21 (2.79%) Pandas
4 21 (2.79%) React
5 20 (2.66%) Spring
6 18 (2.39%) Spring Boot
7 17 (2.26%) Middleware
8 16 (2.12%) HTML
9 15 (1.99%) Django
9 15 (1.99%) Elastic Stack
9 15 (1.99%) JMS
10 14 (1.86%) ActiveMQ
10 14 (1.86%) CSS
11 13 (1.73%) Kafka
12 12 (1.59%) RESTful
13 11 (1.46%) GraphQL
14 10 (1.33%) pytest
Miscellaneous
1 95 (12.62%) Management Information System
2 67 (8.90%) Distributed Systems
3 65 (8.63%) Equities
4 62 (8.23%) Hedge funds
5 55 (7.30%) Data Centre
6 52 (6.91%) Cloud Native
7 45 (5.98%) Algorithms
8 41 (5.44%) Public Cloud
9 40 (5.31%) Legacy Code
10 27 (3.59%) Derivative
11 25 (3.32%) Clustering
11 25 (3.32%) Foreign Exchange (FX)
12 24 (3.19%) Data Structures
12 24 (3.19%) Linux Command Line
13 23 (3.05%) Onboarding
14 22 (2.92%) Hybrid Cloud
15 20 (2.66%) Cyber Threat
15 20 (2.66%) FPGA
16 17 (2.26%) Enterprise Software
16 17 (2.26%) Fixed Income
Operating Systems
1 269 (35.72%) Windows
2 106 (14.08%) Unix
3 90 (11.95%) Windows Server
4 63 (8.37%) Red Hat Enterprise Linux
5 35 (4.65%) Ubuntu
6 29 (3.85%) CentOS
7 28 (3.72%) Android
7 28 (3.72%) Mac OS
8 19 (2.52%) Windows 10
9 18 (2.39%) Debian
10 15 (1.99%) Windows Server 2016
11 14 (1.86%) Solaris
12 13 (1.73%) AIX
13 11 (1.46%) Apple iOS
13 11 (1.46%) Rocky
14 10 (1.33%) Windows Server 2019
15 7 (0.93%) zOS
16 6 (0.80%) VMS
17 4 (0.53%) Windows Server 2012
18 3 (0.40%) Mac OS X
Processes & Methodologies
1 189 (25.10%) DevOps
2 164 (21.78%) CI/CD
3 125 (16.60%) Agile
4 121 (16.07%) Problem-Solving
5 118 (15.67%) Low Latency
6 114 (15.14%) Software Engineering
7 99 (13.15%) Computer Science
8 97 (12.88%) Infrastructure as Code
9 80 (10.62%) ITIL
10 76 (10.09%) Infrastructure Engineering
11 61 (8.10%) Deployment Automation
11 61 (8.10%) Disaster Recovery
12 59 (7.84%) Platform Engineering
13 57 (7.57%) Fintech
14 51 (6.77%) Containerisation
15 49 (6.51%) Cybersecurity
16 46 (6.11%) Change Management
16 46 (6.11%) Continuous Integration
17 45 (5.98%) Test Automation
18 44 (5.84%) Analytics
Programming Languages
1 309 (41.04%) Python
2 186 (24.70%) C++
3 168 (22.31%) SQL
4 108 (14.34%) Bash
4 108 (14.34%) Java
5 105 (13.94%) PowerShell
6 95 (12.62%) JavaScript
7 87 (11.55%) C
8 86 (11.42%) Go
9 64 (8.50%) Rust
10 34 (4.52%) Shell Script
11 28 (3.72%) TypeScript
12 24 (3.19%) Bicep
13 22 (2.92%) Perl
13 22 (2.92%) T-SQL
14 15 (1.99%) Kotlin
14 15 (1.99%) Ruby
15 13 (1.73%) C#
16 12 (1.59%) Objective-C
17 11 (1.46%) R
Qualifications
1 114 (15.14%) Degree
2 50 (6.64%) Computer Science Degree
3 47 (6.24%) Security Cleared
4 30 (3.98%) Cisco Certification
5 23 (3.05%) DV Cleared
6 22 (2.92%) AWS Certification
7 17 (2.26%) SC Cleared
8 16 (2.12%) CCNP
9 13 (1.73%) ITIL Certification
10 12 (1.59%) CompTIA Security+
10 12 (1.59%) GCIH
11 11 (1.46%) CCNA
11 11 (1.46%) Microsoft Certification
12 10 (1.33%) CISSP
13 9 (1.20%) GSEC
14 8 (1.06%) AWS Certified Solutions Architect
14 8 (1.06%) GCIA
14 8 (1.06%) IBM AIX Certification
14 8 (1.06%) OSCP
15 7 (0.93%) SSCP
Quality Assurance & Compliance
1 37 (4.91%) QA
2 35 (4.65%) SLA
3 17 (2.26%) GDPR
4 10 (1.33%) ISO/IEC 27001
4 10 (1.33%) Sarbanes-Oxley
5 7 (0.93%) MIL-STD-1553
5 7 (0.93%) SOC 2
6 6 (0.80%) NIST
7 5 (0.66%) FINRA
7 5 (0.66%) ISO 9001
7 5 (0.66%) PMO
8 4 (0.53%) Accessibility
9 3 (0.40%) Data Quality
9 3 (0.40%) HIPAA
10 1 (0.13%) COBIT
10 1 (0.13%) Cyber Essentials
10 1 (0.13%) ISO 15022
10 1 (0.13%) ISO 20022
10 1 (0.13%) MiFID
10 1 (0.13%) NIST 800
System Software
1 122 (16.20%) Docker
2 93 (12.35%) Active Directory
3 91 (12.08%) VMware Infrastructure
4 29 (3.85%) Hyper-V
4 29 (3.85%) VMware ESXi
5 19 (2.52%) Virtual Desktop
6 14 (1.86%) Virtual Machines
7 12 (1.59%) vSphere
8 6 (0.80%) Veritas Cluster Server
9 4 (0.53%) pfSense
9 4 (0.53%) Virtual Servers
10 3 (0.40%) Firmware
10 3 (0.40%) Samba
10 3 (0.40%) VirtualBox
11 2 (0.27%) Postfix
11 2 (0.27%) VMware NSX
12 1 (0.13%) Apache ZooKeeper
12 1 (0.13%) GPFS
12 1 (0.13%) HDFS
12 1 (0.13%) KVM
Systems Management
1 161 (21.38%) Ansible
2 157 (20.85%) Kubernetes
3 135 (17.93%) Terraform
4 40 (5.31%) Puppet
5 31 (4.12%) Progress Chef
6 30 (3.98%) Grafana
7 27 (3.59%) Microsoft Intune
7 27 (3.59%) Prometheus
8 25 (3.32%) SCCM
9 21 (2.79%) Nagios
10 20 (2.66%) Podman
11 12 (1.59%) Single Sign-On
12 11 (1.46%) Active Directory Federation Services
13 8 (1.06%) Red Hat Satellite
14 7 (0.93%) Nessus
14 7 (0.93%) Proxmox
14 7 (0.93%) vCenter Server
15 6 (0.80%) Graylog
15 6 (0.80%) Jamf Pro
15 6 (0.80%) Packer
Vendors
1 139 (18.46%) VMware
2 123 (16.33%) Microsoft
3 73 (9.69%) Red Hat
4 60 (7.97%) Oracle
5 56 (7.44%) Cisco
6 39 (5.18%) Citrix
7 27 (3.59%) IBM
8 19 (2.52%) Google
8 19 (2.52%) Splunk
9 18 (2.39%) ServiceNow
10 16 (2.12%) Veeam
11 15 (1.99%) Apple
11 15 (1.99%) Bloomberg
11 15 (1.99%) NetApp
12 14 (1.86%) Palo Alto
13 12 (1.59%) Dell
13 12 (1.59%) Meraki
13 12 (1.59%) Reuters
14 11 (1.46%) SolarWinds
15 10 (1.33%) Trayport