Business Analysis Jobs in the City of London

Business Analysis
Central London > City of London

The following table provides summary statistics for permanent job vacancies advertised in the City of London with a requirement for Business Analysis skills. Included is a benchmarking guide to the salaries offered in vacancies that have cited Business Analysis over the 6 months to 28 April 2024 with a comparison to the same period in the previous 2 years.

6 months to
28 Apr 2024
Same period 2023 Same period 2022
Rank 116 135 72
Rank change year-on-year +19 -63 +51
Permanent jobs citing Business Analysis 63 105 297
As % of all permanent jobs advertised in the City of London 1.88% 2.21% 4.21%
As % of the Processes & Methodologies category 2.03% 2.33% 4.41%
Number of salaries quoted 46 82 261
10th Percentile £44,375 £47,500 £52,500
25th Percentile £51,794 £56,500 £60,000
Median annual salary (50th Percentile) £70,000 £76,000 £70,000
Median % change year-on-year -7.89% +8.57% +12.00%
75th Percentile £92,500 £92,500 £83,750
90th Percentile £97,500 £93,750 £92,500
Central London median annual salary £70,000 £75,000 £70,000
% change year-on-year -6.67% +7.14% +16.67%

All Process and Methodology Skills
City of London

Business Analysis is in the Processes and Methodologies category. The following table is for comparison with the above and provides summary statistics for all permanent job vacancies advertised in the City of London with a requirement for process or methodology skills.

Permanent vacancies with a requirement for process or methodology skills 3,103 4,512 6,733
As % of all permanent jobs advertised in the City of London 92.38% 95.13% 95.37%
Number of salaries quoted 2,472 3,784 5,617
10th Percentile £41,250 £43,750 £45,500
25th Percentile £55,000 £56,250 £57,500
Median annual salary (50th Percentile) £75,000 £75,000 £72,500
Median % change year-on-year - +3.45% -
75th Percentile £95,000 £97,500 £93,750
90th Percentile £112,500 £112,500 £110,000
Central London median annual salary £72,500 £75,000 £72,500
% change year-on-year -3.33% +3.45% +3.57%

Business Analysis
Job Vacancy Trend in the City of London

Job postings citing Business Analysis as a proportion of all IT jobs advertised in the City of London.
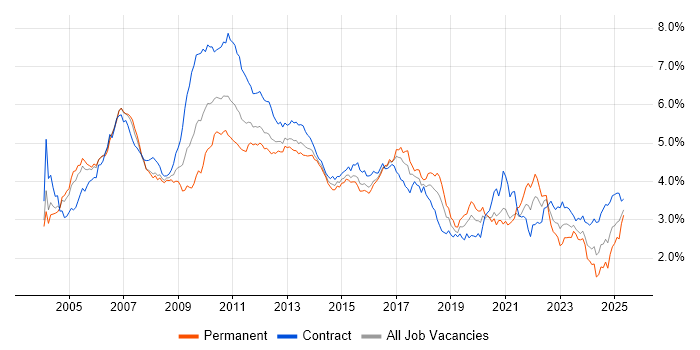
Job vacancy trend for Business Analysis in the City of London

Business Analysis
Salary Trend in the City of London

3-month moving average salary quoted in jobs citing Business Analysis in the City of London.

Salary trend for Business Analysis in the City of London

Business Analysis
Salary Histogram in the City of London

Salary distribution for jobs citing Business Analysis in the City of London over the 6 months to 28 April 2024.

Salary histogram for Business Analysis in the City of London

Business Analysis
Co-occurring Skills and Capabilities in the City of London by Category

The follow tables expand on the table above by listing co-occurrences grouped by category. The same employment type, locality and period is covered with up to 20 co-occurrences shown in each of the following categories:

Application Platforms
1 3 (4.76%) SharePoint
2 2 (3.17%) Confluence
2 2 (3.17%) Moodle
3 1 (1.59%) Anypoint
Applications
1 8 (12.70%) Microsoft Office
2 5 (7.94%) MS Visio
3 3 (4.76%) Microsoft Excel
4 1 (1.59%) Microsoft PowerPoint
Business Applications
1 3 (4.76%) Dynamics CRM
2 1 (1.59%) Oracle ERP
Cloud Services
1 7 (11.11%) Power Platform
2 5 (7.94%) Microsoft 365
3 4 (6.35%) Azure
4 3 (4.76%) Azure DevOps
4 3 (4.76%) Dynamics 365
4 3 (4.76%) Power Automate
4 3 (4.76%) PowerApps
5 2 (3.17%) Azure App Service
5 2 (3.17%) Azure Logic Apps
5 2 (3.17%) Miro
6 1 (1.59%) AWS
6 1 (1.59%) Azure Data Factory
6 1 (1.59%) Salesforce Sales Cloud
6 1 (1.59%) Salesforce Service Cloud
6 1 (1.59%) WhatsApp
Communications & Networking
1 1 (1.59%) Wireless
1 1 (1.59%) Wireless Security
Database & Business Intelligence
1 7 (11.11%) Power BI
2 2 (3.17%) SAP HANA
2 2 (3.17%) SQL Server
3 1 (1.59%) Data Warehouse
3 1 (1.59%) OLAP
3 1 (1.59%) OLAP Cube
3 1 (1.59%) Relational Database
Development Applications
1 5 (7.94%) JIRA
General
1 16 (25.40%) Social Skills
2 13 (20.63%) Finance
3 10 (15.87%) Analytical Skills
4 6 (9.52%) Legal
5 4 (6.35%) Banking
5 4 (6.35%) Organisational Skills
6 3 (4.76%) Inclusion and Diversity
6 3 (4.76%) Law
6 3 (4.76%) Marketing
6 3 (4.76%) Public Sector
6 3 (4.76%) Retail
7 2 (3.17%) Pharmaceutical
7 2 (3.17%) Police
7 2 (3.17%) Presentation Skills
8 1 (1.59%) Financial Institution
8 1 (1.59%) Influencing Skills
8 1 (1.59%) Local Government
8 1 (1.59%) Retail Banking
Job Titles
1 29 (46.03%) Analyst
2 25 (39.68%) Business Analyst
3 9 (14.29%) Senior
4 8 (12.70%) Consultant
5 6 (9.52%) Senior Analyst
5 6 (9.52%) Senior Business Analyst
6 5 (7.94%) Lead
7 4 (6.35%) Developer
7 4 (6.35%) Product Owner
8 3 (4.76%) Administrator
8 3 (4.76%) Architect
8 3 (4.76%) Change Analyst
8 3 (4.76%) Salesforce Analyst
8 3 (4.76%) Salesforce Business Analyst
8 3 (4.76%) Systems Administrator
8 3 (4.76%) Systems Analyst
9 2 (3.17%) Business IT Analyst
9 2 (3.17%) Functional Consultant
9 2 (3.17%) Relationships Manager
9 2 (3.17%) Systems Developer
Libraries, Frameworks & Software Standards
1 3 (4.76%) .NET
1 3 (4.76%) ASP.NET
2 2 (3.17%) ASP.NET MVC
2 2 (3.17%) CSS
2 2 (3.17%) HTML
2 2 (3.17%) REST
2 2 (3.17%) SPFx
2 2 (3.17%) XML
3 1 (1.59%) AngularJS
3 1 (1.59%) ASP.NET Web API
3 1 (1.59%) JSON
3 1 (1.59%) Vue
Miscellaneous
1 5 (7.94%) Management Information System
1 5 (7.94%) Product Ownership
2 2 (3.17%) Enterprise Software
2 2 (3.17%) Learning Management System
2 2 (3.17%) Reinsurance
3 1 (1.59%) Data Centre
3 1 (1.59%) IoT
3 1 (1.59%) Pricing Data
Processes & Methodologies
1 31 (49.21%) Agile
2 16 (25.40%) Requirements Gathering
3 13 (20.63%) User Stories
4 10 (15.87%) Problem-Solving
5 9 (14.29%) Acceptance Criteria
5 9 (14.29%) Insurtech
5 9 (14.29%) Stakeholder Management
6 7 (11.11%) Actionable Insight
6 7 (11.11%) Project Management
6 7 (11.11%) Scrum
6 7 (11.11%) Workshop Facilitation
7 6 (9.52%) Data Analysis
7 6 (9.52%) Data Modelling
7 6 (9.52%) Electronic Trading
7 6 (9.52%) Migration
7 6 (9.52%) Process Improvement
7 6 (9.52%) Roadmaps
7 6 (9.52%) Use Case
8 5 (7.94%) End-to-End Testing
8 5 (7.94%) Impact Analysis
Programming Languages
1 6 (9.52%) SQL
2 2 (3.17%) C#
2 2 (3.17%) JavaScript
3 1 (1.59%) Python
3 1 (1.59%) T-SQL
Qualifications
1 13 (20.63%) Degree
2 7 (11.11%) Security Cleared
3 6 (9.52%) SC Cleared
4 3 (4.76%) Computer Science Degree
4 3 (4.76%) PMI Certification
4 3 (4.76%) PMP
5 2 (3.17%) ISO 27001 Lead Auditor
6 1 (1.59%) (ISC)2 CCSP
6 1 (1.59%) AWS Certification
6 1 (1.59%) AWS Certified Solutions Architect
6 1 (1.59%) CCNA
6 1 (1.59%) CCSP
6 1 (1.59%) Cisco Certification
6 1 (1.59%) CISM
6 1 (1.59%) CISSP
6 1 (1.59%) CRISC
6 1 (1.59%) CWNA
6 1 (1.59%) CWSP
6 1 (1.59%) ISEB
Quality Assurance & Compliance
1 3 (4.76%) ISO/IEC 27001
2 2 (3.17%) ISO 9001
2 2 (3.17%) QA
3 1 (1.59%) ISO 31000
3 1 (1.59%) PMO
Vendors
1 14 (22.22%) Salesforce
2 8 (12.70%) Microsoft
3 2 (3.17%) PeopleSoft
3 2 (3.17%) SAP
4 1 (1.59%) MuleSoft
4 1 (1.59%) Oracle