IT Strategy Jobs in the City of London

IT/Technology Strategy
Central London > City of London

The table below provides summary statistics for permanent job vacancies advertised in the City of London requiring IT Strategy skills. It includes a benchmarking guide to the annual salaries offered in vacancies that cited IT Strategy over the 6 months leading up to 27 May 2025, comparing them to the same period in the previous two years.

6 months to
27 May 2025
Same period 2024 Same period 2023
Rank 97 110 119
Rank change year-on-year +13 +9 +67
Permanent jobs citing IT Strategy 43 66 112
As % of all permanent jobs advertised in the City of London 2.25% 1.98% 2.46%
As % of the Processes & Methodologies category 2.34% 2.15% 2.58%
Number of salaries quoted 36 47 75
10th Percentile £53,750 £46,250 £63,000
25th Percentile £57,500 £58,750 £77,500
Median annual salary (50th Percentile) £86,250 £72,500 £92,500
Median % change year-on-year +18.97% -21.62% -
75th Percentile £120,938 £115,000 £110,000
90th Percentile £131,250 £140,000 £117,500
Central London median annual salary £86,250 £90,000 £93,750
% change year-on-year -4.17% -4.00% +4.17%

All Process and Methodology Skills
City of London

IT Strategy falls under the Processes and Methodologies category. For comparison with the information above, the following table provides summary statistics for all permanent job vacancies requiring process or methodology skills in the City of London.

Permanent vacancies with a requirement for process or methodology skills 1,837 3,064 4,336
As % of all permanent jobs advertised in the City of London 96.23% 91.74% 95.19%
Number of salaries quoted 1,378 2,398 3,612
10th Percentile £41,925 £41,250 £42,775
25th Percentile £53,750 £55,000 £56,250
Median annual salary (50th Percentile) £75,000 £75,000 £75,000
Median % change year-on-year - - +3.45%
75th Percentile £97,500 £95,000 £98,750
90th Percentile £122,500 £112,500 £115,000
Central London median annual salary £75,000 £72,500 £75,000
% change year-on-year +3.45% -3.33% +3.45%

IT Strategy
Job Vacancy Trend in the City of London

Job postings citing IT Strategy as a proportion of all IT jobs advertised in the City of London.
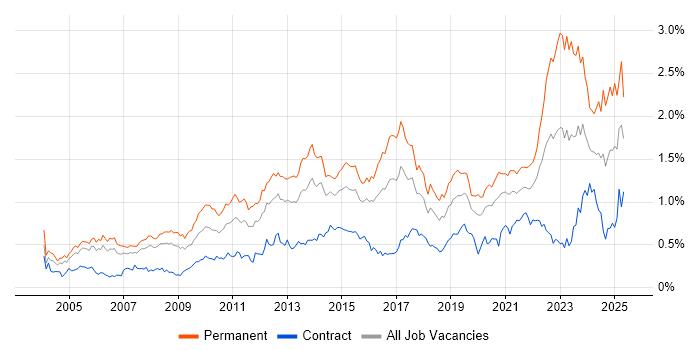
Job vacancy trend for IT Strategy in the City of London

IT Strategy
Salary Trend in the City of London

3-month moving average salary quoted in jobs citing IT Strategy in the City of London.

Salary trend for IT Strategy in the City of London

IT Strategy
Salary Histogram in the City of London

Salary distribution for jobs citing IT Strategy in the City of London over the 6 months to 27 May 2025.

Salary histogram for IT Strategy in the City of London

IT Strategy
Co-occurring Skills and Capabilities in the City of London by Category

The follow tables expand on the table above by listing co-occurrences grouped by category. The same employment type, locality and period is covered with up to 20 co-occurrences shown in each of the following categories:

Application Platforms
1 4 (9.30%) Microsoft Exchange
2 2 (4.65%) SAS
3 1 (2.33%) Drupal
3 1 (2.33%) Moodle
Applications
1 3 (6.98%) Microsoft Office
2 2 (4.65%) Adobe XD
2 2 (4.65%) Sketch
Business Applications
1 4 (9.30%) Endur
2 1 (2.33%) Adaptiv
2 1 (2.33%) Carpe Diem
2 1 (2.33%) Dynamics CRM
2 1 (2.33%) Elite 3E
2 1 (2.33%) Fidessa
Cloud Services
1 13 (30.23%) Azure
2 7 (16.28%) Microsoft 365
3 5 (11.63%) Power Platform
3 5 (11.63%) SaaS
4 2 (4.65%) Figma
5 1 (2.33%) AWS
5 1 (2.33%) Azure DevOps
5 1 (2.33%) GitHub
5 1 (2.33%) Google Analytics
5 1 (2.33%) Serverless
Communications & Networking
1 2 (4.65%) Firewall
2 1 (2.33%) NetScaler
2 1 (2.33%) Network Security
2 1 (2.33%) VPN
Database & Business Intelligence
1 8 (18.60%) SQL Server
2 5 (11.63%) Power BI
3 4 (9.30%) RDBMS
3 4 (9.30%) Relational Database
4 3 (6.98%) Data Warehouse
5 2 (4.65%) Data Lake
5 2 (4.65%) Data Mining
5 2 (4.65%) PostgreSQL
5 2 (4.65%) SQL Server Analysis Services
5 2 (4.65%) SQL Server Integration Services
5 2 (4.65%) SQL Server Reporting Services
Development Applications
1 2 (4.65%) Atlassian Bamboo
1 2 (4.65%) Bitbucket
1 2 (4.65%) JIRA
General
1 22 (51.16%) Finance
2 18 (41.86%) Social Skills
3 5 (11.63%) Banking
4 4 (9.30%) Analytical Skills
4 4 (9.30%) Legal
4 4 (9.30%) Organisational Skills
5 2 (4.65%) Inclusion and Diversity
5 2 (4.65%) Local Government
5 2 (4.65%) Public Sector
6 1 (2.33%) Electronics
6 1 (2.33%) Marketing
Job Titles
1 8 (18.60%) Analyst
1 8 (18.60%) Lead
2 6 (13.95%) Architect
3 5 (11.63%) Head of IT
4 4 (9.30%) Business Systems Analyst
4 4 (9.30%) ETRM Manager
4 4 (9.30%) Senior
4 4 (9.30%) Systems Analyst
5 3 (6.98%) Data Analyst
5 3 (6.98%) Data Architect
5 3 (6.98%) Governance Analyst
5 3 (6.98%) IT Manager
6 2 (4.65%) Client Relationship Manager
6 2 (4.65%) Head of Service Delivery
6 2 (4.65%) IT Relationships Manager
6 2 (4.65%) Lead Architect
6 2 (4.65%) Lead Solutions Architect
6 2 (4.65%) Relationships Manager
6 2 (4.65%) Senior Architect
6 2 (4.65%) Senior Data Architect
Libraries, Frameworks & Software Standards
1 2 (4.65%) .NET
1 2 (4.65%) Middleware
1 2 (4.65%) React
1 2 (4.65%) Spring
1 2 (4.65%) Spring Batch
1 2 (4.65%) Spring Boot
Miscellaneous
1 4 (9.30%) Swaptions
2 3 (6.98%) Management Information System
2 3 (6.98%) Public Cloud
3 2 (4.65%) Cloud Native
3 2 (4.65%) Data Structures
3 2 (4.65%) Onboarding
3 2 (4.65%) Product Ownership
3 2 (4.65%) Reference Data
3 2 (4.65%) Tandem
3 2 (4.65%) Virtual Team
4 1 (2.33%) Credit Risk
4 1 (2.33%) Data Centre
4 1 (2.33%) Foreign Exchange (FX)
4 1 (2.33%) Learning Management System
4 1 (2.33%) Market Risk
4 1 (2.33%) Marketing Technology
4 1 (2.33%) PropTech
Operating Systems
1 3 (6.98%) Windows
2 1 (2.33%) Linux
2 1 (2.33%) Windows Server
2 1 (2.33%) Windows Server 2016
Processes & Methodologies
1 24 (55.81%) Technology Strategy
2 17 (39.53%) Agile
3 13 (30.23%) Roadmaps
4 11 (25.58%) Analytics
4 11 (25.58%) Project Management
5 10 (23.26%) Decision-Making
6 8 (18.60%) Business Analysis
6 8 (18.60%) Data Modelling
6 8 (18.60%) DevOps
6 8 (18.60%) ITIL
7 7 (16.28%) Business Strategy
7 7 (16.28%) Risk Management
7 7 (16.28%) Service Delivery
8 6 (13.95%) Migration
8 6 (13.95%) Problem-Solving
8 6 (13.95%) Service Management
8 6 (13.95%) Workshop Facilitation
9 5 (11.63%) Cost Management
9 5 (11.63%) Data Governance
9 5 (11.63%) Project Delivery
Programming Languages
1 8 (18.60%) Java
2 4 (9.30%) VB
3 3 (6.98%) JavaScript
3 3 (6.98%) SQL
4 2 (4.65%) PowerShell
4 2 (4.65%) TypeScript
5 1 (2.33%) C#
5 1 (2.33%) Python
Qualifications
1 6 (13.95%) Degree
2 2 (4.65%) CFA
2 2 (4.65%) ITIL Certification
2 2 (4.65%) PMI Certification
2 2 (4.65%) PMP
Quality Assurance & Compliance
1 5 (11.63%) Data Quality
2 1 (2.33%) GDPR
2 1 (2.33%) QA
System Software
1 2 (4.65%) VMware Infrastructure
2 1 (2.33%) Active Directory
2 1 (2.33%) Hyper-V
2 1 (2.33%) VMware ESXi
Systems Management
1 1 (2.33%) Kubernetes
1 1 (2.33%) Microsoft Intune
1 1 (2.33%) SCCM
1 1 (2.33%) Single Sign-On
1 1 (2.33%) Terraform
1 1 (2.33%) vCenter Server
Vendors
1 9 (20.93%) Microsoft
2 6 (13.95%) ServiceNow
3 4 (9.30%) OpenLink
3 4 (9.30%) Oracle
3 4 (9.30%) Sybase
3 4 (9.30%) TIBCO
4 3 (6.98%) Duck Creek
5 2 (4.65%) Adobe
5 2 (4.65%) Informatica
5 2 (4.65%) Murex
5 2 (4.65%) Teradata
5 2 (4.65%) VMware
6 1 (2.33%) Bloomberg
6 1 (2.33%) Cisco
6 1 (2.33%) Citrix
6 1 (2.33%) Fortinet
6 1 (2.33%) Google
6 1 (2.33%) Mitel
6 1 (2.33%) NetApp
6 1 (2.33%) Veeam