DevOps Jobs in Glasgow

DevOps
Scotland > Glasgow

The following table provides summary statistics for permanent job vacancies advertised in Glasgow with a requirement for DevOps skills. Included is a benchmarking guide to the salaries offered in vacancies that have cited DevOps over the 6 months to 16 May 2024 with a comparison to the same period in the previous 2 years.

6 months to
16 May 2024
Same period 2023 Same period 2022
Rank 74 12 18
Rank change year-on-year -62 +6 -2
Permanent jobs citing DevOps 258 216 187
As % of all permanent jobs advertised in Glasgow 6.46% 13.94% 11.65%
As % of the Processes & Methodologies category 6.69% 14.50% 12.38%
Number of salaries quoted 69 81 91
10th Percentile £46,250 £41,250 £36,750
25th Percentile £47,500 £47,500 £42,500
Median annual salary (50th Percentile) £70,000 £57,500 £52,500
Median % change year-on-year +21.74% +9.52% +7.69%
75th Percentile £80,000 £67,500 £68,125
90th Percentile £93,250 £73,875 £75,000
Scotland median annual salary £69,000 £65,000 £59,500
% change year-on-year +6.15% +9.24% +19.00%

All Process and Methodology Skills
Glasgow

DevOps is in the Processes and Methodologies category. The following table is for comparison with the above and provides summary statistics for all permanent job vacancies advertised in Glasgow with a requirement for process or methodology skills.

Permanent vacancies with a requirement for process or methodology skills 3,854 1,490 1,511
As % of all permanent jobs advertised in Glasgow 96.57% 96.19% 94.14%
Number of salaries quoted 825 639 820
10th Percentile £31,750 £32,500 £29,000
25th Percentile £41,250 £41,500 £37,500
Median annual salary (50th Percentile) £54,000 £55,000 £49,861
Median % change year-on-year -1.82% +10.31% +4.97%
75th Percentile £65,000 £69,818 £63,750
90th Percentile £78,750 £77,500 £75,000
Scotland median annual salary £52,500 £57,500 £55,000
% change year-on-year -8.70% +4.55% +11.68%

DevOps
Job Vacancy Trend in Glasgow

Job postings citing DevOps as a proportion of all IT jobs advertised in Glasgow.
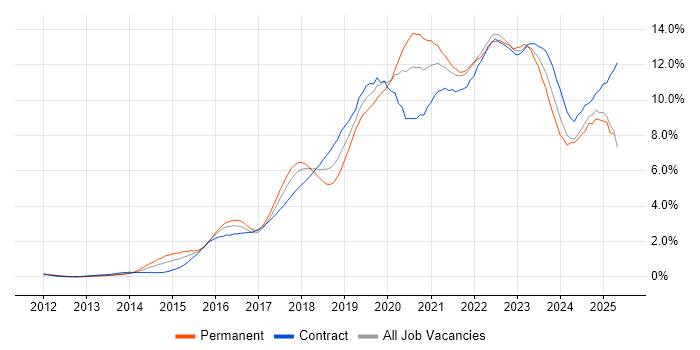
Job vacancy trend for DevOps in Glasgow

DevOps
Salary Trend in Glasgow

3-month moving average salary quoted in jobs citing DevOps in Glasgow.

Salary trend for DevOps in Glasgow

DevOps
Salary Histogram in Glasgow

Salary distribution for jobs citing DevOps in Glasgow over the 6 months to 16 May 2024.

Salary histogram for DevOps in Glasgow

DevOps
Co-occurring Skills and Capabilities in Glasgow by Category

The follow tables expand on the table above by listing co-occurrences grouped by category. The same employment type, locality and period is covered with up to 20 co-occurrences shown in each of the following categories:

Application Platforms
1 30 (11.63%) ArcGIS
1 30 (11.63%) GeoServer
2 17 (6.59%) Confluence
3 15 (5.81%) Cloud Foundry
4 5 (1.94%) Tomcat
4 5 (1.94%) Umbraco
4 5 (1.94%) WebSphere
4 5 (1.94%) WordPress
5 1 (0.39%) Apache Spark
5 1 (0.39%) IIS
5 1 (0.39%) SAS
5 1 (0.39%) SharePoint
Applications
1 32 (12.40%) UserZoom
2 12 (4.65%) Sketch
3 4 (1.55%) Microsoft Excel
Business Applications
1 1 (0.39%) Dynamics CRM
Cloud Services
1 101 (39.15%) AWS
2 88 (34.11%) Azure
3 44 (17.05%) Figma
4 32 (12.40%) SurveyMonkey
5 23 (8.91%) GCP
6 22 (8.53%) IaaS
6 22 (8.53%) PaaS
7 16 (6.20%) Azure DevOps
8 15 (5.81%) BlazeMeter
9 10 (3.88%) Power Platform
10 9 (3.49%) Microsoft 365
10 9 (3.49%) SaaS
11 5 (1.94%) Cloud Computing
11 5 (1.94%) Entra ID
12 4 (1.55%) Azure AKS
12 4 (1.55%) Azure Data Factory
13 3 (1.16%) Azure API Management
13 3 (1.16%) Serverless
14 2 (0.78%) OpenShift
15 1 (0.39%) AWS CloudFormation
Communications & Networking
1 18 (6.98%) Firewall
2 17 (6.59%) SD-WAN
3 14 (5.43%) VPN
4 13 (5.04%) WAN
5 6 (2.33%) Network Security
6 1 (0.39%) Internet
6 1 (0.39%) Wireless
Database & Business Intelligence
1 37 (14.34%) NoSQL
2 31 (12.02%) MongoDB
2 31 (12.02%) PostgreSQL
3 30 (11.63%) GIS
3 30 (11.63%) QGIS
4 25 (9.69%) Relational Database
5 23 (8.91%) Looker
5 23 (8.91%) SQL Server
6 15 (5.81%) Apache Cassandra
6 15 (5.81%) Elasticsearch
7 8 (3.10%) Big Data
8 7 (2.71%) Power BI
9 6 (2.33%) Data Warehouse
10 5 (1.94%) MySQL
10 5 (1.94%) Pentaho
11 4 (1.55%) Azure SQL Database
11 4 (1.55%) Geospatial Data
11 4 (1.55%) RDBMS
11 4 (1.55%) SQL Server Integration Services
12 3 (1.16%) Oracle Database
Development Applications
1 34 (13.18%) Jenkins
1 34 (13.18%) JIRA
2 15 (5.81%) Cucumber
2 15 (5.81%) Cypress.io
2 15 (5.81%) JUnit
3 5 (1.94%) Bitbucket
4 3 (1.16%) Git
4 3 (1.16%) JDeveloper
5 2 (0.78%) Maven
6 1 (0.39%) GitLab
6 1 (0.39%) Jasmine
6 1 (0.39%) Karma Test Runner
6 1 (0.39%) Team Foundation Server
General
1 135 (52.33%) Finance
2 124 (48.06%) Inclusion and Diversity
2 124 (48.06%) Law
3 80 (31.01%) Marketing
4 71 (27.52%) Social Skills
5 33 (12.79%) Banking
6 18 (6.98%) Private Banking
7 15 (5.81%) Investment Banking
8 9 (3.49%) Analytical Skills
8 9 (3.49%) Legal
9 8 (3.10%) Presentation Skills
10 4 (1.55%) Advertising
10 4 (1.55%) Games
11 2 (0.78%) Public Sector
Job Titles
1 96 (37.21%) Software Engineer
2 76 (29.46%) Lead
3 41 (15.89%) Senior
4 35 (13.57%) Lead Software Engineer
5 32 (12.40%) Java Engineer
5 32 (12.40%) User Experience Researcher
6 30 (11.63%) Java Software Engineer
7 28 (10.85%) Developer
8 23 (8.91%) UI Engineer
9 21 (8.14%) Architect
10 20 (7.75%) Senior Software Engineer
11 16 (6.20%) Agile Coach
11 16 (6.20%) Full Stack Engineer
12 15 (5.81%) Full Stack Software Engineer
12 15 (5.81%) Lead Java Engineer
13 13 (5.04%) Cloud Architect
14 10 (3.88%) DevOps Engineer
14 10 (3.88%) Lead Developer
14 10 (3.88%) Senior DevOps
15 9 (3.49%) Senior Manager
Libraries, Frameworks & Software Standards
1 70 (27.13%) React
2 61 (23.64%) CSS
3 37 (14.34%) Kafka
3 37 (14.34%) Spring
4 35 (13.57%) .NET
4 35 (13.57%) HTML
5 30 (11.63%) Leaflet
5 30 (11.63%) OpenLayers
5 30 (11.63%) PostGIS
6 28 (10.85%) .NET Core
7 16 (6.20%) Spring Boot
8 15 (5.81%) JDBC
9 9 (3.49%) AngularJS
9 9 (3.49%) Node.js
10 7 (2.71%) ASP.NET
11 6 (2.33%) Vue
12 5 (1.94%) ASP.NET Core
12 5 (1.94%) RESTful
13 4 (1.55%) Django
13 4 (1.55%) Express.js
Miscellaneous
1 39 (15.12%) Product Ownership
2 37 (14.34%) Public Cloud
3 17 (6.59%) Management Information System
4 16 (6.20%) Legacy Systems
5 15 (5.81%) Data Centre
5 15 (5.81%) Private Cloud
6 13 (5.04%) Replication
7 9 (3.49%) Mobile App
8 8 (3.10%) Onboarding
9 7 (2.71%) Algorithms
10 5 (1.94%) Reference Data
11 4 (1.55%) Data Structures
11 4 (1.55%) Distributed Denial-of-Service
11 4 (1.55%) Renewable Energy
12 3 (1.16%) Cloud Native
12 3 (1.16%) Low-Code
12 3 (1.16%) Self-Motivation
13 2 (0.78%) Cyber Defence
13 2 (0.78%) Enterprise Software
13 2 (0.78%) Greenfield Project
Operating Systems
1 28 (10.85%) Linux
2 15 (5.81%) Windows
3 14 (5.43%) Windows Server
4 5 (1.94%) Unix
5 4 (1.55%) Android
5 4 (1.55%) Apple iOS
5 4 (1.55%) Ubuntu
6 1 (0.39%) CentOS
Processes & Methodologies
1 211 (81.78%) Agile
2 97 (37.60%) Software Engineering
3 87 (33.72%) Mentoring
4 78 (30.23%) CI/CD
5 76 (29.46%) Actionable Insight
6 68 (26.36%) Visualisation
7 65 (25.19%) SDLC
8 64 (24.81%) Analytics
9 54 (20.93%) User Experience
10 51 (19.77%) Continuous Integration
11 49 (18.99%) User Research
12 48 (18.60%) Systems Thinking
13 45 (17.44%) Continuous Improvement
13 45 (17.44%) Data Visualisation
13 45 (17.44%) Roadmaps
14 44 (17.05%) Critical Thinking
14 44 (17.05%) Strategic Thinking
14 44 (17.05%) UX Research
15 43 (16.67%) Operational Stability
15 43 (16.67%) Problem-Solving
Programming Languages
1 74 (28.68%) JavaScript
2 57 (22.09%) Java
3 56 (21.71%) Python
4 55 (21.32%) SQL
5 26 (10.08%) C#
6 7 (2.71%) Bash
6 7 (2.71%) PowerShell
7 5 (1.94%) PHP
7 5 (1.94%) Shell Script
8 4 (1.55%) Kotlin
8 4 (1.55%) Swift
9 3 (1.16%) Go
9 3 (1.16%) Perl
9 3 (1.16%) Ruby
10 2 (0.78%) DataWeave
10 2 (0.78%) T-SQL
11 1 (0.39%) PL/SQL
11 1 (0.39%) TypeScript
11 1 (0.39%) VB
11 1 (0.39%) VB.NET
Qualifications
1 62 (24.03%) Degree
2 42 (16.28%) Security Cleared
3 41 (15.89%) SC Cleared
4 17 (6.59%) CCNA
4 17 (6.59%) Cisco Certification
5 7 (2.71%) Azure Certification
6 4 (1.55%) Network+ Certification
6 4 (1.55%) PMI Certification
7 2 (0.78%) ACCA
7 2 (0.78%) CISSP
7 2 (0.78%) PMP
8 1 (0.39%) Computer Science Degree
Quality Assurance & Compliance
1 32 (12.40%) Actionable Recommendations
2 21 (8.14%) PMO
3 10 (3.88%) QA
4 4 (1.55%) ISO/IEC 27001
4 4 (1.55%) SOC 2
5 3 (1.16%) GDPR
6 2 (0.78%) NCSC
6 2 (0.78%) NIST
7 1 (0.39%) Data Quality
System Software
1 13 (5.04%) VMware Infrastructure
1 13 (5.04%) VMware NSX
2 7 (2.71%) Active Directory
3 6 (2.33%) Docker
4 2 (0.78%) vSphere
5 1 (0.39%) Virtual Machines
Systems Management
1 40 (15.50%) Terraform
2 21 (8.14%) Grafana
3 16 (6.20%) Ansible
4 13 (5.04%) FortiGate
5 10 (3.88%) Kubernetes
6 5 (1.94%) ITRS Geneos
7 4 (1.55%) Microsoft Intune
8 2 (0.78%) SCCM
9 1 (0.39%) Prometheus
Vendors
1 32 (12.40%) Qualtrics
2 30 (11.63%) ESRI
3 21 (8.14%) Microsoft
3 21 (8.14%) Splunk
4 20 (7.75%) Atlassian
5 19 (7.36%) Cisco
6 15 (5.81%) Dynatrace
7 13 (5.04%) NetApp
7 13 (5.04%) VMware
8 12 (4.65%) ServiceNow
9 10 (3.88%) Oracle
10 5 (1.94%) AppDynamics
10 5 (1.94%) CA
10 5 (1.94%) Sybase
11 3 (1.16%) Google
12 2 (0.78%) Databricks
12 2 (0.78%) MuleSoft
13 1 (0.39%) Cadence
13 1 (0.39%) Salesforce
13 1 (0.39%) Teradata