VMware Jobs in Glasgow

VMware
Scotland > Glasgow

The table below provides summary statistics for permanent job vacancies advertised in Glasgow requiring knowledge or experience of VMware products and/or services. It includes a benchmarking guide to the annual salaries offered in vacancies that cited VMware over the 6 months leading up to 21 June 2024, comparing them to the same period in the previous two years.

The figures below represent the IT labour market in general and are not representative of salaries within VMware, Inc.

6 months to
21 Jun 2024
Same period 2023 Same period 2022
Rank 152 77 107
Rank change year-on-year -75 +30 -39
Permanent jobs citing VMware 76 52 20
As % of all permanent jobs advertised in Glasgow 2.00% 3.48% 1.22%
As % of the Vendors category 5.65% 8.04% 3.14%
Number of salaries quoted 55 29 11
10th Percentile £31,250 £27,600 £31,250
25th Percentile £41,250 £41,250 £38,759
Median annual salary (50th Percentile) £48,500 £50,000 £42,500
Median % change year-on-year -3.00% +17.65% +0.59%
75th Percentile £52,500 £53,750 £53,875
90th Percentile £55,000 £66,100 £55,000
Scotland median annual salary £47,500 £50,000 £50,000
% change year-on-year -5.00% - +19.05%

All Vendors
Glasgow

VMware falls under the Vendor Products and Services category. For comparison with the information above, the following table provides summary statistics for all permanent job vacancies requiring knowledge or experience of all vendor products and services in Glasgow.

Permanent vacancies with a requirement for knowledge or experience of vendor products and services 1,344 647 637
As % of all permanent jobs advertised in Glasgow 35.30% 43.31% 38.87%
Number of salaries quoted 291 260 330
10th Percentile £30,000 £30,000 £28,750
25th Percentile £40,000 £38,438 £36,250
Median annual salary (50th Percentile) £50,000 £52,500 £47,500
Median % change year-on-year -4.76% +10.53% +5.56%
75th Percentile £60,000 £61,250 £61,250
90th Percentile £77,500 £72,500 £72,500
Scotland median annual salary £50,000 £55,000 £50,080
% change year-on-year -9.09% +9.82% +5.43%

VMware
Job Vacancy Trend in Glasgow

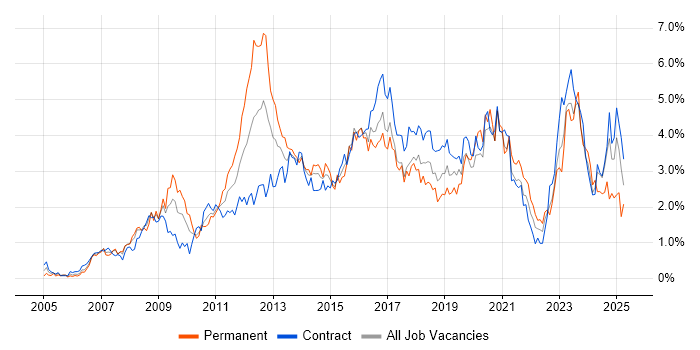
Job postings citing VMware as a proportion of all IT jobs advertised in Glasgow.

Job vacancy trend for VMware in Glasgow

VMware
Salary Trend in Glasgow

3-month moving average salary quoted in jobs citing VMware in Glasgow.

Salary trend for VMware in Glasgow

VMware
Salary Histogram in Glasgow

Salary distribution for jobs citing VMware in Glasgow over the 6 months to 21 June 2024.

Salary histogram for VMware in Glasgow

VMware
Co-occurring Skills and Capabilities in Glasgow by Category

The follow tables expand on the table above by listing co-occurrences grouped by category. The same employment type, locality and period is covered with up to 20 co-occurrences shown in each of the following categories:

Application Platforms
1 15 (19.74%) IIS
2 7 (9.21%) Microsoft Exchange
3 5 (6.58%) Apache
4 4 (5.26%) OpenStack
Cloud Services
1 49 (64.47%) Azure
2 26 (34.21%) Microsoft 365
3 25 (32.89%) AWS
4 17 (22.37%) GCP
5 14 (18.42%) IaaS
5 14 (18.42%) PaaS
6 8 (10.53%) Entra ID
7 7 (9.21%) Cloud Computing
8 5 (6.58%) Amazon S3
9 3 (3.95%) Azure Cosmos DB
10 2 (2.63%) Power Platform
11 1 (1.32%) OpenShift
Communications & Networking
1 25 (32.89%) WAN
2 22 (28.95%) Firewall
3 19 (25.00%) VPN
4 15 (19.74%) SAN
5 14 (18.42%) VoIP
6 13 (17.11%) SD-WAN
7 7 (9.21%) NAS
8 5 (6.58%) Internet
8 5 (6.58%) IPsec
8 5 (6.58%) SNMP
9 2 (2.63%) DHCP
9 2 (2.63%) DNS
9 2 (2.63%) Wi-Fi
10 1 (1.32%) LAN
10 1 (1.32%) Network Security
10 1 (1.32%) Wireless
Database & Business Intelligence
1 29 (38.16%) SQL Server
2 7 (9.21%) NoSQL
3 5 (6.58%) Elasticsearch
3 5 (6.58%) MongoDB
4 4 (5.26%) Big Data
5 3 (3.95%) Azure SQL Database
5 3 (3.95%) Ingres
6 1 (1.32%) MySQL
6 1 (1.32%) RDBMS
6 1 (1.32%) Relational Database
Development Applications
1 1 (1.32%) Git
1 1 (1.32%) GoCD
1 1 (1.32%) Jenkins
General
1 22 (28.95%) Social Skills
2 13 (17.11%) Finance
3 7 (9.21%) Law
3 7 (9.21%) Legal
4 2 (2.63%) Documentation Skills
4 2 (2.63%) Inclusion and Diversity
4 2 (2.63%) Police
4 2 (2.63%) Public Sector
4 2 (2.63%) Retail
5 1 (1.32%) Analytical Skills
Job Titles
1 23 (30.26%) Infrastructure Engineer
2 19 (25.00%) Systems Engineer
3 13 (17.11%) Senior
4 7 (9.21%) Cloud Engineer
4 7 (9.21%) IT Manager
4 7 (9.21%) Senior Infrastructure Engineer
5 5 (6.58%) Consultant
5 5 (6.58%) NetApp Consultant
5 5 (6.58%) Support Engineer
6 4 (5.26%) 2nd Line Desktop Support
6 4 (5.26%) 2nd Line Support
6 4 (5.26%) 2nd Line Support Technician
6 4 (5.26%) 3rd Line Engineer
6 4 (5.26%) 3rd Line Support
6 4 (5.26%) 3rd Line Support Engineer
6 4 (5.26%) AWS Architect
6 4 (5.26%) AWS Solution Architect
6 4 (5.26%) Desktop Technician
6 4 (5.26%) Platform Engineer
6 4 (5.26%) Solutions Architect
Libraries, Frameworks & Software Standards
1 5 (6.58%) RabbitMQ
1 5 (6.58%) YAML
2 4 (5.26%) REST
2 4 (5.26%) WebRTC
Miscellaneous
1 25 (32.89%) Public Cloud
2 23 (30.26%) Data Centre
3 13 (17.11%) Replication
4 11 (14.47%) Clustering
5 7 (9.21%) Distributed Systems
6 4 (5.26%) Cloud Native
7 1 (1.32%) Management Information System
7 1 (1.32%) PKI
Operating Systems
1 65 (85.53%) Windows
2 45 (59.21%) Windows Server
3 32 (42.11%) Linux
4 6 (7.89%) Windows Server 2012
5 5 (6.58%) Data ONTAP
6 4 (5.26%) CentOS
6 4 (5.26%) Debian
6 4 (5.26%) Mesosphere
6 4 (5.26%) Unix
6 4 (5.26%) Windows 10
6 4 (5.26%) Windows Server 2008
6 4 (5.26%) Windows Server 2016
Processes & Methodologies
1 26 (34.21%) Problem-Solving
2 24 (31.58%) Infrastructure Engineering
3 22 (28.95%) Disaster Recovery
4 14 (18.42%) Infrastructure Management
5 13 (17.11%) DevOps
5 13 (17.11%) Mentoring
5 13 (17.11%) Network Virtualisation
5 13 (17.11%) Project Delivery
6 12 (15.79%) High Availability
7 11 (14.47%) Prototyping
7 11 (14.47%) Service Delivery
8 9 (11.84%) Capacity Planning
8 9 (11.84%) Coaching
9 8 (10.53%) Continuous Improvement
10 7 (9.21%) API Design
10 7 (9.21%) API Development
10 7 (9.21%) Continuous Delivery
10 7 (9.21%) Continuous Integration
10 7 (9.21%) ITSM
10 7 (9.21%) Performance Analysis
Programming Languages
1 16 (21.05%) SQL
2 9 (11.84%) Python
3 8 (10.53%) Java
4 5 (6.58%) PowerShell
5 4 (5.26%) Bash
6 3 (3.95%) T-SQL
7 1 (1.32%) JavaScript
7 1 (1.32%) Shell Script
Qualifications
1 16 (21.05%) Security Cleared
2 14 (18.42%) CCNA
2 14 (18.42%) Cisco Certification
3 7 (9.21%) SC Cleared
4 6 (7.89%) MCSE
4 6 (7.89%) Microsoft Certification
5 4 (5.26%) AWS Certification
5 4 (5.26%) AWS Certified Solutions Architect
5 4 (5.26%) MCSA
5 4 (5.26%) RHCT
6 3 (3.95%) HND
7 2 (2.63%) Degree
8 1 (1.32%) CCNP
8 1 (1.32%) Computer Science Degree
Quality Assurance & Compliance
1 4 (5.26%) QA
System Software
1 52 (68.42%) VMware Infrastructure
2 28 (36.84%) Active Directory
3 24 (31.58%) VMware NSX
4 16 (21.05%) Hyper-V
5 10 (13.16%) Docker
6 7 (9.21%) vSphere
7 4 (5.26%) KVM
8 1 (1.32%) VMware ESXi
Systems Management
1 22 (28.95%) Ansible
2 13 (17.11%) FortiGate
2 13 (17.11%) Terraform
3 10 (13.16%) Kubernetes
4 7 (9.21%) ZABBIX
5 5 (6.58%) Prometheus
5 5 (6.58%) vCenter Server
6 4 (5.26%) Docker Swarm
6 4 (5.26%) McAfee ePO
6 4 (5.26%) Microsoft Intune
6 4 (5.26%) Progress Chef
6 4 (5.26%) Puppet
7 1 (1.32%) Grafana
7 1 (1.32%) SCOM
Vendors
1 35 (46.05%) Microsoft
2 21 (27.63%) Cisco
3 18 (23.68%) NetApp
4 9 (11.84%) Red Hat
5 7 (9.21%) Mitel
6 6 (7.89%) Citrix
6 6 (7.89%) EMC
6 6 (7.89%) Sophos
7 5 (6.58%) Palo Alto
7 5 (6.58%) SolidFire
8 4 (5.26%) McAfee
9 1 (1.32%) Oracle