Windows Server Job Trends in the North West

Microsoft Windows Server
England > North West

The table below provides summary statistics and salary benchmarking for jobs advertised in the North West requiring Windows Server skills. It covers permanent job vacancies from the 6 months leading up to 14 October 2026, with comparisons to the same periods in the previous two years.

6 months to
14 Oct 2026
Same period 2025 Same period 2024
Rank 107 157 102
Rank change year-on-year +50 -55 -32
Permanent jobs citing Windows Server 181 83 148
As % of all permanent jobs in the North West 1.40% 1.63% 2.05%
As % of the Operating Systems category 29.19% 7.79% 19.58%
Number of salaries quoted 144 74 77
10th Percentile £27,800 £29,500 £27,000
25th Percentile £31,000 £32,500 £31,250
Median annual salary (50th Percentile) £38,500 £40,500 £40,000
Median % change year-on-year -4.94% +1.25% -15.79%
75th Percentile £48,750 £58,438 £48,750
90th Percentile £53,750 £63,525 £60,800
England median annual salary £42,500 £40,000 £45,000
% change year-on-year +6.25% -11.11% -

All Operating Systems
North West

Windows Server falls under the Operating Systems category. For comparison with the information above, the following table provides summary statistics for all permanent job vacancies requiring operating system skills in the North West.

Permanent vacancies with a requirement for operating system skills 620 1,065 756
As % of all permanent jobs advertised in the North West 4.81% 20.88% 10.48%
Number of salaries quoted 452 307 374
10th Percentile £27,500 £26,250 £26,288
25th Percentile £30,500 £29,500 £32,500
Median annual salary (50th Percentile) £40,000 £35,000 £42,500
Median % change year-on-year +14.29% -17.65% -15.00%
75th Percentile £57,500 £55,000 £56,250
90th Percentile £67,250 £63,950 £67,968
England median annual salary £45,000 £41,000 £50,000
% change year-on-year +9.76% -18.00% -4.76%

Windows Server
Job Vacancy Trend in the North West

Historical trend showing the proportion of permanent IT job postings citing Windows Server relative to all permanent IT jobs advertised in the North West.

Windows Server job vacancy trend in the North West

Windows Server
Salary Trend in the North West

Salary distribution trend for jobs in the North West citing Windows Server.
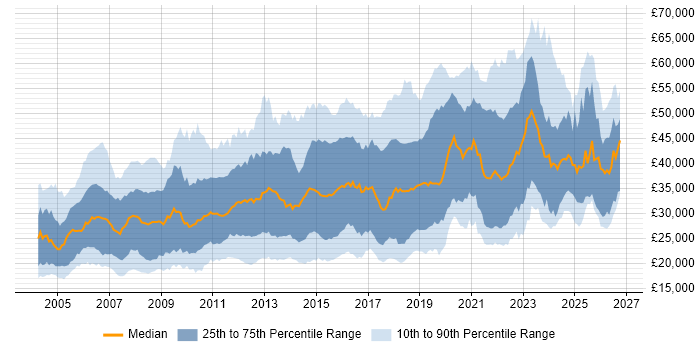
Salary distribution trend for jobs in the North West citing Windows Server

Windows Server
Salary Histogram in the North West

Salary distribution for jobs citing Windows Server in the North West over the 6 months to 14 October 2026.

Salary histogram for Windows Server in the North West

Windows Server
Job Locations in the North West

The table below looks at the demand and provides a guide to the median salaries quoted in IT jobs citing Windows Server within the North West region over the 6 months to 14 October 2026. The 'Rank Change' column provides an indication of the change in demand within each location based on the same 6 month period last year.

Location Rank Change
on Same Period
Last Year
Matching
Permanent
IT Job Ads
Median Salary
Past 6 Months
Median Salary
% Change
on Same Period
Last Year
Live
Jobs
Manchester -17 84 £46,500 +14.81% 34
Lancashire +37 37 £32,250 -28.33% 16
Merseyside +17 30 £41,000 - 9
Cheshire +30 25 £37,500 -33.04% 10
Cumbria -9 4 £18,197 -66.15% 2
Windows Server
England

Windows Server
Co-Occurring Skills & Capabilities in the North West by Category

The following tables expand on the one above by listing co-occurrences grouped by category. They cover the same employment type, locality and period, with up to 20 co-occurrences shown in each category:

Application Platforms
1 45 (24.86%) Microsoft Exchange
2 21 (11.60%) IIS
3 18 (9.94%) SharePoint
4 8 (4.42%) Apache
5 2 (1.10%) Exchange Server 2013
6 1 (0.55%) HCL Domino
6 1 (0.55%) HCL Notes
6 1 (0.55%) SharePoint Server
Applications
1 1 (0.55%) Revit
Business Applications
1 3 (1.66%) Remedy ITSM
2 1 (0.55%) Dynamics AX
Cloud Services
1 119 (65.75%) Microsoft 365
2 98 (54.14%) Azure
3 52 (28.73%) Entra ID
4 20 (11.05%) AWS
5 16 (8.84%) IaaS
5 16 (8.84%) OneDrive
6 13 (7.18%) SaaS
7 9 (4.97%) Mimecast
8 4 (2.21%) Azure AKS
8 4 (2.21%) Microsoft Copilot
8 4 (2.21%) Power Platform
9 3 (1.66%) Amazon EKS
9 3 (1.66%) Azure Monitor
9 3 (1.66%) GCP
9 3 (1.66%) Nutanix
9 3 (1.66%) OpenShift
10 2 (1.10%) Amazon EC2
10 2 (1.10%) Google Workspace
10 2 (1.10%) PaaS
11 1 (0.55%) GitHub
Communications & Networking
1 101 (55.80%) DNS
2 93 (51.38%) DHCP
3 54 (29.83%) Firewall
4 49 (27.07%) TCP/IP
5 41 (22.65%) VPN
6 39 (21.55%) VLAN
7 30 (16.57%) Wi-Fi
8 26 (14.36%) VoIP
9 14 (7.73%) WAN
10 12 (6.63%) SNMP
10 12 (6.63%) Structured Cabling
11 8 (4.42%) LAN
11 8 (4.42%) SAN
12 7 (3.87%) Remote Desktop
12 7 (3.87%) SD-WAN
13 6 (3.31%) VSAN
13 6 (3.31%) Wireless
14 5 (2.76%) Network Security
14 5 (2.76%) SSL
15 3 (1.66%) Unified Communications
Database & Business Intelligence
1 28 (15.47%) SQL Server
2 9 (4.97%) MySQL
3 5 (2.76%) Amazon RDS
4 2 (1.10%) Data Lake
4 2 (1.10%) Looker
4 2 (1.10%) Power BI
5 1 (0.55%) Metadata
5 1 (0.55%) Oracle Database
5 1 (0.55%) PostgreSQL
5 1 (0.55%) Relational Database
Development Applications
1 3 (1.66%) Git
General
1 56 (30.94%) Social Skills
2 30 (16.57%) Analytical Skills
3 12 (6.63%) Manufacturing
4 11 (6.08%) Organisational Skills
5 10 (5.52%) Documentation Skills
5 10 (5.52%) Legal
6 9 (4.97%) Retail
7 4 (2.21%) Finance
7 4 (2.21%) Inclusion and Diversity
7 4 (2.21%) Public Sector
7 4 (2.21%) Telecoms
8 3 (1.66%) Law
9 2 (1.10%) Games
10 1 (0.55%) Aerospace
Job Titles
1 76 (41.99%) IT Support
2 50 (27.62%) Support Engineer
3 46 (25.41%) Analyst
4 42 (23.20%) IT Engineer
5 39 (21.55%) IT Support Engineer
6 27 (14.92%) IT Technician
7 24 (13.26%) IT Support Technician
7 24 (13.26%) Support Technician
8 23 (12.71%) Infrastructure Analyst
9 22 (12.15%) Infrastructure Engineer
10 15 (8.29%) Support Analyst
11 12 (6.63%) 3rd Line Support
12 11 (6.08%) 2nd Line Support
12 11 (6.08%) IT Analyst
12 11 (6.08%) IT Support Analyst
12 11 (6.08%) Senior
13 9 (4.97%) Field Engineer
13 9 (4.97%) IT Manager
13 9 (4.97%) Lead
14 7 (3.87%) Senior Infrastructure Engineer
Libraries, Frameworks & Software Standards
1 11 (6.08%) SAML
2 8 (4.42%) Middleware
3 6 (3.31%) Terraform
4 1 (0.55%) ARM Templates
Miscellaneous
1 41 (22.65%) Driving Licence
2 12 (6.63%) Data Centre
3 8 (4.42%) Management Information System
4 7 (3.87%) Onboarding
4 7 (3.87%) Self-Motivation
5 6 (3.31%) Enterprise Software
5 6 (3.31%) Hybrid Cloud
5 6 (3.31%) Public Cloud
5 6 (3.31%) Replication
6 5 (2.76%) CCTV
6 5 (2.76%) Clustering
7 4 (2.21%) Cyberattack
7 4 (2.21%) Enterprise Storage
8 3 (1.66%) Cyber Threat
8 3 (1.66%) Microsoft Licensing
8 3 (1.66%) Private Cloud
8 3 (1.66%) Social Media
9 2 (1.10%) Life Science
10 1 (0.55%) CUDA
10 1 (0.55%) Renewable Energy
Operating Systems
1 180 (99.45%) Windows
2 29 (16.02%) Linux
3 28 (15.47%) Windows Server 2016
4 20 (11.05%) Windows Server 2019
5 19 (10.50%) Windows 10
6 10 (5.52%) Ubuntu
7 6 (3.31%) VMS
8 5 (2.76%) Red Hat Enterprise Linux
9 3 (1.66%) CentOS
9 3 (1.66%) CoreOS
9 3 (1.66%) macOS
9 3 (1.66%) Unix
10 1 (0.55%) Android
10 1 (0.55%) Apple iOS
10 1 (0.55%) Oracle Linux
10 1 (0.55%) SUSE
10 1 (0.55%) SUSE Linux Enterprise Server
10 1 (0.55%) Windows Server 2008
10 1 (0.55%) Windows Server 2012
Processes & Methodologies
1 62 (34.25%) Disaster Recovery
2 60 (33.15%) Problem-Solving
3 52 (28.73%) Cybersecurity
4 51 (28.18%) Continuous Improvement
4 51 (28.18%) Customer Service
5 49 (27.07%) Infrastructure Engineering
6 40 (22.10%) ITIL
7 34 (18.78%) Business Continuity
7 34 (18.78%) High Availability
8 26 (14.36%) Service Delivery
9 25 (13.81%) Remote Monitoring and Management
10 20 (11.05%) Change Management
11 18 (9.94%) ITSM
12 17 (9.39%) Roadmaps
13 16 (8.84%) Project Delivery
14 15 (8.29%) Problem Management
15 14 (7.73%) AI
15 14 (7.73%) Technology Transformation
16 13 (7.18%) Information Security
16 13 (7.18%) Migration
Programming Languages
1 36 (19.89%) PowerShell
2 20 (11.05%) SQL
3 8 (4.42%) Bash
3 8 (4.42%) Python
4 6 (3.31%) Bicep
Qualifications
1 30 (16.57%) Microsoft Certification
2 20 (11.05%) Azure Certification
3 17 (9.39%) Degree
4 15 (8.29%) Security Cleared
5 14 (7.73%) SC Cleared
6 9 (4.97%) DBS Check
6 9 (4.97%) Microsoft Certified Professional
7 7 (3.87%) ITIL Certification
8 6 (3.31%) VMware Certified Professional (VCP)
9 5 (2.76%) DV Cleared
9 5 (2.76%) MCSA
10 1 (0.55%) AWS Certification
10 1 (0.55%) HP ASE
10 1 (0.55%) ITIL Foundation Certificate
10 1 (0.55%) MCSE
10 1 (0.55%) PMI Certification
10 1 (0.55%) PMP
10 1 (0.55%) RHCSA
10 1 (0.55%) VCAP
Quality Assurance & Compliance
1 11 (6.08%) SLA
2 10 (5.52%) Cyber Essentials
3 3 (1.66%) GDPR
4 1 (0.55%) COSHH
4 1 (0.55%) ISO/IEC 27001
4 1 (0.55%) QA
System Software
1 122 (67.40%) Active Directory
2 56 (30.94%) VMware Infrastructure
3 41 (22.65%) Hyper-V
4 16 (8.84%) Virtual Machines
5 10 (5.52%) VMware ESXi
6 8 (4.42%) vSphere
7 6 (3.31%) DFS Replication
7 6 (3.31%) Virtual Desktop
8 5 (2.76%) VMware NSX
9 2 (1.10%) Docker
10 1 (0.55%) BitLocker
10 1 (0.55%) Ceph
10 1 (0.55%) EMC RecoverPoint
10 1 (0.55%) Firmware
10 1 (0.55%) MetaFrame
10 1 (0.55%) Microsoft Virtual Server
10 1 (0.55%) Virtual Servers
10 1 (0.55%) XenDesktop
Systems Management
1 34 (18.78%) Microsoft Intune
2 16 (8.84%) FortiGate
3 12 (6.63%) WSUS
4 11 (6.08%) Single Sign-On
5 9 (4.97%) Autotask
6 7 (3.87%) Ansible
6 7 (3.87%) Microsoft Clustering
7 6 (3.31%) SCCM
8 3 (1.66%) cPanel
8 3 (1.66%) McAfee ePO
8 3 (1.66%) Plesk
8 3 (1.66%) SCVMM
9 1 (0.55%) Failover Clustering
9 1 (0.55%) Kubernetes
9 1 (0.55%) Progress Chef
9 1 (0.55%) Proxmox
9 1 (0.55%) Puppet
9 1 (0.55%) Red Hat Satellite
9 1 (0.55%) VxRail
Vendors
1 151 (83.43%) Microsoft
2 80 (44.20%) VMware
3 22 (12.15%) SonicWALL
4 20 (11.05%) Cisco
5 16 (8.84%) Veeam
6 13 (7.18%) Aruba
7 12 (6.63%) SolarWinds
8 11 (6.08%) Dell
9 10 (5.52%) HP
10 9 (4.97%) Datto
10 9 (4.97%) NetApp
10 9 (4.97%) Palo Alto
11 8 (4.42%) CheckPoint
11 8 (4.42%) iManage
11 8 (4.42%) WatchGuard
12 7 (3.87%) Aderant
12 7 (3.87%) Draytek
13 6 (3.31%) Fortinet
14 5 (2.76%) Red Hat
14 5 (2.76%) Sophos