Docker Jobs in England

Docker
UK > England

The table below provides summary statistics for permanent job vacancies advertised in England requiring Docker skills. It includes a benchmarking guide to the annual salaries offered in vacancies that cited Docker over the 6 months leading up to 26 July 2024, comparing them to the same period in the previous two years.

6 months to
26 Jul 2024
Same period 2023 Same period 2022
Rank 83 41 22
Rank change year-on-year -42 -19 -2
Permanent jobs citing Docker 2,286 4,357 15,073
As % of all permanent jobs advertised in England 2.92% 6.13% 10.25%
As % of the System Software category 27.01% 38.25% 60.58%
Number of salaries quoted 1,695 3,034 6,281
10th Percentile £46,250 £47,500 £45,000
25th Percentile £53,750 £57,500 £53,750
Median annual salary (50th Percentile) £70,000 £75,000 £72,500
Median % change year-on-year -6.67% +3.45% +7.41%
75th Percentile £87,500 £90,000 £90,000
90th Percentile £105,000 £110,000 £105,000
UK median annual salary £68,000 £72,500 £70,000
% change year-on-year -6.21% +3.57% +7.69%

All System Software Skills
England

Docker falls under the System Software category. For comparison with the information above, the following table provides summary statistics for all permanent job vacancies requiring system software skills in England.

Permanent vacancies with a requirement for system software skills 8,463 11,392 24,880
As % of all permanent jobs advertised in England 10.80% 16.03% 16.92%
Number of salaries quoted 6,390 8,265 13,701
10th Percentile £27,000 £28,000 £28,189
25th Percentile £35,000 £37,000 £38,117
Median annual salary (50th Percentile) £50,000 £55,000 £55,000
Median % change year-on-year -9.09% - -4.35%
75th Percentile £67,968 £77,500 £80,000
90th Percentile £87,500 £93,750 £95,000
UK median annual salary £50,000 £55,000 £55,000
% change year-on-year -9.09% - -

Docker
Job Vacancy Trend in England

Job postings citing Docker as a proportion of all IT jobs advertised in England.
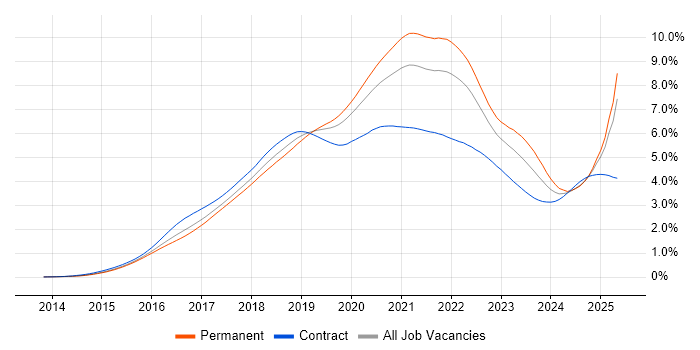
Job vacancy trend for Docker in England

Docker
Salary Trend in England

3-month moving average salary quoted in jobs citing Docker in England.

Salary trend for Docker in England

Docker
Salary Histogram in England

Salary distribution for jobs citing Docker in England over the 6 months to 26 July 2024.

Salary histogram for Docker in England

Docker
Job Locations in England

The table below looks at the demand and provides a guide to the median salaries quoted in IT jobs citing Docker within the England region over the 6 months to 26 July 2024. The 'Rank Change' column provides an indication of the change in demand within each location based on the same 6 month period last year.

Location Rank Change
on Same Period
Last Year
Matching
Permanent
IT Job Ads
Median Salary
Past 6 Months
Median Salary
% Change
on Same Period
Last Year
Live
Jobs
London -30 831 £85,000 +5.86% 112
South East -5 560 £65,000 -3.70% 71
North of England -59 341 £61,250 -5.77% 44
South West -45 271 £67,500 -2.80% 37
Midlands -53 220 £57,500 -4.17% 43
North West -64 188 £65,000 -7.14% 28
Yorkshire -12 141 £60,000 - 11
West Midlands -30 114 £60,000 -2.04% 29
East Midlands -51 105 £57,500 +4.55% 14
East of England -82 43 £60,000 -9.43% 12
North East -46 12 £64,000 +6.67% 5
Docker
UK

Docker
Co-occurring Skills and Capabilities in England by Category

The follow tables expand on the table above by listing co-occurrences grouped by category. The same employment type, locality and period is covered with up to 20 co-occurrences shown in each of the following categories:

Application Platforms
1 117 (5.12%) Apache
2 98 (4.29%) nginx
3 41 (1.79%) Apache Spark
4 36 (1.57%) Camunda
5 29 (1.27%) OpenStack
6 26 (1.14%) Drupal
7 25 (1.09%) CMS
8 24 (1.05%) Confluence
9 20 (0.87%) Jupyter
10 18 (0.79%) JBoss
11 15 (0.66%) Apache Airflow
11 15 (0.66%) IIS
12 11 (0.48%) Moodle
12 11 (0.48%) Tomcat
13 10 (0.44%) Totara
14 7 (0.31%) Red Hat Fuse
14 7 (0.31%) WebLogic
14 7 (0.31%) WebSphere
14 7 (0.31%) WildFly
15 6 (0.26%) Apache Pulsar
Applications
1 11 (0.48%) Microsoft Excel
2 8 (0.35%) Microsoft Office
3 6 (0.26%) Photoshop
4 5 (0.22%) Simulink
5 3 (0.13%) Chatbot
5 3 (0.13%) GNU Octave
5 3 (0.13%) Microsoft PowerPoint
6 2 (0.087%) MS Visio
6 2 (0.087%) OrCAD
7 1 (0.044%) Adobe XD
7 1 (0.044%) Blender
7 1 (0.044%) Trello
Business Applications
1 30 (1.31%) Ripple
2 7 (0.31%) Teamcenter
3 2 (0.087%) Salesforce CRM
3 2 (0.087%) SAP S/4HANA
3 2 (0.087%) Temenos T24
4 1 (0.044%) Magento
4 1 (0.044%) Maximo
4 1 (0.044%) Oracle EBS
4 1 (0.044%) Payment Gateway
4 1 (0.044%) Remedy ITSM
4 1 (0.044%) SAP Business One
4 1 (0.044%) Shopify
Cloud Services
1 1,253 (54.81%) AWS
2 888 (38.85%) Azure
3 330 (14.44%) GCP
4 284 (12.42%) GitHub
5 259 (11.33%) Azure DevOps
6 211 (9.23%) Serverless
7 164 (7.17%) SaaS
8 153 (6.69%) Amazon S3
9 149 (6.52%) OpenShift
10 129 (5.64%) GitHub Actions
11 119 (5.21%) AWS Lambda
12 95 (4.16%) Amazon ECS
13 93 (4.07%) AWS CloudFormation
14 90 (3.94%) Amazon EC2
15 89 (3.89%) Amazon EKS
16 86 (3.76%) IBM Cloud
17 70 (3.06%) Azure AKS
17 70 (3.06%) PaaS
18 66 (2.89%) Cloud Computing
19 48 (2.10%) Amazon CloudWatch
Communications & Networking
1 108 (4.72%) Firewall
2 72 (3.15%) VPN
3 59 (2.58%) DNS
4 47 (2.06%) HTTP
5 43 (1.88%) Internet
5 43 (1.88%) TCP/IP
6 39 (1.71%) Network Security
6 39 (1.71%) SNMP
7 35 (1.53%) WAN
8 34 (1.49%) IPsec
9 33 (1.44%) DHCP
10 27 (1.18%) SD-WAN
11 22 (0.96%) Remote Desktop
12 15 (0.66%) BGP
13 14 (0.61%) 5G
13 14 (0.61%) MQTT
14 12 (0.52%) AMQP
15 11 (0.48%) Ethernet VPN
15 11 (0.48%) MPLS
15 11 (0.48%) SSL
Database & Business Intelligence
1 206 (9.01%) PostgreSQL
2 200 (8.75%) NoSQL
3 193 (8.44%) MongoDB
4 171 (7.48%) SQL Server
5 155 (6.78%) MySQL
6 119 (5.21%) Relational Database
7 100 (4.37%) Elasticsearch
8 95 (4.16%) Amazon RDS
9 72 (3.15%) Redis
10 57 (2.49%) Big Data
11 46 (2.01%) Azure SQL Database
12 36 (1.57%) Oracle Database
13 29 (1.27%) DynamoDB
14 27 (1.18%) Hadoop
15 26 (1.14%) RDBMS
16 23 (1.01%) Data Warehouse
17 20 (0.87%) Amazon Redshift
18 19 (0.83%) BigQuery
19 18 (0.79%) SQLite
20 17 (0.74%) Presto
Development Applications
1 522 (22.83%) Git
2 381 (16.67%) Jenkins
3 187 (8.18%) GitLab
4 125 (5.47%) JIRA
5 107 (4.68%) Selenium
6 72 (3.15%) Cypress.io
7 68 (2.97%) CircleCI
8 65 (2.84%) JUnit
9 59 (2.58%) Octopus Deploy
10 56 (2.45%) SonarQube
11 53 (2.32%) TeamCity
12 47 (2.06%) Bitbucket
13 41 (1.79%) Cucumber
14 30 (1.31%) Maven
15 24 (1.05%) SoapUI
15 24 (1.05%) Team Foundation Server
16 22 (0.96%) Mockito
17 21 (0.92%) Visual Studio
18 20 (0.87%) Atlassian Bamboo
18 20 (0.87%) TestNG
General
1 456 (19.95%) Social Skills
2 434 (18.99%) Finance
3 244 (10.67%) Public Sector
4 105 (4.59%) Banking
5 99 (4.33%) Analytical Skills
6 95 (4.16%) Inclusion and Diversity
7 73 (3.19%) Aerospace
8 61 (2.67%) Marketing
8 61 (2.67%) Organisational Skills
9 52 (2.27%) Retail
9 52 (2.27%) Telecoms
10 49 (2.14%) Financial Institution
10 49 (2.14%) Law
11 46 (2.01%) Legal
12 38 (1.66%) Games
13 37 (1.62%) Tech for Good
14 35 (1.53%) Automotive
15 23 (1.01%) Publishing
16 22 (0.96%) Manufacturing
16 22 (0.96%) Retail Banking
Job Titles
1 751 (32.85%) Developer
2 560 (24.50%) Senior
3 369 (16.14%) DevOps Engineer
4 293 (12.82%) Lead
5 279 (12.20%) Software Engineer
6 223 (9.76%) Senior Developer
7 156 (6.82%) Java Developer
8 140 (6.12%) AWS Engineer
9 130 (5.69%) Software Developer
10 120 (5.25%) Infrastructure Engineer
11 114 (4.99%) Senior Software Engineer
12 112 (4.90%) Architect
13 107 (4.68%) Cloud Engineer
13 107 (4.68%) Full Stack Developer
14 98 (4.29%) .NET Developer
15 95 (4.16%) Platform Engineer
16 89 (3.89%) Azure Engineer
17 83 (3.63%) AWS DevOps
18 78 (3.41%) C# Developer
19 77 (3.37%) PHP Developer
Libraries, Frameworks & Software Standards
1 531 (23.23%) React
2 401 (17.54%) .NET
3 239 (10.45%) REST
4 238 (10.41%) Node.js
5 222 (9.71%) Kafka
6 212 (9.27%) Spring
7 210 (9.19%) AngularJS
8 190 (8.31%) Spring Boot
9 182 (7.96%) HTML
10 178 (7.79%) RabbitMQ
11 172 (7.52%) CSS
12 159 (6.96%) RESTful
13 124 (5.42%) Web Services
14 104 (4.55%) .NET Core
15 99 (4.33%) GraphQL
16 78 (3.41%) .NET Framework
17 77 (3.37%) YAML
18 74 (3.24%) Vue
19 73 (3.19%) gRPC
20 71 (3.11%) Jest
Miscellaneous
1 163 (7.13%) Distributed Systems
2 128 (5.60%) Blockchain
3 123 (5.38%) Hybrid Cloud
4 89 (3.89%) Public Cloud
5 79 (3.46%) Greenfield Project
6 78 (3.41%) Data Centre
7 77 (3.37%) Product Ownership
8 76 (3.32%) Cloud Native
9 74 (3.24%) Management Information System
10 62 (2.71%) e-Learning
11 49 (2.14%) Mobile App
12 38 (1.66%) Enterprise Software
12 38 (1.66%) Self-Motivation
13 36 (1.57%) NFT
14 34 (1.49%) Linux Command Line
15 33 (1.44%) Onboarding
16 32 (1.40%) IoT
17 26 (1.14%) Algorithms
17 26 (1.14%) Data Structures
18 24 (1.05%) Distributed Denial-of-Service
Operating Systems
1 571 (24.98%) Linux
2 214 (9.36%) Windows
3 100 (4.37%) Red Hat Enterprise Linux
4 69 (3.02%) CentOS
5 56 (2.45%) Windows Server
6 51 (2.23%) Debian
7 47 (2.06%) Alpine Linux
8 34 (1.49%) Data ONTAP
9 31 (1.36%) Unix
10 19 (0.83%) Ubuntu
11 12 (0.52%) Android
11 12 (0.52%) Oracle Linux
11 12 (0.52%) Solaris
12 11 (0.48%) Apple iOS
13 9 (0.39%) VMS
14 6 (0.26%) SUSE Linux Enterprise Server
15 4 (0.17%) Kali Linux
15 4 (0.17%) Windows 10
16 3 (0.13%) Rocky
16 3 (0.13%) Windows Server 2016
Processes & Methodologies
1 1,021 (44.66%) DevOps
2 983 (43.00%) CI/CD
3 925 (40.46%) Agile
4 634 (27.73%) Containerisation
5 587 (25.68%) Software Engineering
6 481 (21.04%) Microservices
7 420 (18.37%) Problem-Solving
8 388 (16.97%) Infrastructure as Code
9 344 (15.05%) Full Stack Development
10 311 (13.60%) Mentoring
11 310 (13.56%) Computer Science
12 305 (13.34%) Artificial Intelligence
13 263 (11.50%) TDD
14 247 (10.80%) SDLC
15 239 (10.45%) Continuous Integration
16 223 (9.76%) Scrum
17 212 (9.27%) Test Automation
18 169 (7.39%) Fintech
19 162 (7.09%) Continuous Improvement
20 147 (6.43%) Machine Learning
Programming Languages
1 730 (31.93%) Python
2 646 (28.26%) Java
3 605 (26.47%) JavaScript
4 405 (17.72%) C#
5 347 (15.18%) SQL
6 294 (12.86%) TypeScript
7 219 (9.58%) Bash
8 195 (8.53%) PowerShell
9 180 (7.87%) PHP
10 173 (7.57%) Go
11 68 (2.97%) C++
12 54 (2.36%) Perl
13 52 (2.27%) Kotlin
13 52 (2.27%) Rust
14 51 (2.23%) Shell Script
15 41 (1.79%) Ruby
16 36 (1.57%) Lua
17 34 (1.49%) Scala
18 31 (1.36%) Bicep
19 30 (1.31%) Solidity
Qualifications
1 343 (15.00%) Degree
2 317 (13.87%) Security Cleared
3 184 (8.05%) Computer Science Degree
4 177 (7.74%) SC Cleared
5 129 (5.64%) DV Cleared
6 113 (4.94%) AWS Certification
7 99 (4.33%) Azure Certification
8 48 (2.10%) Microsoft Certification
9 47 (2.06%) Master's Degree
10 41 (1.79%) MCSA
10 41 (1.79%) MCSE
11 24 (1.05%) (ISC)2 CCSP
11 24 (1.05%) CCSK
11 24 (1.05%) CCSP
11 24 (1.05%) Cisco Certification
11 24 (1.05%) CISM
11 24 (1.05%) CISSP
12 23 (1.01%) BPSS Clearance
13 21 (0.92%) AWS Certified Solutions Architect
14 18 (0.79%) AWS Certified DevOps Engineer
Quality Assurance & Compliance
1 77 (3.37%) QA
2 42 (1.84%) NIST
3 27 (1.18%) ISO/IEC 27001
3 27 (1.18%) WCAG
4 26 (1.14%) GDPR
5 16 (0.70%) Accessibility
6 15 (0.66%) NCSC
7 12 (0.52%) Data Quality
7 12 (0.52%) SOC 2
8 11 (0.48%) HIPAA
8 11 (0.48%) PCI DSS
9 9 (0.39%) Cyber Essentials
10 6 (0.26%) SLA
11 2 (0.087%) California Consumer Privacy Act
11 2 (0.087%) MiFID
11 2 (0.087%) Software Quality Assurance
12 1 (0.044%) HL7
12 1 (0.044%) Sarbanes-Oxley
System Software
1 131 (5.73%) VMware Infrastructure
2 57 (2.49%) Virtual Machines
3 52 (2.27%) Hyper-V
4 50 (2.19%) Active Directory
5 22 (0.96%) XenApp
5 22 (0.96%) XenDesktop
6 17 (0.74%) NFS
7 13 (0.57%) pfSense
7 13 (0.57%) Virtual Desktop
8 11 (0.48%) KVM
8 11 (0.48%) VMware ESXi
8 11 (0.48%) vSphere
9 10 (0.44%) Firmware
10 8 (0.35%) Ceph
10 8 (0.35%) Slurm Workload Manager
11 4 (0.17%) Lustre
11 4 (0.17%) Xen
12 3 (0.13%) Embedded Firmware
12 3 (0.13%) Gluster
12 3 (0.13%) oVirt
Systems Management
1 1,584 (69.29%) Kubernetes
2 743 (32.50%) Terraform
3 453 (19.82%) Ansible
4 150 (6.56%) Prometheus
5 125 (5.47%) Puppet
6 117 (5.12%) Grafana
7 62 (2.71%) Progress Chef
8 49 (2.14%) Single Sign-On
9 45 (1.97%) vCenter Server
10 34 (1.49%) Kibana
11 32 (1.40%) Docker Swarm
12 27 (1.18%) Nagios
13 23 (1.01%) ZABBIX
14 19 (0.83%) Salt
15 18 (0.79%) HAProxy
16 14 (0.61%) Active Directory Federation Services
17 13 (0.57%) Argo
18 12 (0.52%) Podman
18 12 (0.52%) Red Hat Satellite
19 10 (0.44%) Istio
Vendors
1 189 (8.27%) Red Hat
2 170 (7.44%) Microsoft
3 152 (6.65%) VMware
4 114 (4.99%) Oracle
5 109 (4.77%) Google
6 89 (3.89%) IBM
7 52 (2.27%) Splunk
8 39 (1.71%) Palo Alto
9 38 (1.66%) NetApp
10 34 (1.49%) SolidFire
11 31 (1.36%) Citrix
12 27 (1.18%) Dynatrace
13 26 (1.14%) Cisco
14 24 (1.05%) ForgeRock
15 19 (0.83%) Databricks
16 16 (0.70%) Atlassian
16 16 (0.70%) New Relic
16 16 (0.70%) Sitecore
17 15 (0.66%) SAP
17 15 (0.66%) Veeam