Stakeholder Management Jobs in the North West

Stakeholder Management
England > North West

The table below provides summary statistics for permanent job vacancies advertised in the North West requiring Stakeholder Management skills. It includes a benchmarking guide to the annual salaries offered in vacancies that cited Stakeholder Management over the 6 months leading up to 14 May 2025, comparing them to the same period in the previous two years.

6 months to
14 May 2025
Same period 2024 Same period 2023
Rank 38 50 59
Rank change year-on-year +12 +9 -12
Permanent jobs citing Stakeholder Management 590 395 438
As % of all permanent jobs advertised in the North West 7.39% 4.01% 5.57%
As % of the Processes & Methodologies category 7.71% 4.84% 5.83%
Number of salaries quoted 371 281 279
10th Percentile £45,628 £32,500 £37,450
25th Percentile £52,500 £38,734 £45,000
Median annual salary (50th Percentile) £56,000 £52,500 £55,000
Median % change year-on-year +6.67% -4.55% +3.18%
75th Percentile £63,900 £68,750 £67,500
90th Percentile £77,500 £77,500 £83,000
England median annual salary £62,500 £62,500 £65,000
% change year-on-year - -3.85% +4.00%

All Process and Methodology Skills
North West

Stakeholder Management falls under the Processes and Methodologies category. For comparison with the information above, the following table provides summary statistics for all permanent job vacancies requiring process or methodology skills in the North West.

Permanent vacancies with a requirement for process or methodology skills 7,653 8,153 7,519
As % of all permanent jobs advertised in the North West 95.85% 82.81% 95.63%
Number of salaries quoted 4,004 6,185 3,939
10th Percentile £26,250 £27,500 £30,966
25th Percentile £40,000 £37,500 £41,250
Median annual salary (50th Percentile) £50,055 £50,000 £55,000
Median % change year-on-year +0.11% -9.09% +4.76%
75th Percentile £61,000 £65,000 £70,000
90th Percentile £77,500 £80,000 £82,500
England median annual salary £57,500 £55,000 £62,500
% change year-on-year +4.55% -12.00% +4.17%

Stakeholder Management
Job Vacancy Trend in the North West

Job postings citing Stakeholder Management as a proportion of all IT jobs advertised in the North West.
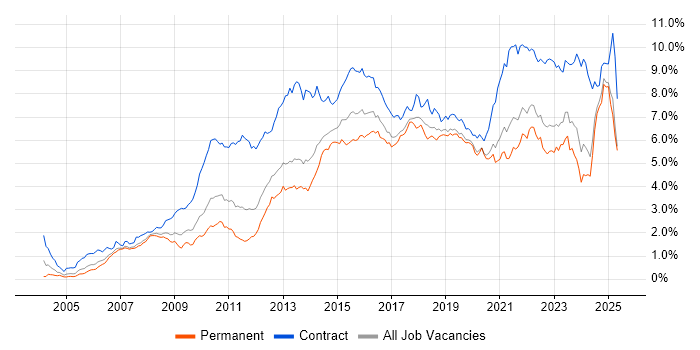
Job vacancy trend for Stakeholder Management in the North West

Stakeholder Management
Salary Trend in the North West

3-month moving average salary quoted in jobs citing Stakeholder Management in the North West.

Salary trend for Stakeholder Management in the North West

Stakeholder Management
Salary Histogram in the North West

Salary distribution for jobs citing Stakeholder Management in the North West over the 6 months to 14 May 2025.

Salary histogram for Stakeholder Management in the North West

Stakeholder Management
Job Locations in the North West

The table below looks at the demand and provides a guide to the median salaries quoted in IT jobs citing Stakeholder Management within the North West region over the 6 months to 14 May 2025. The 'Rank Change' column provides an indication of the change in demand within each location based on the same 6 month period last year.

Location Rank Change
on Same Period
Last Year
Matching
Permanent
IT Job Ads
Median Salary
Past 6 Months
Median Salary
% Change
on Same Period
Last Year
Live
Jobs
Cumbria -2 304 £56,000 +44.58% 9
Manchester +15 160 £66,934 +21.70% 162
Lancashire -20 99 £55,000 -8.33% 91
Merseyside +12 18 £75,000 +54.64% 19
Cheshire -50 7 £65,000 +44.44% 42
Stakeholder Management
England

Stakeholder Management
Co-occurring Skills and Capabilities in the North West by Category

The follow tables expand on the table above by listing co-occurrences grouped by category. The same employment type, locality and period is covered with up to 20 co-occurrences shown in each of the following categories:

Application Platforms
1 38 (6.44%) Confluence
2 4 (0.68%) SharePoint
3 2 (0.34%) IIS
3 2 (0.34%) nginx
4 1 (0.17%) Apache Airflow
4 1 (0.17%) Apache Spark
4 1 (0.17%) CMS
4 1 (0.17%) Moodle
Applications
1 44 (7.46%) Microsoft Office
2 15 (2.54%) Microsoft Excel
3 13 (2.20%) Microsoft PowerPoint
4 7 (1.19%) Microsoft Project
4 7 (1.19%) Trello
5 6 (1.02%) MS Visio
6 1 (0.17%) SPSS
Business Applications
1 5 (0.85%) NetSuite
1 5 (0.85%) Shopify
2 3 (0.51%) SAP S/4HANA
3 2 (0.34%) SAP SD
4 1 (0.17%) Infor SunSystems
4 1 (0.17%) Oracle Payroll
Cloud Services
1 31 (5.25%) Azure
2 16 (2.71%) AWS
3 15 (2.54%) Power Platform
4 13 (2.20%) Microsoft 365
5 5 (0.85%) Entra ID
5 5 (0.85%) GCP
6 3 (0.51%) Azure Data Factory
6 3 (0.51%) Azure Logic Apps
6 3 (0.51%) Nutanix
6 3 (0.51%) SaaS
7 2 (0.34%) Amazon EKS
7 2 (0.34%) Figma
7 2 (0.34%) GitHub
7 2 (0.34%) GitHub Actions
7 2 (0.34%) OCI
7 2 (0.34%) PowerApps
7 2 (0.34%) Serverless
8 1 (0.17%) Amazon EC2
8 1 (0.17%) Amazon S3
8 1 (0.17%) npm
Communications & Networking
1 3 (0.51%) Firewall
1 3 (0.51%) VPN
2 2 (0.34%) Cisco ISE
2 2 (0.34%) DHCP
2 2 (0.34%) DNS
2 2 (0.34%) Network Security
2 2 (0.34%) Reverse Proxy
2 2 (0.34%) SD-WAN
2 2 (0.34%) Software-Defined Networking
2 2 (0.34%) TACACS
2 2 (0.34%) WAN
3 1 (0.17%) BGP
3 1 (0.17%) Cisco ASA
3 1 (0.17%) Cisco Firepower
3 1 (0.17%) EIGRP
3 1 (0.17%) HSRP
3 1 (0.17%) Intranet
3 1 (0.17%) NAS
3 1 (0.17%) OSPF
3 1 (0.17%) SAN
Database & Business Intelligence
1 12 (2.03%) Power BI
2 5 (0.85%) Tableau
3 3 (0.51%) MongoDB
3 3 (0.51%) Redis
4 2 (0.34%) Azure SQL Database
4 2 (0.34%) Data Lake
4 2 (0.34%) Hazelcast
4 2 (0.34%) MySQL
5 1 (0.17%) BusinessObjects
5 1 (0.17%) Data Vault
5 1 (0.17%) Metadata
5 1 (0.17%) NoSQL
5 1 (0.17%) Oracle Exadata
5 1 (0.17%) PostgreSQL
5 1 (0.17%) Power Query
Development Applications
1 31 (5.25%) JIRA
2 9 (1.53%) Rational DOORS
3 3 (0.51%) Git
4 2 (0.34%) Jenkins
5 1 (0.17%) CircleCI
5 1 (0.17%) IBM UrbanCode
5 1 (0.17%) MLflow
5 1 (0.17%) Octopus Deploy
5 1 (0.17%) Team Foundation Server
5 1 (0.17%) TeamCity
5 1 (0.17%) Travis CI
General
1 133 (22.54%) Finance
2 105 (17.80%) Social Skills
3 91 (15.42%) Manufacturing
4 52 (8.81%) Analytical Skills
5 25 (4.24%) Presentation Skills
6 18 (3.05%) Financial Institution
7 17 (2.88%) Banking
8 16 (2.71%) Automotive
8 16 (2.71%) Aviation
9 15 (2.54%) Organisational Skills
9 15 (2.54%) Retail
10 14 (2.37%) Influencing Skills
11 10 (1.69%) Law
12 6 (1.02%) Inclusion and Diversity
13 5 (0.85%) Legal
14 4 (0.68%) Mandarin Language
15 3 (0.51%) Billing
15 3 (0.51%) Marketing
15 3 (0.51%) Public Sector
16 2 (0.34%) Documentation Skills
Job Titles
1 150 (25.42%) Project Manager
2 97 (16.44%) Delivery Project Manager
3 78 (13.22%) Senior
4 64 (10.85%) Engineering Manager
5 41 (6.95%) Principal Engineer
6 40 (6.78%) Lead
6 40 (6.78%) Principal Systems Engineer
6 40 (6.78%) Requirements Engineer
7 36 (6.10%) Senior Systems Engineer
7 36 (6.10%) Systems Engineer
8 31 (5.25%) Analyst
9 27 (4.58%) Delivery Manager
10 22 (3.73%) Business Manager
11 21 (3.56%) Security Engineer
12 20 (3.39%) Senior Security Engineer
13 18 (3.05%) Senior Manager
14 17 (2.88%) Senior Project Manager
15 16 (2.71%) Infrastructure Project Leader
15 16 (2.71%) Relationships Manager
15 16 (2.71%) Security Manager
Libraries, Frameworks & Software Standards
1 7 (1.19%) React
2 6 (1.02%) Node.js
3 5 (0.85%) Middleware
4 4 (0.68%) HTML
5 3 (0.51%) CSS
6 2 (0.34%) .NET
6 2 (0.34%) 802.1X
6 2 (0.34%) JSON
6 2 (0.34%) Kafka
6 2 (0.34%) Oracle Fusion
6 2 (0.34%) React Native
6 2 (0.34%) REST
6 2 (0.34%) WebSockets
7 1 (0.17%) CherryPy
7 1 (0.17%) Flask
7 1 (0.17%) GraphQL
7 1 (0.17%) J2EE
7 1 (0.17%) Jest
7 1 (0.17%) Spring
7 1 (0.17%) SQLAlchemy
Miscellaneous
1 32 (5.42%) Management Information System
2 16 (2.71%) Product Ownership
3 9 (1.53%) Credit Risk
4 8 (1.36%) Analytical Mindset
5 6 (1.02%) Social Media
6 4 (0.68%) Cyber Threat
6 4 (0.68%) Hybrid Cloud
6 4 (0.68%) Life Science
6 4 (0.68%) Operational Technology
7 3 (0.51%) Client/Server
8 2 (0.34%) Cloud Native
8 2 (0.34%) Clustering
8 2 (0.34%) Cyber Defence
8 2 (0.34%) Data Protection Act
8 2 (0.34%) FMCG
8 2 (0.34%) Security Posture
8 2 (0.34%) SWIFT Messaging Network
9 1 (0.17%) iSeries
9 1 (0.17%) Legacy Systems
9 1 (0.17%) Onboarding
Operating Systems
1 18 (3.05%) Windows
2 7 (1.19%) Windows Server
3 6 (1.02%) Windows Vista
4 5 (0.85%) Linux
5 2 (0.34%) CentOS
5 2 (0.34%) Windows Server 2016
6 1 (0.17%) Unix
6 1 (0.17%) zOS
Processes & Methodologies
1 188 (31.86%) Project Management
2 163 (27.63%) Systems Engineering
3 152 (25.76%) Project Delivery
4 115 (19.49%) Business Case
5 111 (18.81%) Agile
6 102 (17.29%) Risk Management
7 70 (11.86%) Validation
8 68 (11.53%) Business Strategy
9 64 (10.85%) Continuous Improvement
9 64 (10.85%) Verification and Validation
10 62 (10.51%) Project Planning
11 55 (9.32%) ERP
12 48 (8.14%) ITIL
12 48 (8.14%) Problem-Solving
13 45 (7.63%) Roadmaps
14 40 (6.78%) Budget Management
14 40 (6.78%) Operations Management
15 39 (6.61%) Product Strategy
15 39 (6.61%) Programme Management
16 36 (6.10%) Mathematics
Programming Languages
1 19 (3.22%) SQL
2 8 (1.36%) Python
3 4 (0.68%) JavaScript
3 4 (0.68%) R
3 4 (0.68%) TypeScript
4 2 (0.34%) ABAP
4 2 (0.34%) Data Analysis Expressions
4 2 (0.34%) Java
5 1 (0.17%) PowerShell
Qualifications
1 364 (61.69%) BPSS Clearance
2 195 (33.05%) Degree
3 58 (9.83%) Master's Degree
4 56 (9.49%) HNC
5 55 (9.32%) Chartered Engineer
6 23 (3.90%) PMP
7 16 (2.71%) APMP
8 15 (2.54%) HND
9 13 (2.20%) CRISC
10 10 (1.69%) DBS Check
11 7 (1.19%) Security Cleared
12 6 (1.02%) Computer Science Degree
12 6 (1.02%) PMI Certification
13 5 (0.85%) CISSP
14 4 (0.68%) Azure Certification
14 4 (0.68%) CISM
14 4 (0.68%) SC Cleared
15 3 (0.51%) AWS Certification
15 3 (0.51%) AWS Certified Solutions Architect
15 3 (0.51%) CBAP
Quality Assurance & Compliance
1 14 (2.37%) QA
2 9 (1.53%) COBIT
3 8 (1.36%) NIST
3 8 (1.36%) Sarbanes-Oxley
4 7 (1.19%) ISO/IEC 27001
5 5 (0.85%) Data Quality
5 5 (0.85%) GRC
5 5 (0.85%) ISO 20022
6 4 (0.68%) ITGC
6 4 (0.68%) PCI DSS
7 3 (0.51%) Cyber Essentials
7 3 (0.51%) Cyber Essentials PLUS
7 3 (0.51%) PMO
8 2 (0.34%) Accessibility
8 2 (0.34%) SEPA
9 1 (0.17%) P3O
System Software
1 6 (1.02%) Active Directory
1 6 (1.02%) VMware ESXi
2 3 (0.51%) Docker
3 2 (0.34%) VMware NSX
4 1 (0.17%) Hyper-V
4 1 (0.17%) VMware Infrastructure
Systems Management
1 5 (0.85%) Microsoft Intune
2 3 (0.51%) Kubernetes
2 3 (0.51%) Terraform
3 1 (0.17%) Ansible
3 1 (0.17%) Automic
3 1 (0.17%) Consul
3 1 (0.17%) Grafana
3 1 (0.17%) Rancher
Vendors
1 79 (13.39%) Microsoft
2 46 (7.80%) SAP
3 32 (5.42%) Atlassian
4 10 (1.69%) Oracle
5 9 (1.53%) ServiceNow
6 7 (1.19%) Avaloq
6 7 (1.19%) VMware
7 6 (1.02%) Salesforce
8 5 (0.85%) Facebook
8 5 (0.85%) Liquidlogic
9 4 (0.68%) Veeam
10 3 (0.51%) Cisco
10 3 (0.51%) Hitachi
11 2 (0.34%) Bloomberg
11 2 (0.34%) IBM
11 2 (0.34%) iManage
11 2 (0.34%) Intapp
11 2 (0.34%) Sage
11 2 (0.34%) Workday
12 1 (0.17%) Sparx