Stakeholder Management Jobs in England

Stakeholder Management
UK > England

The table below provides summary statistics for permanent job vacancies advertised in England requiring Stakeholder Management skills. It includes a benchmarking guide to the annual salaries offered in vacancies that cited Stakeholder Management over the 6 months leading up to 30 May 2025, comparing them to the same period in the previous two years.

6 months to
30 May 2025
Same period 2024 Same period 2023
Rank 44 55 45
Rank change year-on-year +11 -10 +7
Permanent jobs citing Stakeholder Management 2,706 3,466 5,145
As % of all permanent jobs advertised in England 5.53% 3.87% 5.96%
As % of the Processes & Methodologies category 5.88% 4.61% 6.23%
Number of salaries quoted 1,506 2,558 3,164
10th Percentile £42,500 £38,250 £42,500
25th Percentile £53,188 £46,250 £52,500
Median annual salary (50th Percentile) £63,900 £62,500 £65,000
Median % change year-on-year +2.24% -3.85% +4.00%
75th Percentile £85,000 £80,000 £86,250
90th Percentile £105,000 £95,000 £105,000
UK median annual salary £65,000 £62,500 £65,000
% change year-on-year +4.00% -3.85% +4.00%

All Process and Methodology Skills
England

Stakeholder Management falls under the Processes and Methodologies category. For comparison with the information above, the following table provides summary statistics for all permanent job vacancies requiring process or methodology skills in England.

Permanent vacancies with a requirement for process or methodology skills 46,039 75,199 82,570
As % of all permanent jobs advertised in England 94.03% 84.05% 95.58%
Number of salaries quoted 22,875 54,702 49,146
10th Percentile £29,500 £29,000 £34,452
25th Percentile £41,250 £40,000 £46,000
Median annual salary (50th Percentile) £57,500 £55,000 £62,500
Median % change year-on-year +4.55% -12.00% +4.17%
75th Percentile £75,000 £72,500 £82,500
90th Percentile £97,528 £93,750 £102,500
UK median annual salary £57,443 £55,000 £60,899
% change year-on-year +4.44% -9.69% +1.50%

Stakeholder Management
Job Vacancy Trend in England

Job postings citing Stakeholder Management as a proportion of all IT jobs advertised in England.
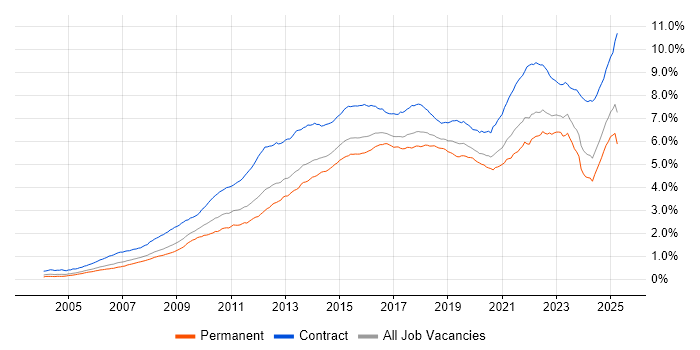
Job vacancy trend for Stakeholder Management in England

Stakeholder Management
Salary Trend in England

3-month moving average salary quoted in jobs citing Stakeholder Management in England.

Salary trend for Stakeholder Management in England

Stakeholder Management
Salary Histogram in England

Salary distribution for jobs citing Stakeholder Management in England over the 6 months to 30 May 2025.

Salary histogram for Stakeholder Management in England

Stakeholder Management
Job Locations in England

The table below looks at the demand and provides a guide to the median salaries quoted in IT jobs citing Stakeholder Management within the England region over the 6 months to 30 May 2025. The 'Rank Change' column provides an indication of the change in demand within each location based on the same 6 month period last year.

Location Rank Change
on Same Period
Last Year
Matching
Permanent
IT Job Ads
Median Salary
Past 6 Months
Median Salary
% Change
on Same Period
Last Year
Live
Jobs
London +17 903 £82,500 +10.00% 1,194
North of England +4 710 £58,500 +1.74% 1,556
North West +10 517 £58,500 +8.33% 777
South East +49 462 £61,000 +6.09% 2,264
Midlands -4 298 £59,000 +9.26% 1,282
West Midlands +5 214 £55,000 - 697
Yorkshire -1 169 £61,250 +1.29% 594
South West +32 160 £60,000 +4.35% 756
East of England -26 107 £60,000 +11.11% 968
East Midlands -12 84 £60,000 +11.11% 504
North East +12 24 £45,000 -22.37% 190
Stakeholder Management
UK

Stakeholder Management
Co-occurring Skills and Capabilities in England by Category

The follow tables expand on the table above by listing co-occurrences grouped by category. The same employment type, locality and period is covered with up to 20 co-occurrences shown in each of the following categories:

Application Platforms
1 153 (5.65%) Confluence
2 68 (2.51%) SharePoint
3 17 (0.63%) CMS
4 15 (0.55%) Apache Spark
5 10 (0.37%) SAS
6 6 (0.22%) Drupal
7 5 (0.18%) Microsoft Exchange
8 4 (0.15%) Apache Airflow
8 4 (0.15%) WordPress
9 3 (0.11%) IIS
10 2 (0.074%) Apache
10 2 (0.074%) CoreMedia CMS
10 2 (0.074%) Moodle
10 2 (0.074%) nginx
10 2 (0.074%) Oracle Workflow
10 2 (0.074%) ThingWorx
10 2 (0.074%) Umbraco
11 1 (0.037%) Appian
11 1 (0.037%) Kentico
11 1 (0.037%) Mendix
Applications
1 179 (6.61%) Microsoft Office
2 104 (3.84%) Microsoft Excel
3 53 (1.96%) Microsoft PowerPoint
4 49 (1.81%) Microsoft Project
5 20 (0.74%) MS Visio
6 10 (0.37%) Spreadsheet
7 9 (0.33%) Trello
8 4 (0.15%) AutoCAD
9 3 (0.11%) Productboard
10 2 (0.074%) Adobe Captivate
10 2 (0.074%) Chatbot
10 2 (0.074%) SPSS
11 1 (0.037%) ProjectWise
Business Applications
1 25 (0.92%) Dynamics CRM
2 24 (0.89%) NetSuite
3 23 (0.85%) SAP FI
4 20 (0.74%) SAP S/4HANA
5 16 (0.59%) OpenText VIM for SAP
6 11 (0.41%) Salesforce CRM
7 10 (0.37%) Oracle ERP
7 10 (0.37%) Shopify
8 7 (0.26%) SAP CO
8 7 (0.26%) SAP FI/CO
9 5 (0.18%) Dynamics AX
9 5 (0.18%) Elite 3E
9 5 (0.18%) Sparx Enterprise Architect
10 4 (0.15%) Oracle Payroll
11 3 (0.11%) Aladdin
11 3 (0.11%) Distributed Ledger
11 3 (0.11%) Dynamics NAV
11 3 (0.11%) Infor M3
11 3 (0.11%) SAP SD
11 3 (0.11%) Workday HCM
Cloud Services
1 398 (14.71%) Azure
2 221 (8.17%) AWS
3 193 (7.13%) Power Platform
4 125 (4.62%) GCP
5 85 (3.14%) Miro
5 85 (3.14%) SaaS
6 74 (2.73%) Asana
7 64 (2.37%) Microsoft 365
8 61 (2.25%) Dynamics 365
9 38 (1.40%) Snowflake
10 37 (1.37%) Power Automate
11 36 (1.33%) Azure DevOps
11 36 (1.33%) Entra ID
12 35 (1.29%) PowerApps
13 30 (1.11%) GitHub
14 27 (1.00%) Azure Data Factory
15 26 (0.96%) Salesforce Sales Cloud
16 19 (0.70%) Azure Synapse Analytics
16 19 (0.70%) Serverless
17 17 (0.63%) Google Workspace
Communications & Networking
1 73 (2.70%) Broadband
2 47 (1.74%) Firewall
3 25 (0.92%) WAN
4 24 (0.89%) VPN
5 23 (0.85%) Network Security
6 15 (0.55%) DNS
6 15 (0.55%) LAN
7 13 (0.48%) BGP
8 12 (0.44%) VLAN
9 11 (0.41%) Wireless
10 10 (0.37%) SSL
11 9 (0.33%) SD-WAN
11 9 (0.33%) TCP/IP
12 8 (0.30%) Wi-Fi
13 7 (0.26%) DHCP
13 7 (0.26%) OSPF
14 5 (0.18%) Intranet
14 5 (0.18%) Intrusion Detection
15 4 (0.15%) Reverse Proxy
15 4 (0.15%) Software-Defined Networking
Database & Business Intelligence
1 180 (6.65%) Power BI
2 77 (2.85%) Data Lake
3 76 (2.81%) Tableau
4 75 (2.77%) Data Warehouse
5 38 (1.40%) Big Data
6 37 (1.37%) Metadata
7 27 (1.00%) SQL Server
8 22 (0.81%) PostgreSQL
9 21 (0.78%) SQL Server Reporting Services
10 20 (0.74%) Relational Database
11 19 (0.70%) Azure SQL Database
11 19 (0.70%) NoSQL
12 15 (0.55%) SQL Server Integration Services
13 14 (0.52%) MongoDB
13 14 (0.52%) MySQL
14 12 (0.44%) BigQuery
15 11 (0.41%) Amazon Redshift
16 10 (0.37%) Hadoop
17 8 (0.30%) Looker
18 7 (0.26%) Amazon RDS
Development Applications
1 207 (7.65%) JIRA
2 135 (4.99%) Rational DOORS
3 24 (0.89%) Git
4 20 (0.74%) GitLab
5 16 (0.59%) Jenkins
6 8 (0.30%) webpack
7 6 (0.22%) CircleCI
7 6 (0.22%) Grunt
7 6 (0.22%) Jasmine
7 6 (0.22%) Mocha
8 5 (0.18%) ERwin
8 5 (0.18%) Selenium
9 4 (0.15%) Cucumber
9 4 (0.15%) JUnit
9 4 (0.15%) Maven
9 4 (0.15%) Mockito
9 4 (0.15%) SonarQube
9 4 (0.15%) SQL Server Management Studio (SSMS)
9 4 (0.15%) Visual Studio
10 3 (0.11%) Appium
General
1 1,024 (37.84%) Social Skills
2 947 (35.00%) Finance
3 428 (15.82%) Analytical Skills
4 268 (9.90%) Law
5 175 (6.47%) Influencing Skills
6 167 (6.17%) Banking
7 139 (5.14%) Legal
8 127 (4.69%) Marketing
9 118 (4.36%) Manufacturing
10 117 (4.32%) Inclusion and Diversity
11 112 (4.14%) Presentation Skills
12 110 (4.07%) Public Sector
13 97 (3.58%) Retail
14 81 (2.99%) Financial Institution
15 77 (2.85%) Organisational Skills
16 41 (1.52%) Documentation Skills
17 33 (1.22%) Local Government
18 26 (0.96%) Automotive
19 25 (0.92%) Front Office
20 23 (0.85%) Aviation
Job Titles
1 391 (14.45%) Analyst
2 366 (13.53%) Senior
3 332 (12.27%) Lead
4 312 (11.53%) Project Manager
5 211 (7.80%) Engineering Manager
6 199 (7.35%) Architect
7 135 (4.99%) Requirements Manager
8 128 (4.73%) Business Analyst
9 109 (4.03%) IT Manager
10 107 (3.95%) Delivery Project Manager
11 102 (3.77%) Senior Manager
12 95 (3.51%) Solutions Architect
13 77 (2.85%) Delivery Manager
13 77 (2.85%) Product Analyst
14 72 (2.66%) Developer
15 71 (2.62%) Senior Analyst
16 69 (2.55%) Consultant
17 58 (2.14%) Product Manager
18 57 (2.11%) Risk Manager
19 55 (2.03%) Programme Manager
Libraries, Frameworks & Software Standards
1 56 (2.07%) REST
2 47 (1.74%) Middleware
3 43 (1.59%) .NET
4 39 (1.44%) SOAP
5 35 (1.29%) CSS
6 32 (1.18%) React
7 31 (1.15%) AngularJS
7 31 (1.15%) HTML
8 27 (1.00%) Lightning Web Components
9 20 (0.74%) Kafka
10 16 (0.59%) .NET Core
10 16 (0.59%) Node.js
10 16 (0.59%) Oracle Fusion
10 16 (0.59%) Spring
11 15 (0.55%) ARM Templates
12 13 (0.48%) EDI
12 13 (0.48%) Spring Boot
13 12 (0.44%) RESTful
14 11 (0.41%) Bootstrap
14 11 (0.41%) OAuth
Miscellaneous
1 216 (7.98%) Product Ownership
2 140 (5.17%) Management Information System
3 116 (4.29%) Self-Motivation
4 72 (2.66%) Over-the-Top Content
4 72 (2.66%) Video\Live Streaming
5 60 (2.22%) Onboarding
6 52 (1.92%) Cloud Native
7 49 (1.81%) Legacy Systems
8 45 (1.66%) Analytical Mindset
9 42 (1.55%) Enterprise Software
10 37 (1.37%) Credit Risk
11 29 (1.07%) Virtual Team
12 27 (1.00%) Data Centre
12 27 (1.00%) Public Cloud
13 25 (0.92%) Derivative
14 24 (0.89%) Mobile App
14 24 (0.89%) NHS
15 21 (0.78%) Data Protection Act
16 19 (0.70%) Hybrid Cloud
17 17 (0.63%) Security Posture
Operating Systems
1 56 (2.07%) Windows
2 25 (0.92%) Linux
3 14 (0.52%) Windows Server
4 7 (0.26%) Android
4 7 (0.26%) Apple iOS
5 6 (0.22%) Windows Vista
5 6 (0.22%) zOS
6 4 (0.15%) CentOS
7 3 (0.11%) Red Hat Enterprise Linux
7 3 (0.11%) Unix
8 2 (0.074%) Mac OS
8 2 (0.074%) VMS
8 2 (0.074%) Windows 10
8 2 (0.074%) Windows Server 2016
9 1 (0.037%) Debian
9 1 (0.037%) Kali Linux
9 1 (0.037%) Solaris
9 1 (0.037%) Ubuntu
Processes & Methodologies
1 828 (30.60%) Agile
2 588 (21.73%) Project Management
3 472 (17.44%) Roadmaps
4 470 (17.37%) Problem-Solving
5 399 (14.75%) Project Delivery
6 396 (14.63%) Risk Management
7 384 (14.19%) Continuous Improvement
8 344 (12.71%) Analytics
9 290 (10.72%) Validation
10 286 (10.57%) Decision-Making
11 269 (9.94%) Systems Engineering
12 258 (9.53%) Mentoring
13 231 (8.54%) Business Intelligence
14 218 (8.06%) DevOps
15 205 (7.58%) Business Strategy
16 204 (7.54%) Change Management
17 201 (7.43%) Verification and Validation
18 197 (7.28%) Coaching
19 196 (7.24%) CRM
20 174 (6.43%) Computer Science
Programming Languages
1 241 (8.91%) SQL
2 183 (6.76%) Python
3 80 (2.96%) Java
4 61 (2.25%) JavaScript
5 46 (1.70%) C#
6 33 (1.22%) R
7 31 (1.15%) TypeScript
8 28 (1.03%) Apex Code
9 27 (1.00%) PowerShell
10 20 (0.74%) Data Analysis Expressions
11 15 (0.55%) Scala
12 13 (0.48%) Go
12 13 (0.48%) T-SQL
13 11 (0.41%) Bash
13 11 (0.41%) VBA
14 7 (0.26%) C++
15 6 (0.22%) PHP
15 6 (0.22%) Swift
16 3 (0.11%) JCL
16 3 (0.11%) Kotlin
Qualifications
1 528 (19.51%) Degree
2 436 (16.11%) BPSS Clearance
3 131 (4.84%) Master's Degree
4 98 (3.62%) Computer Science Degree
5 96 (3.55%) Security Cleared
6 86 (3.18%) PMP
7 79 (2.92%) CISSP
8 65 (2.40%) PMI Certification
9 63 (2.33%) SC Cleared
10 61 (2.25%) DBS Check
11 59 (2.18%) CRISC
12 56 (2.07%) Chartered Engineer
13 55 (2.03%) CISM
14 37 (1.37%) Azure Certification
15 22 (0.81%) AWS Certification
16 20 (0.74%) APMP
17 18 (0.67%) DV Cleared
17 18 (0.67%) HND
18 17 (0.63%) CBAP
18 17 (0.63%) CISA
Quality Assurance & Compliance
1 114 (4.21%) QA
2 108 (3.99%) Data Quality
3 85 (3.14%) Accessibility
4 76 (2.81%) ISO/IEC 27001
5 59 (2.18%) GDPR
6 56 (2.07%) PMO
7 52 (1.92%) NIST
8 34 (1.26%) GRC
9 22 (0.81%) Sarbanes-Oxley
10 21 (0.78%) PCI DSS
11 20 (0.74%) COBIT
11 20 (0.74%) SOC 2
12 19 (0.70%) Cyber Essentials
12 19 (0.70%) ITGC
13 18 (0.67%) California Consumer Privacy Act
13 18 (0.67%) SLA
14 14 (0.52%) Cyber Essentials PLUS
15 11 (0.41%) ISO 20022
16 10 (0.37%) Actionable Recommendations
17 8 (0.30%) HIPAA
System Software
1 59 (2.18%) Docker
2 37 (1.37%) Active Directory
3 14 (0.52%) VMware Infrastructure
4 8 (0.30%) VMware ESXi
5 4 (0.15%) Hyper-V
6 3 (0.11%) Postfix
7 2 (0.074%) Firmware
7 2 (0.074%) ProxySG
7 2 (0.074%) Virtual Machines
7 2 (0.074%) VMware NSX
8 1 (0.037%) KVM
8 1 (0.037%) NFS
Systems Management
1 65 (2.40%) Kubernetes
2 54 (2.00%) Terraform
3 20 (0.74%) Microsoft Intune
4 17 (0.63%) Ansible
4 17 (0.63%) Grafana
5 9 (0.33%) Single Sign-On
6 7 (0.26%) FortiGate
7 6 (0.22%) Jamf Pro
7 6 (0.22%) Prometheus
8 5 (0.18%) CASB
8 5 (0.18%) CSIRT
9 2 (0.074%) Argo
9 2 (0.074%) Consul
9 2 (0.074%) Graylog
9 2 (0.074%) Kibana
9 2 (0.074%) logstash
10 1 (0.037%) Nessus
10 1 (0.037%) Plesk
10 1 (0.037%) Progress Chef
10 1 (0.037%) SCCM
Vendors
1 447 (16.52%) Microsoft
2 204 (7.54%) Salesforce
3 130 (4.80%) SAP
4 85 (3.14%) Google
5 76 (2.81%) ServiceNow
6 63 (2.33%) Oracle
7 37 (1.37%) Atlassian
8 30 (1.11%) Cisco
9 29 (1.07%) Avaloq
10 27 (1.00%) Databricks
11 25 (0.92%) VMware
12 24 (0.89%) Salesforce Marketing Cloud
13 19 (0.70%) Workday
14 17 (0.63%) IBM
15 14 (0.52%) Adobe
15 14 (0.52%) Hitachi
16 12 (0.44%) Meraki
17 11 (0.41%) Ariba
17 11 (0.41%) Fortinet
18 10 (0.37%) Guidewire