Mentoring Jobs in Scotland

Mentorship
UK > Scotland

The table below provides summary statistics for permanent job vacancies advertised in Scotland requiring Mentoring skills. It includes a benchmarking guide to the annual salaries offered in vacancies that cited Mentoring over the 6 months leading up to 26 July 2024, comparing them to the same period in the previous two years.

6 months to
26 Jul 2024
Same period 2023 Same period 2022
Rank 42 13 17
Rank change year-on-year -29 +4 +4
Permanent jobs citing Mentoring 409 559 680
As % of all permanent jobs advertised in Scotland 7.18% 14.73% 11.17%
As % of the Processes & Methodologies category 8.17% 15.36% 12.09%
Number of salaries quoted 181 169 352
10th Percentile £24,000 £34,350 £38,849
25th Percentile £42,000 £52,500 £47,447
Median annual salary (50th Percentile) £54,000 £70,000 £61,000
Median % change year-on-year -22.86% +14.75% +10.91%
75th Percentile £72,433 £84,056 £78,750
90th Percentile £82,500 £97,500 £92,500
UK median annual salary £61,206 £68,000 £65,000
% change year-on-year -9.99% +4.62% +4.00%

All Process and Methodology Skills
Scotland

Mentoring falls under the Processes and Methodologies category. For comparison with the information above, the following table provides summary statistics for all permanent job vacancies requiring process or methodology skills in Scotland.

Permanent vacancies with a requirement for process or methodology skills 5,004 3,640 5,626
As % of all permanent jobs advertised in Scotland 87.82% 95.94% 92.38%
Number of salaries quoted 2,133 1,969 3,041
10th Percentile £31,250 £31,555 £31,250
25th Percentile £41,250 £41,250 £41,250
Median annual salary (50th Percentile) £54,000 £55,000 £55,000
Median % change year-on-year -1.82% - +15.79%
75th Percentile £67,500 £71,250 £70,000
90th Percentile £80,000 £82,548 £83,750
UK median annual salary £55,000 £60,000 £60,000
% change year-on-year -8.33% - +9.09%

Mentoring
Job Vacancy Trend in Scotland

Job postings citing Mentoring as a proportion of all IT jobs advertised in Scotland.
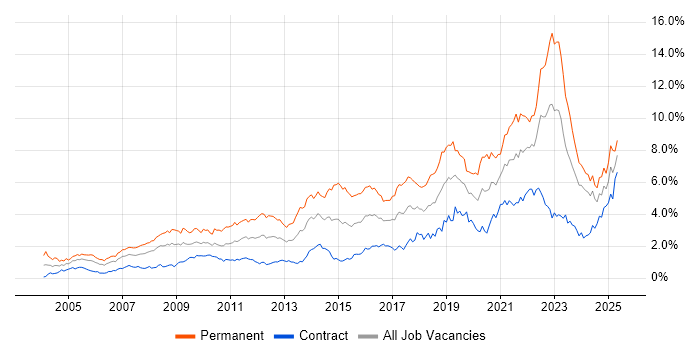
Job vacancy trend for Mentoring in Scotland

Mentoring
Salary Trend in Scotland

3-month moving average salary quoted in jobs citing Mentoring in Scotland.

Salary trend for Mentoring in Scotland

Mentoring
Salary Histogram in Scotland

Salary distribution for jobs citing Mentoring in Scotland over the 6 months to 26 July 2024.

Salary histogram for Mentoring in Scotland

Mentoring
Job Locations in Scotland

The table below looks at the demand and provides a guide to the median salaries quoted in IT jobs citing Mentoring within the Scotland region over the 6 months to 26 July 2024. The 'Rank Change' column provides an indication of the change in demand within each location based on the same 6 month period last year.

Location Rank Change
on Same Period
Last Year
Matching
Permanent
IT Job Ads
Median Salary
Past 6 Months
Median Salary
% Change
on Same Period
Last Year
Live
Jobs
Glasgow -41 270 £50,000 -23.08% 40
Edinburgh -14 98 £65,000 -10.60% 18
Aberdeen -13 17 £52,500 -19.23% 5
Highlands - 5 - - 1
Dundee -10 4 £55,000 -31.25% 3
West Lothian - 4 £28,500 - 1
South Lanarkshire - 3 £80,000 -
Lanarkshire -10 2 - - 31
Argyll and Bute - 2 £62,500 - 4
Stirling -5 1 £45,000 +309.09% 2
Perthshire - 1 £90,000 - 1
Mentoring
UK

Mentoring
Co-occurring Skills and Capabilities in Scotland by Category

The follow tables expand on the table above by listing co-occurrences grouped by category. The same employment type, locality and period is covered with up to 20 co-occurrences shown in each of the following categories:

Application Platforms
1 66 (16.14%) Apache Spark
2 34 (8.31%) Apache Airflow
3 19 (4.65%) Confluence
4 8 (1.96%) WildFly
5 6 (1.47%) SharePoint
6 3 (0.73%) Umbraco
7 2 (0.49%) Microsoft Exchange
Applications
1 15 (3.67%) Sketch
2 9 (2.20%) Microsoft Excel
3 7 (1.71%) UserZoom
4 3 (0.73%) InVision
5 1 (0.24%) Microsoft Office
Business Applications
1 4 (0.98%) Sonata
Cloud Services
1 158 (38.63%) AWS
2 74 (18.09%) Azure
3 39 (9.54%) GCP
4 22 (5.38%) Figma
5 16 (3.91%) IaaS
5 16 (3.91%) PaaS
6 15 (3.67%) Amazon ECS
6 15 (3.67%) Datadog
7 9 (2.20%) Microsoft 365
8 8 (1.96%) SaaS
9 7 (1.71%) SurveyMonkey
10 6 (1.47%) Cloud Computing
10 6 (1.47%) dbt
10 6 (1.47%) GitHub
11 5 (1.22%) AWS CloudFormation
12 4 (0.98%) Amazon Ads
12 4 (0.98%) Google Ads
12 4 (0.98%) Google Analytics
12 4 (0.98%) Serverless
13 3 (0.73%) Kong
Communications & Networking
1 17 (4.16%) Firewall
2 15 (3.67%) SD-WAN
3 12 (2.93%) VPN
3 12 (2.93%) WAN
4 7 (1.71%) Wireless
5 2 (0.49%) Internet
6 1 (0.24%) Broadband
6 1 (0.24%) iSCSI
6 1 (0.24%) NGFW
6 1 (0.24%) Remote Desktop
6 1 (0.24%) RSVP
6 1 (0.24%) SAN
6 1 (0.24%) Skype
6 1 (0.24%) TCP/IP
6 1 (0.24%) VoIP
Database & Business Intelligence
1 69 (16.87%) Big Data
2 33 (8.07%) NoSQL
3 24 (5.87%) SQL Server
4 17 (4.16%) Relational Database
5 10 (2.44%) BigQuery
5 10 (2.44%) Looker
6 9 (2.20%) Data Warehouse
6 9 (2.20%) SQL Server Integration Services
6 9 (2.20%) SQL Server Reporting Services
7 5 (1.22%) OLAP
7 5 (1.22%) SQL Server Analysis Services
8 3 (0.73%) Azure SQL Database
8 3 (0.73%) Power BI
9 2 (0.49%) PostgreSQL
9 2 (0.49%) SQLite
10 1 (0.24%) Amazon RDS
10 1 (0.24%) Apache Cassandra
10 1 (0.24%) Data Lake
10 1 (0.24%) Elasticsearch
10 1 (0.24%) MongoDB
Development Applications
1 40 (9.78%) JIRA
2 39 (9.54%) Jenkins
3 22 (5.38%) GitLab
4 19 (4.65%) Git
5 10 (2.44%) CircleCI
6 8 (1.96%) Selenium
7 7 (1.71%) Cucumber
8 5 (1.22%) Visual Studio
9 4 (0.98%) Sonatype Nexus
9 4 (0.98%) Spinnaker
10 3 (0.73%) GoCD
11 2 (0.49%) Cypress.io
11 2 (0.49%) Gradle
11 2 (0.49%) Maven
11 2 (0.49%) SonarQube
11 2 (0.49%) Terragrunt
12 1 (0.24%) Gatling
12 1 (0.24%) IBM UrbanCode
12 1 (0.24%) Oracle Forms
12 1 (0.24%) webpack
General
1 189 (46.21%) Inclusion and Diversity
2 188 (45.97%) Finance
3 156 (38.14%) Law
4 148 (36.19%) Marketing
5 79 (19.32%) Social Skills
6 33 (8.07%) Financial Institution
7 32 (7.82%) Influencing Skills
8 16 (3.91%) Manufacturing
9 14 (3.42%) Analytical Skills
10 10 (2.44%) Retail
11 7 (1.71%) Electronics
11 7 (1.71%) Telecoms
12 6 (1.47%) Banking
12 6 (1.47%) Pharmaceutical
12 6 (1.47%) Retail Banking
12 6 (1.47%) Tech for Good
13 5 (1.22%) Public Sector
14 3 (0.73%) Polish Language
15 2 (0.49%) Legal
16 1 (0.24%) Aerospace
Job Titles
1 123 (30.07%) Lead
2 74 (18.09%) Software Engineer
3 53 (12.96%) Senior
4 51 (12.47%) Lead Software Engineer
5 46 (11.25%) Data Engineer
6 40 (9.78%) Developer
7 35 (8.56%) Lead Data Engineer
8 34 (8.31%) Big Data Engineer
8 34 (8.31%) Big Data Software Engineer
8 34 (8.31%) Lead Big Data Engineer
8 34 (8.31%) Python Engineer
8 34 (8.31%) Python Software Engineer
9 32 (7.82%) Big Data Manager
9 32 (7.82%) Engineering Manager
9 32 (7.82%) Software Engineering Manager
10 28 (6.85%) Architect
11 24 (5.87%) Junior
12 17 (4.16%) Services Director
13 14 (3.42%) Cloud Engineer
13 14 (3.42%) UI Engineer
Libraries, Frameworks & Software Standards
1 47 (11.49%) Spring
2 44 (10.76%) Spring Boot
3 37 (9.05%) .NET
4 34 (8.31%) PySpark
4 34 (8.31%) React
5 28 (6.85%) AngularJS
6 24 (5.87%) Node.js
7 22 (5.38%) CSS
7 22 (5.38%) HTML
8 17 (4.16%) Vue
9 14 (3.42%) DOM
9 14 (3.42%) Web Services
10 9 (2.20%) REST
10 9 (2.20%) SOAP
11 8 (1.96%) ASP.NET
11 8 (1.96%) Java EE
11 8 (1.96%) OpenJDK
12 7 (1.71%) .NET Framework
12 7 (1.71%) Django
12 7 (1.71%) Kafka
Miscellaneous
1 60 (14.67%) Cloud Native
2 45 (11.00%) Public Cloud
3 26 (6.36%) Product Ownership
4 16 (3.91%) Management Information System
5 15 (3.67%) Algorithms
5 15 (3.67%) Data Structures
5 15 (3.67%) Self-Motivation
6 13 (3.18%) Replication
7 12 (2.93%) Data Centre
7 12 (2.93%) Legacy Systems
8 11 (2.69%) Mobile App
9 6 (1.47%) Private Cloud
10 5 (1.22%) Greenfield Project
11 4 (0.98%) Renewable Energy
12 3 (0.73%) Enterprise Software
12 3 (0.73%) Graphic Design
13 2 (0.49%) FPGA
13 2 (0.49%) IoT
13 2 (0.49%) VHDL
13 2 (0.49%) Video Conferencing
Operating Systems
1 27 (6.60%) Linux
2 21 (5.13%) Windows
3 14 (3.42%) Windows Server
4 12 (2.93%) Unix
5 5 (1.22%) Android
6 3 (0.73%) Apple iOS
Processes & Methodologies
1 194 (47.43%) Agile
2 161 (39.36%) Coaching
3 154 (37.65%) Software Engineering
4 126 (30.81%) CI/CD
5 114 (27.87%) SDLC
6 99 (24.21%) DevOps
7 67 (16.38%) Community of Practice
8 66 (16.14%) Continuous Delivery
9 65 (15.89%) Operational Stability
10 54 (13.20%) Analytics
11 51 (12.47%) Problem-Solving
12 44 (10.76%) User Experience
13 38 (9.29%) Strategic Thinking
14 37 (9.05%) Performance Tuning
15 35 (8.56%) Roadmaps
15 35 (8.56%) UX Design
16 34 (8.31%) Continuous Integration
17 31 (7.58%) TDD
18 29 (7.09%) Continuous Improvement
18 29 (7.09%) Product Backlog
Programming Languages
1 93 (22.74%) Java
2 75 (18.34%) Python
3 55 (13.45%) SQL
4 39 (9.54%) JavaScript
5 34 (8.31%) C#
5 34 (8.31%) Scala
6 26 (6.36%) TypeScript
7 13 (3.18%) T-SQL
8 10 (2.44%) C
8 10 (2.44%) Embedded C
9 8 (1.96%) Shell Script
10 5 (1.22%) Bash
10 5 (1.22%) C++
10 5 (1.22%) Groovy
10 5 (1.22%) VBA
11 4 (0.98%) Kotlin
11 4 (0.98%) PL/SQL
11 4 (0.98%) PowerShell
12 2 (0.49%) R
12 2 (0.49%) Swift
Qualifications
1 62 (15.16%) Degree
2 17 (4.16%) CCNA
2 17 (4.16%) Cisco Certification
3 15 (3.67%) Security Cleared
4 12 (2.93%) Computer Science Degree
5 11 (2.69%) SC Cleared
6 6 (1.47%) Azure Certification
7 5 (1.22%) Master's Degree
8 4 (0.98%) AWS Certification
9 3 (0.73%) Network+ Certification
10 2 (0.49%) CISSP
10 2 (0.49%) Microsoft Certification
11 1 (0.24%) MCSA
11 1 (0.24%) Numerate Degree
11 1 (0.24%) OCP
11 1 (0.24%) Oracle Certification
11 1 (0.24%) PMI Certification
11 1 (0.24%) PMP
11 1 (0.24%) VMware Certified Professional (VCP)
Quality Assurance & Compliance
1 35 (8.56%) QA
2 18 (4.40%) Accessibility
3 9 (2.20%) GDPR
4 7 (1.71%) Actionable Recommendations
5 6 (1.47%) GMP
6 4 (0.98%) DICOM
6 4 (0.98%) HL7
6 4 (0.98%) ISO 13485
7 3 (0.73%) NIST
7 3 (0.73%) PMO
7 3 (0.73%) WCAG
8 1 (0.24%) Data Quality
System Software
1 37 (9.05%) Docker
2 14 (3.42%) Embedded Firmware
2 14 (3.42%) Firmware
3 13 (3.18%) VMware Infrastructure
4 12 (2.93%) VMware NSX
5 3 (0.73%) Active Directory
6 1 (0.24%) Hyper-V
6 1 (0.24%) Virtual Desktop
6 1 (0.24%) vSphere
Systems Management
1 40 (9.78%) Terraform
2 39 (9.54%) Kubernetes
3 22 (5.38%) Ansible
4 17 (4.16%) Prometheus
5 15 (3.67%) Grafana
6 12 (2.93%) FortiGate
7 5 (1.22%) Microsoft Intune
8 4 (0.98%) Progress Chef
8 4 (0.98%) Puppet
9 3 (0.73%) Fortio
9 3 (0.73%) Istio
9 3 (0.73%) Kiali
10 2 (0.49%) ZABBIX
Vendors
1 34 (8.31%) Google
2 20 (4.89%) Microsoft
2 20 (4.89%) ServiceNow
3 17 (4.16%) Cisco
4 16 (3.91%) Dynatrace
5 15 (3.67%) Splunk
6 13 (3.18%) VMware
7 12 (2.93%) NetApp
8 7 (1.71%) Oracle
8 7 (1.71%) Qualtrics
9 4 (0.98%) Sybase
10 3 (0.73%) Atlassian
11 2 (0.49%) Altera
11 2 (0.49%) Black Duck
11 2 (0.49%) CyberArk
11 2 (0.49%) CyberTech
11 2 (0.49%) HubSpot
11 2 (0.49%) Intel
11 2 (0.49%) Optimizely
11 2 (0.49%) Sitecore