Java Jobs in Scotland

Java
UK > Scotland

The following table provides summary statistics for permanent job vacancies advertised in Scotland with a requirement for Java skills. Included is a benchmarking guide to the salaries offered in vacancies that have cited Java over the 6 months to 7 December 2023 with a comparison to the same period in the previous 2 years.

6 months to
7 Dec 2023
Same period 2022 Same period 2021
Rank 7 8 6
Rank change year-on-year +1 -2 0
Permanent jobs citing Java 487 829 763
As % of all permanent jobs advertised in Scotland 16.45% 16.81% 16.57%
As % of the Programming Languages category 38.84% 34.73% 32.59%
Number of salaries quoted 226 437 411
10th Percentile £32,500 £39,837 £36,250
25th Percentile £43,093 £51,250 £42,500
Median annual salary (50th Percentile) £66,000 £65,000 £52,500
Median % change year-on-year +1.54% +23.81% +5.00%
75th Percentile £77,715 £77,715 £68,750
90th Percentile £89,717 £92,500 £80,000
UK median annual salary £75,000 £72,500 £70,000
% change year-on-year +3.45% +3.57% +7.69%

All Programming Languages
Scotland

Java is in the Programming Languages category. The following table is for comparison with the above and provides summary statistics for all permanent job vacancies advertised in Scotland with a requirement for coding skills.

Permanent vacancies with a requirement for coding skills 1,254 2,387 2,341
As % of all permanent jobs advertised in Scotland 42.35% 48.41% 50.85%
Number of salaries quoted 769 1,472 1,582
10th Percentile £35,000 £37,500 £33,750
25th Percentile £45,000 £43,750 £40,000
Median annual salary (50th Percentile) £57,500 £57,500 £50,000
Median % change year-on-year - +15.00% +5.26%
75th Percentile £72,433 £71,250 £66,250
90th Percentile £82,548 £85,000 £80,000
UK median annual salary £65,000 £65,000 £60,000
% change year-on-year - +8.33% +9.09%

Java
Job Vacancy Trend in Scotland

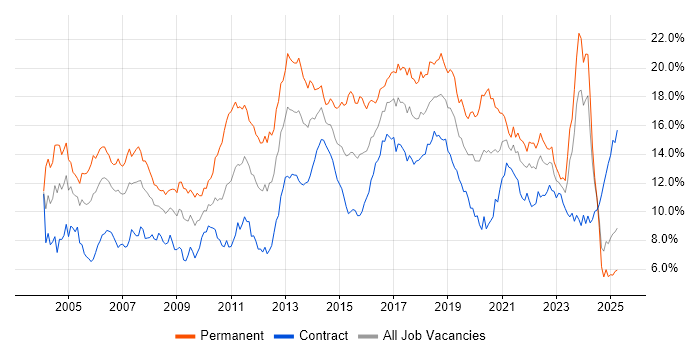
Job postings citing Java as a proportion of all IT jobs advertised in Scotland.

Job vacancy trend for Java in Scotland

Java
Salary Trend in Scotland

3-month moving average salary quoted in jobs citing Java in Scotland.

Salary trend for Java in Scotland

Java
Salary Histogram in Scotland

Salary distribution for jobs citing Java in Scotland over the 6 months to 7 December 2023.

Salary histogram for Java in Scotland

Java
Job Locations in Scotland

The table below looks at the demand and provides a guide to the median salaries quoted in IT jobs citing Java within the Scotland region over the 6 months to 7 December 2023. The 'Rank Change' column provides an indication of the change in demand within each location based on the same 6 month period last year.

Location Rank Change
on Same Period
Last Year
Matching
Permanent
IT Job Ads
Median Salary
Past 6 Months
Median Salary
% Change
on Same Period
Last Year
Live
Jobs
Glasgow +3 241 £61,500 +9.33% 25
Edinburgh -2 203 £70,576 +4.35% 22
Aberdeen +15 11 £35,000 -41.67% 5
West Lothian +11 8 £35,000 -48.15% 1
Fife +16 4 £45,000 - 1
Scottish Borders +9 4 - -
Dundee +3 4 £60,000 +33.33% 3
Aberdeenshire +4 2 £26,500 -
South Lanarkshire +2 2 £65,000 - 2
Moray +4 1 £30,000 -
Java
UK

Java
Co-occurring Skills and Capabilities in Scotland by Category

The follow tables expand on the table above by listing co-occurrences grouped by category. The same employment type, locality and period is covered with up to 20 co-occurrences shown in each of the following categories:

Application Platforms
1 59 (12.11%) Apache Spark
2 20 (4.11%) Confluence
3 15 (3.08%) JBoss
4 14 (2.87%) Apache
4 14 (2.87%) Red Hat Fuse
5 13 (2.67%) WebSphere
6 12 (2.46%) IIS
7 8 (1.64%) WebSphere Application Server
8 5 (1.03%) Tomcat
9 4 (0.82%) Apache Airflow
9 4 (0.82%) Camunda
9 4 (0.82%) Jetty
10 3 (0.62%) Captiva
10 3 (0.62%) FileNet
11 2 (0.41%) IBM HTTP Server
12 1 (0.21%) WebLogic
Applications
1 1 (0.21%) Microsoft Excel
Business Applications
1 2 (0.41%) Oracle Cash Management
1 2 (0.41%) SAP S/4HANA
Cloud Services
1 192 (39.43%) AWS
2 68 (13.96%) Azure
3 66 (13.55%) GCP
4 59 (12.11%) Serverless
5 53 (10.88%) SaaS
6 36 (7.39%) GitHub
7 23 (4.72%) Amazon EC2
8 21 (4.31%) OpenShift
9 13 (2.67%) Amazon SQS
9 13 (2.67%) Cloud Computing
10 10 (2.05%) Amazon EKS
11 9 (1.85%) Amazon S3
11 9 (1.85%) Google Docs
11 9 (1.85%) Lucidchart
11 9 (1.85%) Miro
11 9 (1.85%) Slack
12 8 (1.64%) AWS CloudFormation
12 8 (1.64%) Google Kubernetes Engine
13 6 (1.23%) Azure DevOps
13 6 (1.23%) ChatGPT
Communications & Networking
1 11 (2.26%) TCP/IP
1 11 (2.26%) WAN
2 8 (1.64%) HTTP
3 6 (1.23%) DHCP
3 6 (1.23%) DNS
4 5 (1.03%) VPN
5 4 (0.82%) DSL
5 4 (0.82%) Internet
6 3 (0.62%) Modbus
7 2 (0.41%) Firewall
8 1 (0.21%) Intrusion Detection
Database & Business Intelligence
1 78 (16.02%) Big Data
2 55 (11.29%) NoSQL
3 39 (8.01%) Relational Database
4 32 (6.57%) Hadoop
5 25 (5.13%) MySQL
6 22 (4.52%) Oracle Database
6 22 (4.52%) SQL Server
7 21 (4.31%) MongoDB
8 20 (4.11%) RDBMS
9 19 (3.90%) Amazon RDS
10 15 (3.08%) Elasticsearch
11 13 (2.67%) Redis
12 12 (2.46%) Apache Hive
13 9 (1.85%) HBase
13 9 (1.85%) Scylla
14 7 (1.44%) SQLite
15 6 (1.23%) BigQuery
15 6 (1.23%) Data Lake
15 6 (1.23%) DB2
15 6 (1.23%) PostgreSQL
Development Applications
1 97 (19.92%) Git
2 89 (18.28%) Jenkins
3 47 (9.65%) Maven
4 35 (7.19%) JIRA
5 32 (6.57%) IntelliJ
6 23 (4.72%) Selenium
7 17 (3.49%) JUnit
8 14 (2.87%) Cucumber
9 13 (2.67%) GitLab
9 13 (2.67%) IBM UrbanCode
9 13 (2.67%) Sonatype Nexus
10 9 (1.85%) Oracle Forms
10 9 (1.85%) Postman
10 9 (1.85%) Travis CI
11 8 (1.64%) Gradle
11 8 (1.64%) Visual Studio
12 7 (1.44%) Cypress.io
12 7 (1.44%) LoadRunner
13 6 (1.23%) JDeveloper
14 5 (1.03%) Oracle APEX
General
1 213 (43.74%) Finance
2 187 (38.40%) Inclusion and Diversity
3 125 (25.67%) Law
4 113 (23.20%) Banking
5 88 (18.07%) Social Skills
6 76 (15.61%) Marketing
7 50 (10.27%) Legal
8 29 (5.95%) Police
8 29 (5.95%) Public Sector
9 19 (3.90%) Influencing Skills
10 17 (3.49%) Aerospace
10 17 (3.49%) Analytical Skills
10 17 (3.49%) Investment Banking
11 16 (3.29%) Financial Institution
12 15 (3.08%) Private Banking
13 12 (2.46%) Retail
14 9 (1.85%) Retail Banking
15 4 (0.82%) Presentation Skills
16 3 (0.62%) Games
17 2 (0.41%) Organisational Skills
Job Titles
1 259 (53.18%) Software Engineer
2 107 (21.97%) Senior
3 97 (19.92%) Java Engineer
4 96 (19.71%) Java Software Engineer
5 89 (18.28%) Developer
6 63 (12.94%) Java Developer
7 54 (11.09%) Senior Software Engineer
8 52 (10.68%) Lead
9 45 (9.24%) Architect
10 44 (9.03%) Lead Software Engineer
11 40 (8.21%) Senior Developer
12 35 (7.19%) Senior Java Developer
13 33 (6.78%) Solutions Architect
14 27 (5.54%) Full Stack Engineer
14 27 (5.54%) Full Stack Software Engineer
15 23 (4.72%) Big Data Engineer
15 23 (4.72%) Big Data Software Engineer
16 21 (4.31%) JavaScript Developer
16 21 (4.31%) Senior JavaScript Developer
17 20 (4.11%) React Developer
Libraries, Frameworks & Software Standards
1 159 (32.65%) Spring
2 113 (23.20%) React
3 110 (22.59%) Spring Boot
4 70 (14.37%) Kafka
5 66 (13.55%) AngularJS
6 61 (12.53%) REST
7 60 (12.32%) HTML
8 53 (10.88%) J2EE
9 52 (10.68%) CSS
10 43 (8.83%) .NET
11 38 (7.80%) XML
12 36 (7.39%) Node.js
13 34 (6.98%) JSON
14 32 (6.57%) Hibernate
14 32 (6.57%) SOAP
15 30 (6.16%) RESTful
16 29 (5.95%) Web Services
17 26 (5.34%) JPA
18 24 (4.93%) Ruby on Rails
19 23 (4.72%) React Native
Miscellaneous
1 53 (10.88%) Public Cloud
2 51 (10.47%) Algorithms
3 42 (8.62%) Cloud Native
4 23 (4.72%) Product Ownership
5 20 (4.11%) Robotics
6 18 (3.70%) Blockchain
6 18 (3.70%) Self-Motivation
7 17 (3.49%) Data Structures
7 17 (3.49%) SWIFT Messaging Network
8 15 (3.08%) Distributed Systems
9 11 (2.26%) Clustering
9 11 (2.26%) Legacy Systems
9 11 (2.26%) Private Cloud
10 10 (2.05%) Management Information System
11 9 (1.85%) Greenfield Project
12 7 (1.44%) Hybrid Cloud
12 7 (1.44%) Reference Data
13 5 (1.03%) Enterprise Software
13 5 (1.03%) Onboarding
14 4 (0.82%) Legacy Code
Operating Systems
1 55 (11.29%) Linux
2 29 (5.95%) Windows
3 26 (5.34%) Unix
4 24 (4.93%) Mac OS
5 10 (2.05%) Red Hat Enterprise Linux
6 8 (1.64%) Windows Server
7 5 (1.03%) Ubuntu
8 1 (0.21%) Android
8 1 (0.21%) Apple iOS
Processes & Methodologies
1 307 (63.04%) Software Engineering
2 289 (59.34%) Agile
3 168 (34.50%) Microservices
4 162 (33.26%) SDLC
5 159 (32.65%) Problem-Solving
6 153 (31.42%) CI/CD
7 109 (22.38%) Operational Stability
8 92 (18.89%) Actionable Insight
9 90 (18.48%) DevOps
10 84 (17.25%) Machine Learning
11 82 (16.84%) Artificial Intelligence
12 78 (16.02%) Mentoring
13 77 (15.81%) Continuous Integration
14 67 (13.76%) Design Patterns
15 65 (13.35%) Containerisation
16 64 (13.14%) Community of Practice
17 54 (11.09%) Coaching
17 54 (11.09%) Unit Testing
18 52 (10.68%) Test Automation
19 49 (10.06%) TDD
Programming Languages
1 225 (46.20%) Python
2 189 (38.81%) SQL
3 96 (19.71%) C#
4 87 (17.86%) JavaScript
5 61 (12.53%) Bash
6 48 (9.86%) Ruby
7 44 (9.03%) Scala
8 43 (8.83%) C++
9 38 (7.80%) Go
10 22 (4.52%) TypeScript
11 21 (4.31%) PowerShell
12 19 (3.90%) Perl
12 19 (3.90%) PL/SQL
13 16 (3.29%) C
14 13 (2.67%) Shell Script
15 7 (1.44%) Groovy
16 5 (1.03%) Embedded C
16 5 (1.03%) Embedded C++
17 4 (0.82%) T-SQL
17 4 (0.82%) VB.NET
Qualifications
1 86 (17.66%) Security Cleared
2 64 (13.14%) SC Cleared
3 47 (9.65%) Degree
4 29 (5.95%) Computer Science Degree
5 11 (2.26%) DV Cleared
6 5 (1.03%) AWS Certification
7 3 (0.62%) ITIL Certification
7 3 (0.62%) OCP
7 3 (0.62%) Oracle Certification
8 2 (0.41%) Azure Certification
8 2 (0.41%) ISTQB
8 2 (0.41%) PhD
9 1 (0.21%) AWS Certified Solutions Architect
9 1 (0.21%) GIAC
9 1 (0.21%) Master's Degree
9 1 (0.21%) OSCP
9 1 (0.21%) SANS
Quality Assurance & Compliance
1 26 (5.34%) QA
2 19 (3.90%) SEPA
3 9 (1.85%) SLA
4 6 (1.23%) ISO 20022
5 4 (0.82%) Accessibility
5 4 (0.82%) Data Quality
6 3 (0.62%) GDPR
7 1 (0.21%) Software Quality Assurance
System Software
1 104 (21.36%) Docker
2 11 (2.26%) VMware NSX
3 8 (1.64%) HDFS
4 6 (1.23%) Hyper-V
4 6 (1.23%) VMware Infrastructure
5 5 (1.03%) Active Directory
Systems Management
1 114 (23.41%) Kubernetes
2 39 (8.01%) Terraform
3 17 (3.49%) Ansible
4 14 (2.87%) Puppet
5 8 (1.64%) Grafana
6 5 (1.03%) Jamf Pro
7 4 (0.82%) Istio
8 3 (0.62%) Progress Chef
9 1 (0.21%) Control-M
9 1 (0.21%) Prometheus
9 1 (0.21%) Rancher
Vendors
1 62 (12.73%) Oracle
2 24 (4.93%) Microsoft
3 21 (4.31%) Google
4 19 (3.90%) Splunk
5 18 (3.70%) Databricks
5 18 (3.70%) Dynatrace
6 17 (3.49%) VMware
7 13 (2.67%) IBM
8 10 (2.05%) Dell
9 8 (1.64%) Cloudera
10 7 (1.44%) Pega
10 7 (1.44%) SAP
11 6 (1.23%) Red Hat
11 6 (1.23%) ServiceNow
12 5 (1.03%) HP
12 5 (1.03%) Zscaler
13 4 (0.82%) Cognos
13 4 (0.82%) Confluent
13 4 (0.82%) Informatica
13 4 (0.82%) Sybase